See Historic Comet BA14 Up Close In These New Radar Images

These radar images of comet P/2016 BA14 were taken on March 23, 2016, by scientists using an antenna of NASA's Deep Space Network at Goldstone, California. At the time, the comet was about 2.2 million miles (3.5 million kilometers) from Earth. Credit: NASA/JPL-Caltech/GSSR
These radar images of comet P/2016 BA14 were taken on March 23, 2016, by scientists using an antenna of NASA’s Deep Space Network at Goldstone, California. At the time, the comet was about 2.2 million miles (3.5 million kilometers) from Earth. Credit: NASA/JPL-Caltech/GSSR

On March 22, Comet P/2016 BA14 (Pan-STARRS) flew just 2.2 million miles (3.5 million kilometers) from Earth, making it the third closest comet ever recorded. The last time a comet appeared on our doorstep was in 1770, when Lexell’s Comet breezed by at about half that distance. Through a telescope, comet BA14 looked (and still looks) like a faint star, though time exposures reveal a short, weak tail. With an excellent map and large amateur telescope you might still find it making a bead across the Big Dipper and constellation Bootes tonight through the weekend.


Flyby Comet Imaged by Radar

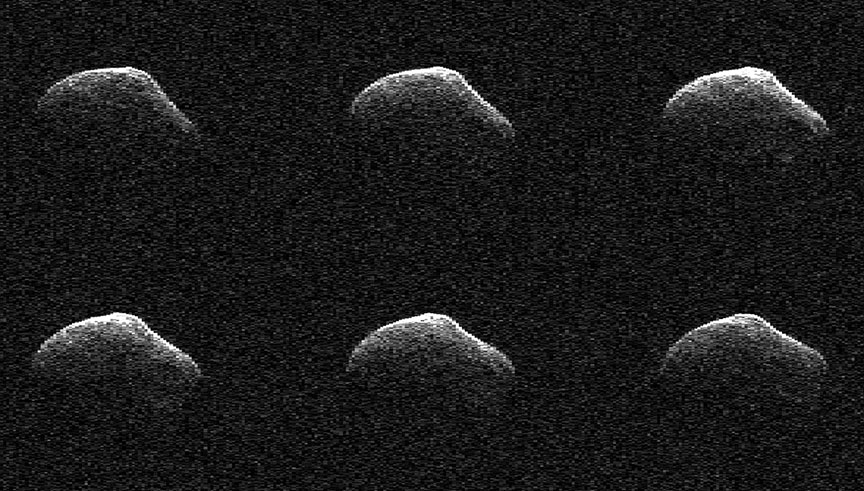
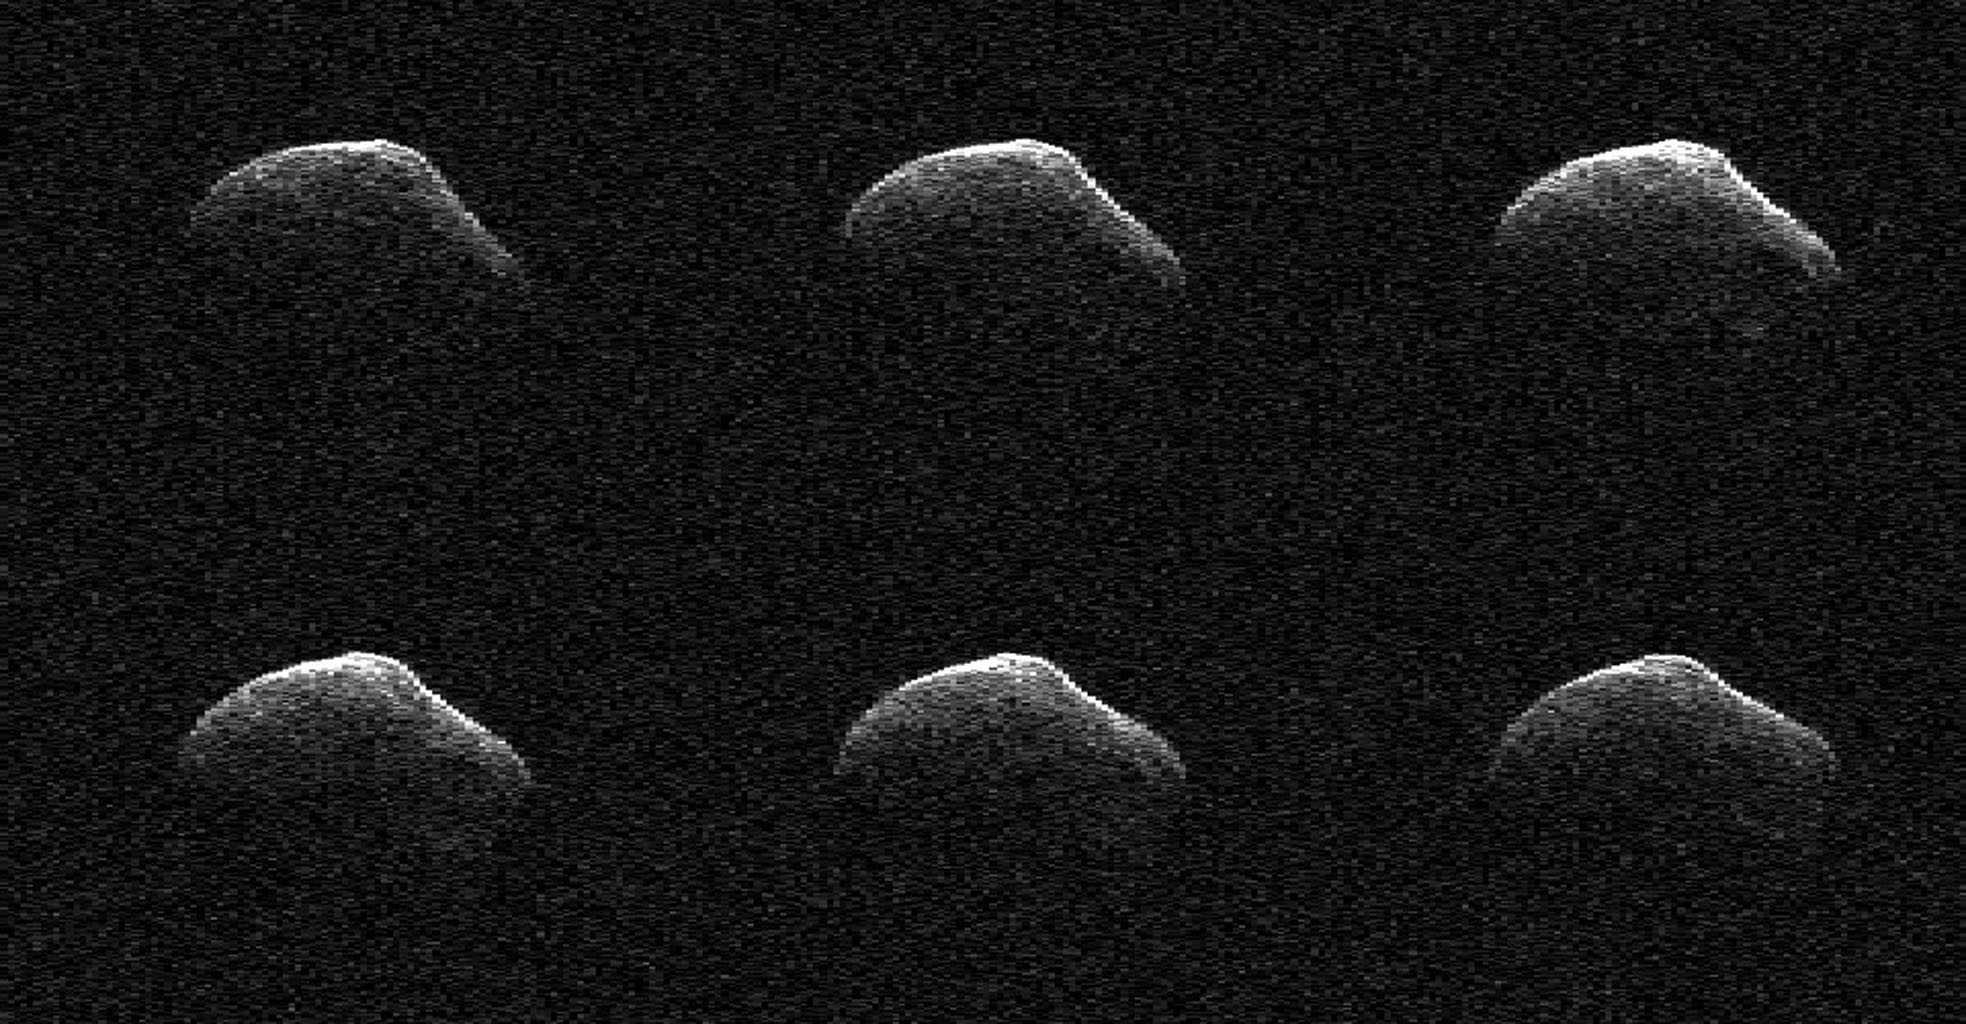
While normal telescopes show few details, NASA’s Goldstone Solar System Radar in California’s Mojave Desert pinged P/2016 BA14 with radar over three nights during closest approach and created a series of crisp, detailed images from the returning echoes. They show a bigger comet than expected — about 3,000 feet (one kilometer) across —  and resolve features as small as 26 feet (8 meters) across.

“The radar images show that the comet has an irregular shape: looks like a brick on one side and a pear on the other,” said Shantanu Naidu, a researcher at NASA’s Jet Propulsion Laboratory. “We can see quite a few signatures related to topographic features such as large flat regions, small concavities and ridges on the surface of the nucleus.”

I honestly thought we’d see a more irregular shape assuming that astronomers were correct in thinking that BA14 broke off from its parent 252P/LINEAR though it’s possible it happened so long ago that the “damage” has been repaired by vaporizing ice softening its contours.

Comets are as dark as charcoal but appear light only because the sun illuminates them against the blackness of outer space. I shone a flashlight on a charcoal briquette (left) to simulate comet lighting. The same charcoal when viewed in normal light appears black. Credit: Bob King

Radar also shows that the comet is rotating on its axis once every 35 to 40 hours. While radar eyes focused on BA14, Vishnu Reddy, of the Planetary Science Institute, Tucson, Arizona, used the NASA Infrared Telescope Facility (IRTF) on Mauna Kea, Hawaii to examine the comet in infrared light. He discovered its dark surface reflects less than 3% of the sunlight that falls on it. The infrared data is expected to yield clues of the comet’s composition as well.

Illustration of Comet 67P/C-G brought down to Earth in the city of Los Angeles, Calif. Compare to the same image (below) as viewed in space. Credit: ESA and anosmicovni
Illustration of Comet 67P/Churyumov-Gerasimenko brought down to Earth in the city of Los Angeles, Calif. Not only can we appreciate its size but also its truly dark surface.  Credit: ESA and anosmicovni

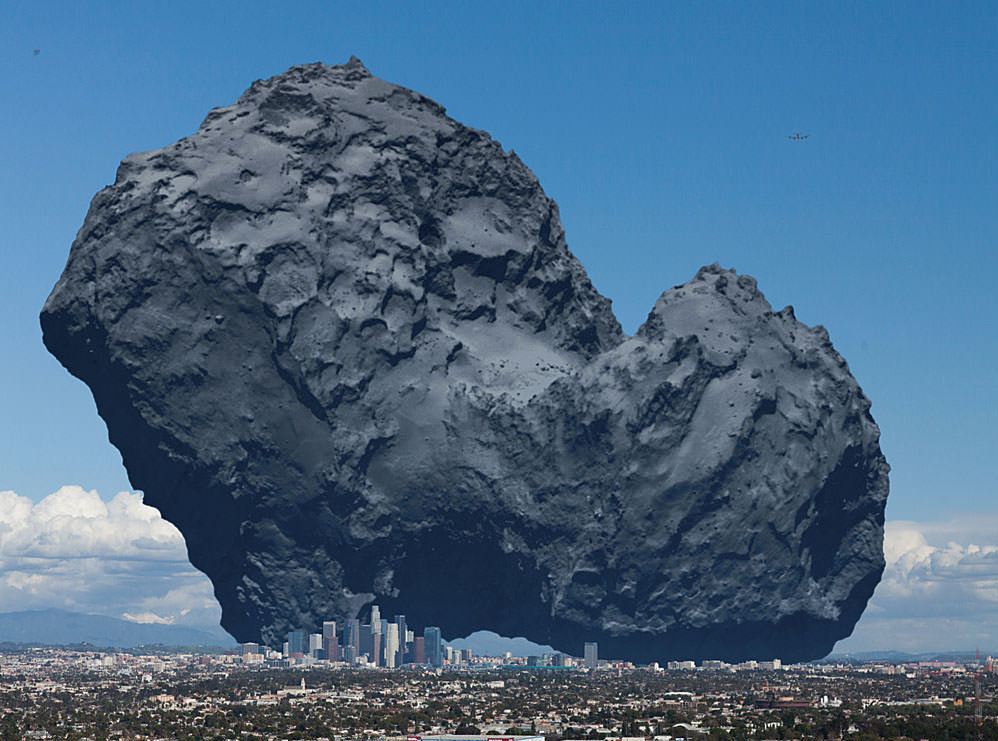
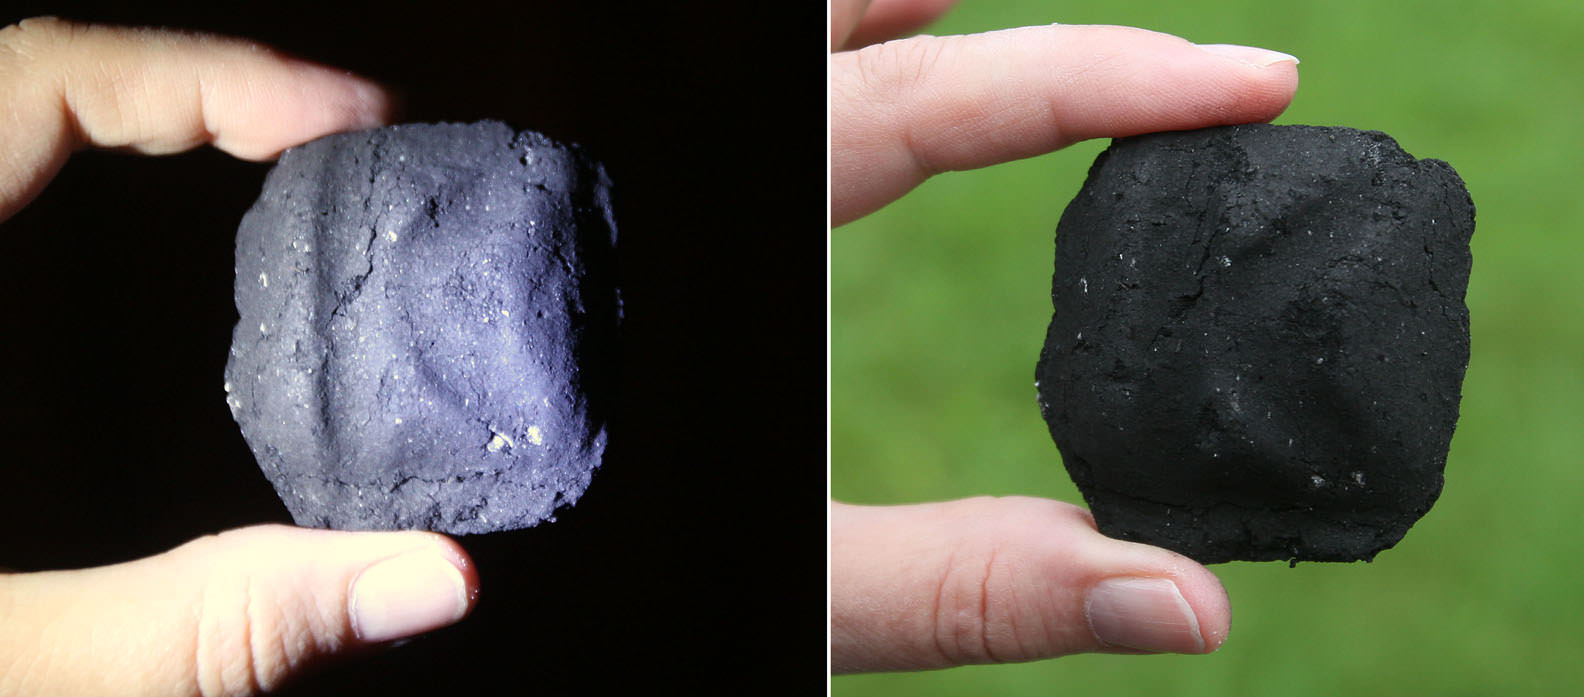
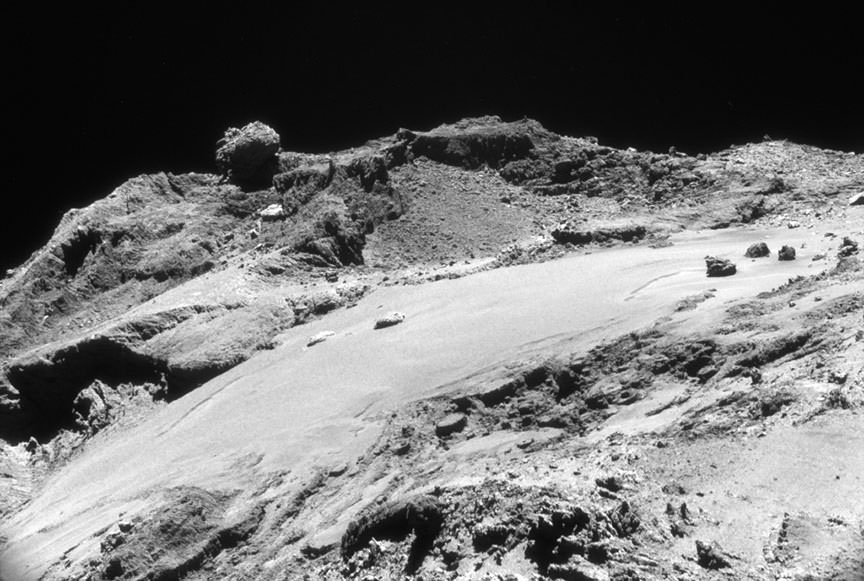
Comets are exceptionally dark objects often compared to the appearance of a fresh asphalt road or parking lot. They appear bright in photos because seen against the blackness of space, they’re still reflective enough to stand out. Comet 67P/Churyumov-Gerasimenko, still the apple of the orbiter Rosetta’s eye, is similarly dark, reflecting about 4% of sunlight.

What makes comets so dark even though they composed primarily of ice? Astronomers believe a comet grows a dark ‘skin’ both from accumulated dust and irradiation of its pristine ices by cosmic rays. Cosmic rays loosen oxygen atoms from water ice, freeing them to combine with simple carbon molecules present on comets to form larger, more complex and darker compounds resembling tars and crude oil. Dust settles on a comet’s surface after it’s set free from ice that vaporizes in sunlight.

Comet 67P/C-G photographed from a distance of just 7.5 miles (12 kilometers) on March 19, 2016 by Rosetta's Navcam. Credit: ESA/Rosetta/NAVCAM – CC BY-SA IGO 3.0.
What a view! Comet 67P/C-G photographed from a distance of just 7.5 miles (12 kilometers) on March 19, 2016 by Rosetta’s Navcam. The largest boulder to the right is Cheops, which stands about 82 feet (25 meters) high. Credit: ESA/Rosetta/NAVCAM – CC BY-SA IGO 3.0

I live in Minnesota, where our annual State Fair features every kind of deep-fried food you can imagine: deep-fried Twinkies, deep-fried fruit, deep-fried bacon and even deep-fried Smores. Just now, I can’t shake the thought that comets are just another deep-fried confection made of pristine, 4.5-billion-year-old ice toasted by eons of sunlight and cosmic bombardment.

ExoMars Mission Narrowly Avoids Exploding Booster

The ExoMars craft releases the Schiaparelli lander in October in this artist's view. Credit: ESA
At least nine moving objects, all thought to be related to a possible explosion of the Breeze-M upper stage after separation from the ExoMars spacecraft, move across the sky in this animation. ExoMars is further ahead and outside the frame. Credit and copyright: OASI Observatory team; D. Lazzaro, S. Silva / ESA
At least nine moving objects, all thought to be related to a possible explosion of the Breeze-M upper stage after separation from the ExoMars spacecraft, move across the sky in this animation made late on March 14. ExoMars is further ahead and outside the frame. Credit and copyright: OASI Observatory team; D. Lazzaro, S. Silva / ESA

On March 14, the ExoMars mission successfully lifted off on a 7-month journey to the planet Mars but not without a little surprise. The Breeze-M upper booster stage, designed to give the craft its final kick toward Mars, exploded shortly after parting from the probe. Thankfully, it wasn’t close enough to damage the spacecraft.

Michel Denis, ExoMars flight director at the European Space Operations, Center in Darmstadt, Germany, said that the two craft were many kilometers apart at the time of the breakup, so the explosion wouldn’t have posed a risk. Still, the mission team won’t be 100% certain until all the science instruments are completely checked over in the coming weeks.

All went well during the takeoff and final separation of the probe, but then something odd happened. Breeze-M was supposed to separate cleanly into two pieces — the main body and a detachable fuel tank — and maneuver itself to a graveyard or “junk” orbit, where rockets and spacecraft are placed at the end of their useful lives, so they don’t cause trouble with operational satellites.

But instead of two pieces, tracking photos taken at the OASI Observatory in Brazil not long after the stage and probe separated show  a cloud of debris, suggesting an explosion occurred that shattered the booster to pieces. There’s more to consider. Space probes intended to either land or be crashed into planets have to pass through strict sterilization procedures that rocket boosters aren’t subject to. Assuming the Breeze-M shrapnel didn’t make it to its graveyard orbit, there exists the possibility some of it might be heading for Mars. If any earthly bugs inhabit the remains, it could potentially lead to unwanted consequences on Mars.

And this isn’t the first time a Russian Breeze-M has blown up.

According to Russian space observer Anatoly Zak in a recent article in Popular Mechanics, a Breeze-M that delivered a Russian spy satellite into orbit last December exploded on January 16. Propellant in one of its fuel tanks may not have been properly vented into space; heated by the sun, the tank’s contents likely combusted and ripped the stage apart. A similar incident occurred in October 2012.

The ExoMars craft releases the Schiaparelli lander in October in this artist's view. Credit: ESA
Artist view of the ExoMars craft releasing the Schiaparelli lander in October. Credit: ESA

For now, we’ll embrace the good news that the spacecraft, which houses the Trace Gas Orbiter (TGO) and the Schiaparelli lander, are underway to Mars and in good health.

ExoMars is a joint venture between the European Space Agency (ESA) and the Russian Federal Space Agency (Roscosmos). One of the mission’s key goals is to follow up on the methane detection made by ESA’s Mars Express probe in 2004 to understand where the gas comes from. Mars’ atmosphere is 95% carbon dioxide with the remaining 5% divided among nitrogen, argon, oxygen and others including small amounts of methane, a gas that on Earth is produced largely by living creatures.

NASA researchers using telescopes right here on Earth also detected multiple methane plumes coming from the surface on Mars in 2003. Credit: Trent Schindler/NASA

Scientists want to know how martian methane got into the atmosphere. Was it produced by biology or geology? Methane, unless it is continuously produced by a source, only survives in the Martian atmosphere for a few hundreds of years because it quickly breaks down to form water and carbon dioxide. Something is refilling the atmosphere with methane but what?

TGO will also look at potential sources of other trace gases such as volcanoes and map the planet’s surface. It can also detect buried water-ice deposits, which, along with locations identified as sources of the trace gases, could influence the choice of landing sites of future missions.

The orbiter will also act as a data relay for the second ExoMars mission — a rover and stationary surface science platform scheduled for launch in May 2018 and arriving in early 2019.

Schiaparelli will demonstrate the capability of ESA and European industry to perform a controlled landing on the surface of Mars. Credit: ESA
Schiaparelli will demonstrate the capability of ESA and European industry to perform a controlled landing on the surface of Mars. It will also gather data on Mars’ atmosphere. Credit: ESA

On October 16, when the spacecraft is still 559,000 miles (900,000 kilometers) from the Red Planet, the Schiaparelli lander will separate from the orbiter and three days later parachute down to the Martian surface. The orbiter will take measurements of the planet’s atmosphere (including methane) as well as any atmospheric electrical fields.

Clouds gather over Mars' Hellas Basin in this photo taken March 23. The Red Planet has intrigued humankind for centuries. Credit: Anthony Wesley
Clouds gather over Mars’ Hellas Basin in this photo taken March 23. The Red Planet has intrigued humankind for centuries. Credit: Anthony Wesley

Mars is a popular place. There are currently five active orbiters there: two European (Mars Express and Mars Odyssey), two American (Mars Reconnaissance Orbiter and MAVEN), one Indian (Mars Orbiter Mission) and two rovers (Opportunity and Curiosity) with another lander and orbiter en route!

The Moon’s Other Axis

A six degree True Polar Wander occurred on the Moon due to ancient volcanic activity. Image: University of Arizona/James Tuttle Keane

It’s tempting to think that the Moon never changes. You can spend your whole life looking at it, and see no evidence of change whatsoever. In fact, the ancients thought the whole Universe was unchanging.

You may have heard of a man named Aristotle. He thought the Universe was eternal and unchanging. Obviously, with our knowledge of the Big Bang, stellar evolution, and planetary formation, we know better. Still, the placid and unchanging face of the Moon can tempt us into thinking astronomers are making up all this evolving universe stuff.

But now, according to a new paper in Nature, the Moon’s axis of rotation is different now than it was billions of years ago. Not only that, but volcanoes may been responsible for it. Volcanoes! On our placid little Moon.

The clue to this lunar True Polar Wander (TPW) is in the water ice locked in the shadows of craters on the Moon. When hydrogen was discovered on the surface of the Moon in the 1990s by the Lunar Prospector probe, scientists suspected that they would eventually find water ice. Subsequent missions proved the presence of water ice, especially in craters near the polar regions. But the distribution of that water-ice wasn’t uniform.

You would expect to see ice uniformly distributed in the shadows of craters in the polar regions, but that’s not what scientists have found. Instead, some craters had no evidence of ice at all, which led the team behind this paper to conclude that these ice-free craters must have been exposed to the Sun at some point. What else would explain it?

The way that the ice in these craters is distributed forms two trails that lead away from each pole. They’re mirror images of each other, but they don’t conform with the Moon’s current axis of rotation, which is what led the team to conclude that the Moon underwent a 6 degree TPW billions of years ago.

The paper also highlights the age of the water on the Moon. Since the TPW, and the melting of some of the ice as a result of it, occurred some billions of years ago, then the water ice that is still frozen in the shadows of some of the Moon’s craters must be ancient. According to the paper, its existence records the “early delivery of water to the inner Solar System.” Hopefully, a future mission will return a sample of this ancient water for detailed study.

But even more interesting than the age of the ice in the craters and the TPW, to me anyways, is what is purported to have caused it. The team behind the paper reports that volcanic activity on the Moon in the Procellarum region, which was most active in the early history of the Moon, moved a substantial amount of material and “altered the density structure of the Moon.” This alteration would have changed the moments of inertia on the Moon, resulting in a TPW.

It’s strange to think of the Moon with volcanic activity viewable from Earth. I wonder what effect visible lunar volcanoes would have had on thinkers like Aristotle, if lunar volcanic activity had occurred during recorded history, rather than ending one billion years ago or so.

We know that events like eclipses and comets caused great confusion and sometimes upheaval in ancient civilizations. Would lunar volcanoes have had the same effect?

Most ‘Outrageous’ Luminous Galaxies Ever Observed

An artist's conception of an extremely luminous infrared galaxy similar to the ones reported in this paper. Image credit: NASA/JPL-Caltech.

Astronomers might be running out of words when it comes to describing the brightness of objects in the Universe.

Luminous, Super-Luminous, Ultra-Luminous, Hyper-Luminous. Those words have been used to describe the brightest objects we’ve found in the cosmos. But now astronomers at the University of Massachusetts Amherst have found galaxies so bright that new adjectives are needed. Kevin Harrington, student and lead author of the study describing these galaxies, says, “We’ve taken to calling them ‘outrageously luminous’ among ourselves, because there is no scientific term to apply.”

The terms “ultra-luminous” and “hyper-luminous” have specific meanings in astronomy. An infrared galaxy is called “ultra-luminous” when it has a rating of about 1 trillion solar luminosities. At 10 trillion solar luminosities, the term “hyper-luminous” is used. For objects greater than that, at around 100 trillion solar luminosities, “we don’t even have a name,” says Harrington.

The size and brightness of these 8 galaxies is astonishing, and their existence comes as a surprise. Professor Min Yun, who leads the team, says, “The galaxies we found were not predicted by theory to exist; they’re too big and too bright, so no one really looked for them before.” These newly discovered galaxies are thought to be about 10 billion years old, meaning they were formed about 4 billion years after the Big Bang. Their discovery will help astronomers understand the early Universe better.

“Knowing that they really do exist and how much they have grown in the first 4 billion years since the Big Bang helps us estimate how much material was there for them to work with. Their existence teaches us about the process of collecting matter and of galaxy formation. They suggest that this process is more complex than many people thought,” said Yun.

Gravitational lensing plays a role in all this though. The galaxies are not as large as they appear from Earth. As their light passes by massive objects on its way to Earth, their light is magnified. This makes them look 10 times brighter than they really are. But event taking gravitational lensing into account, these are still impressive objects.

But it’s not just the brightness of these objects that are significant. Gravitational lensing of a galaxy by another galaxy is rare. Finding 8 of them is unheard of, and could be “another potentially important discovery,” says Yun. The paper highlights these galaxies as being among the most interesting objects for further study “because the magnifying property of lensing allows us to probe physical details of the intense star formation activities at sub-kpc scale…”

The team’s analysis also shows that the extreme brightness of these galaxies is caused solely by star formation.“The Milky Way produces a few solar masses of stars per year, and these objects look like they forming one star every hour,” Yun says. Harrington adds, “We still don’t know how many tens to hundreds of solar masses of gas can be converted into stars so efficiently in these objects, and studying these objects might help us to find out.”

It took a tag team of telescopes to discover and confirm these outrageously luminous galaxies. The team of astronomers, led by Professor Min Yun, used the 50 meter diameter Large Millimeter Telescope for this work. It sits atop an extinct volcano in Mexico, the 15,000 foot Sierra Negra. They also relied on the Herschel Observatory, and the Planck Surveyor.

Moonbase by 2022 For $10 Billion, Says NASA

Based on a series of articles that were recently made available to the public, NASA predicts it could build a base on the Moon by 2022, and for cheaper than expected. Credit: NASA

Returning to the Moon has been the fevered dream of many scientists and astronauts. Ever since the Apollo Program culminated with the first astronauts setting foot on the Moon on July 20th, 1969, we have been looking for ways to go back to the Moon… and to stay there. In that time, multiple proposals have been drafted and considered. But in every case, these plans failed, despite the brave words and bold pledges made.

However, in a workshop that took place in August of 2014, representatives from NASA met with Harvard geneticist George Church, Peter Diamandis from the X Prize Foundation and other parties invested in space exploration to discuss low-cost options for returning to the Moon. The papers, which were recently made available in a special issue of New Space, describe how a settlement could be built on the Moon by 2022, and for the comparatively low cost of $10 billion.

Continue reading “Moonbase by 2022 For $10 Billion, Says NASA”

Solar Storms Ignite Aurora On Jupiter

Composite images from the Chandra X-Ray Observatory and the Hubble Space Telescope show the hyper-energetic x-ray auroras at Jupiter. The image on the left is of the auroras when the coronal mass ejection reached Jupiter, the image on the right is when the auroras subsided. The auroras were triggered by a coronal mass ejection from the Sun that reached the planet in 2011. Image: X-ray: NASA/CXC/UCL/W.Dunn et al, Optical: NASA/STScI

The Earthly Northern Lights are beautiful and astounding, but when it comes to planetary light shows, what happened at Jupiter in 2011 might take the cake. In 2011, a coronal mass ejection (CME) struck Jupiter, producing x-ray auroras 8 times brighter than normal, and hundreds of times more energetic than Earth’s auroras. A paper in the March 22nd, 2016 issue of the Journal of Geophysical Research gave the details.

The Sun emits a ceaseless stream of energetic particles called the solar wind. Sometimes, the Sun ramps up its output, and what is called a coronal mass ejection occurs. A coronal mass ejection is a massive burst of matter and electromagnetic radiation. Though they’re slow compared to other phenomena arising from the Sun, such as solar flares, CMEs are extremely powerful.

When the CME in 2011 reached Jupiter, NASA’s Chandra X-Ray Observatory was watching, the first time that Jupiter’s X-ray auroras were monitored at the same time that a CME arrived. Along with some very interesting images of the event, the team behind the study learned other things. The CME that struck Jupiter actually compressed that planet’s magnetosphere. It forced the boundary between the solar wind and Jupiter’s magnetic field in towards the planet by more than 1.6 million kilometers (1 million miles.)

The scientists behind this study used the data from this event to not only pinpoint the source of the x-rays, but also to identify areas for follow-up investigation. They’ll be using not only Chandra, but also the European Space Agency’s XMM Newton observatory to collect data on Jupiter’s magnetic field, magnetosphere, and aurora.

NASA’s Juno spacecraft will reach Jupiter this summer. One of its primary missions is to map Jupiter’s magnetic fields, and to study the magnetosphere and auroras. Juno’s results will be fascinating to anyone interested in Jupiter’s auroras.

Here at Universe Today we’ve written about Jupiter’s aurora’s here, coronal mass ejections here, and the Juno mission here.

High Albedo Points To Huge Collision Forming Plutonian System

Data from New Horizons supports the theory that Pluto's 4 small moons were formed as a result of a collision. Image by NASA/Johns Hopkins University Applied Physics Laboratory/Southwest Research Institute

The high albedo (reflectivity) of some of Pluto’s moons supports the theory that those moons were formed as a result of a collision, rather than being Kuiper Belt Objects (KBOs) that wandered too close and were captured by Pluto’s gravity. Data supporting the collision theory came from NASA’s New Horizons spacecraft as it flew by Pluto in July 2015.

The Pluto system is a complex one. Pluto has 5 moons: Charon, Styx, Nix, Kerberos, and Hydra. Charon is the only moon that is tidally locked with Pluto, and the two are sometimes called a double dwarf planet. The system’s barycenter lies between Pluto and Charon, though much closer to Pluto. The objects in the system move in near-circular orbits, rather than ellipses.

Pluto and Charon were thought to have formed the same way the other planets formed in the Solar System; by coalescing out of a ring of debris left over after the Sun formed. Then, it was thought, the other Plutonian moons were captured from the Kuiper Belt. Pluto resides in the Kuiper Belt, so this made sense. Some of the other moons in our Solar System, like Neptune’s Triton and Saturn’s Phoebe, are also thought to be captured Kuiper Belt Objects (KBOs).

A competing theory for the formation of the Pluto system is the collision theory. This theory states that Pluto and Charon did indeed coalesce out of the ring of debris around the Sun, and that Charon was itself a dwarf planet. But a collision occurred after that, about 4 or 4.5 billion years ago, between Pluto and an object about the same size as Pluto.

This collision left Pluto and Charon in their binary state, but created a circumbinary disk of debris out of which the other 4 moons formed. There are competing versions of these theories, one of which suggests that all of Pluto’s 5 moons were formed by this collision, and none coalesced out of the circumstellar disk of debris that the other planets were formed from.

New Horizons has delivered measurements and data showing that the albedo of Pluto’s 4 smallest moons is much too high for captured KBOs. Their surface reflectivity is highly suggestive of a water-ice composition. Measured KBOs have a geometric albedo of less than .20, while Styx, Nix, Hydra, and Kerberos have values of .40, .57, .56, and .45 respectively. This points to the idea that the object that collided with Pluto 4 to 4.5 billion years ago had at least some icy surface layers.

Pluto’s 4 small moons, Styx, Nix, Kerberos, and Hydra, are all non-spheroidal. This also points to their origins as conglomerated objects which formed from a collision-induced debris disk, rather than as captured Kuiper Belt objects.

These results were published in the journal Science, on March 18th, 2016. They were gathered using the Long-Range Reconnaissance Imager (LORRI), and the Multispectral Visible Imaging Camera (MVIC) instruments on board New Horizons.

Half of the data from New Horizons’ visit to Pluto is yet to arrive, including data from the Linear Etalon Imaging Spectral Array (LEISA). Scientists are hopeful that this data, and all the existing data which together will take years to analyze, will answer some of the questions surrounding the formation of the Pluto system.

Best NASA Images Yet Of Ceres’ Brightest Spot

adsf
The bright central spots near the center of Occator Crater are shown in enhanced color in this view from NASA’s Dawn spacecraft. The view was produced by combining the highest resolution images taken in February 2016 at an image scale of 115 feet (35 meters) per pixel with color images obtained in September 2015 at a lower resolution added. Click for a highest-res view. Credit: NASA/JPL-Caltech/UCLA/MPS/DLR/IDA/PSI

Ah, dome sweet dome. Scientists from NASA’s Dawn mission unveiled new images from the spacecraft’s lowest orbit at Ceres, including highly anticipated views of Occator Crater, at the 47th annual Lunar and Planetary Science Conference in The Woodlands, Texas, on Tuesday. The new images, taken from Dawn’s low-altitude mapping orbit (LAMO) of 240 miles (385 kilometers) above Ceres, reveal a dome in a smooth-walled pit in the bright center of the crater. Linear fractures crisscross the top and flanks of the dome with still more fractures slicing across the nearby plains.

Occator Crater, measuring 57 miles (92 kilometers) across and 2.5 miles (4 kilometers) deep, contains the brightest area on Ceres. Image Credit: NASA/JPL-Caltech/UCLA/MPS/DLR/IDA/PSI
Occator Crater, measuring 57 miles (92 kilometers) across and 2.5 miles (4 kilometers) deep, contains the brightest area on Ceres. This photo has been exposed to show detail in the crater and landscape, so the bright spots are overexposed. The closeup photos on the other hand are correctly exposed to show detail in the spots but necessarily underexpose the landscape and make it look very dark. Credit: NASA/JPL-Caltech/UCLA/MPS/DLR/IDA/PSI

“Before Dawn began its intensive observations of Ceres last year, Occator Crater looked to be one large bright area. Now, with the latest close views, we can see complex features that provide new mysteries to investigate,” said Ralf Jaumann, planetary scientist and Dawn co-investigator at the German Aerospace Center (DLR) in Berlin. “The intricate geometry of the crater interior suggests geologic activity in the recent past, but we will need to complete detailed geologic mapping of the crater in order to test hypotheses for its formation.”

The bright central spots near the center of Occator Crater are shown in enhanced color in this view from NASA's Dawn spacecraft. The view was produced by combining the highest resolution images taken in February 2016 (at image scales 115 feet (35 meters) per pixel of 35 meters with color images obtained in September 2015 at a lower resolution. Click for a highest-res view. Credit: NASA/JPL-Caltech/UCLA/MPS/DLR/IDA/PSI
Black and white view of the bright spots in Occator Crater. Credit: NASA/JPL-Caltech/UCLA/MPS/DLR/IDA/PSI

Like me, you’ve probably been anticipating LAMO for months, when we’d finally get our clearest view of the famous “bright spots”. Spectral observations have shown that the patches are consistent with a magnesium sulfate called hexahydrite that resembles the more familiar Epsom salts here on Earth. Scientists think these salt-rich areas were residue left behind when water-ice sublimated in the past. Impacts from asteroids could have broken into Ceres’ crust and possibly unearthed salt-rich ices. Exposed to the vacuum of space, the ice would have sublimated (vaporized), leaving the salt behind.

This global map shows the surface of Ceres in enhanced color, encompassing infrared wavelengths beyond human visual range. Images taken using infrared (965 nanometers), green (555 nanometers) and blue (438 nanometers) spectral filters were combined to create this view. Credit: NASA/JPL-Caltech/UCLA/MPS/DLR/IDA/PSI
This global map shows the surface of Ceres in enhanced color, including infrared wavelengths beyond human visual range. Photos were taken using infrared, green and blue filters and combined to create this view. Credit: NASA/JPL-Caltech/UCLA/MPS/DLR/IDA/PSI

The team also released an enhanced color map of the surface of Ceres that reveals a diversity of surface materials and how they relate to Ceres’ landforms. The dwarf planet doesn’t have as many large impact basins as scientists expected, but the number of smaller craters generally matches their predictions. The blue material highlighted in the color map is related to flows, smooth plains and mountains, which appear to be very young surface features.

“Although impact processes dominate the surface geology on Ceres, we have identified specific color variations on the surface indicating material alterations that are due to a complex interaction of the impact process and the subsurface composition,” Jaumann said. “Additionally, this gives evidence for a subsurface layer enriched in ice and volatiles.”

 This map shows a portion of the northern hemisphere of Ceres with neutron counting data acquired by the gamma ray and neutron detector (GRaND) instrument aboard NASA's Dawn spacecraft. These data reflect the concentration of hydrogen in the upper yard (or meter) of regolith, the loose surface material on Ceres. The color information is based on the number of neutrons detected per second by GRaND. Counts decrease with increasing hydrogen concentration. The color scale of the map is from blue (lowest neutron count) to red (highest neutron count). Lower neutron counts near the pole suggest the presence of water ice within about a yard (meter) of the surface at high latitudes.

This map shows part of Ceres’ northern hemisphere with neutron counting data from Dawn’s gamma ray and neutron detector (GRaND) instrument and reflect the concentration of hydrogen in the upper yard (or meter) of regolith, the loose surface material on Ceres. Colors are based on the number of neutrons detected per second by GRaND. Counts decrease with increasing hydrogen concentration. The color scale of the map is from blue (lowest neutron count) to red (highest neutron count). Lower neutron counts near the pole suggest the presence of water ice within about a yard (meter) of the surface at high latitudes. Credit: NASA/JPL-Caltech/UCLA/MPS/DLR/IDA/PSI

We’re learning more about that subsurface ice thanks to Dawn’s Gamma Ray and Neutron Detector (GRaND). Neutrons and gamma rays produced by cosmic rays interacting with the topmost yard (meter) of the loose rock and dust called regolith provide a fingerprint of Ceres’ chemical makeup. Lower counts indicate the presence of hydrogen, and since water’s rich in hydrogen (H2o), the results from GRanD suggest concentrations of water ice in the near-surface at high latitudes.

“Our analyses will test a longstanding prediction that water ice can survive just beneath Ceres’ cold, high-latitude surface for billions of years,” said Tom Prettyman, the lead for GRaND and Dawn co-investigator at the Planetary Science Institute, Tucson, Arizona.

Ceres’ Oxo Crater (right) is the only place on the dwarf planet where water has been detected on the surface so far. Credit: NASA/JPL-Caltech/UCLA/MPS/DLR/IDA/PSI

Dawn scientists also reported that the Visual and Infrared Mapping Spectrometer (VIR) has detected water at Oxo Crater, a young, 6-mile-wide (9-kilometer-wide) feature in Ceres’ northern hemisphere. This water could either be bound up in minerals or exist as ice and may have been exposed during a landslide or impact or a combination of the two events.  Oxo is the only place on Ceres where water has been detected at the surface so far.

Ceres' Haulani Crater (21 miles, 34 kilometers wide) is shown in these views from the visible and infrared mapping spectrometer (VIR) aboard NASA's Dawn spacecraft. These views reveal variations in the region's brightness, mineralogy and temperature at infrared wavelengths. The image at far left shows brightness variations in Haulani. Light with a wavelength of 1200 nanometers is shown in blue, 1900 nanometers in green and 2300 nanometers in red. The view at center is a false color image, highlighting differences in the types of rock and ejected material around the crater. Scientists see this as evidence that the material in this area is not uniform, and that the crater's interior has a different composition than its surroundings.
Ceres’ Haulani Crater (21 miles, 34 kilometers wide) is shown in these views made with VIR. They reveal variations in the region’s brightness, mineralogy and temperature at infrared wavelengths in the types of rock and ejected material around the crater. Scientists see this as evidence that the material in this area is not uniform, and that the crater’s interior has a different composition than its surroundings. Credit: NASA/JPL-Caltech/UCLA/MPS/DLR/IDA/PSI

Not only have scientists found evidence of possible extensive subsurface ice, but the composition of the surface is variable. Using VIR, which measures mineral composition by how those minerals reflect sunlight, they found that Haulani Crater shows a different proportion of surface materials than its surroundings. While the surface of Ceres is mostly made of a mixture of materials containing carbonates and phyllosilicates (clays), their relative proportion varies across the surface.

“False-color images of Haulani show that material excavated by an impact is different than the general surface composition of Ceres. The diversity of materials implies either that there is a mixed layer underneath, or that the impact itself changed the properties of the materials,” said Maria Cristina de Sanctis, the VIR instrument lead scientist.

All these cool stuff we’re finding out about this small body makes it nearly as exciting as Pluto. Taking a closer look is the best form of education.

Ancient Pluto May Have Had Lakes And Rivers Of Nitrogen

The New Horizons team used "principal component analysis" to get this false-color image that highlights the different regions of Pluto. Image: NASA/New Horizons/JHAPL

The New Horizons probe revealed the surface features of Pluto in rich detail when it reached the dwarf planet in July 2015. Some of the features look like snapshots of rivers and lakes that are locked firmly in place by Pluto’s frigid temperatures. But now scientists studying the data coming back from New Horizons think that those frozen lakes and rivers could once have been liquid nitrogen.

Pluto has turned out be a surprisingly active place. New Horizons has shown us what might be clouds in Pluto’s atmosphere, mountains that might be ice volcanoes, and cliffs made of methane ice that melt away into the plains. If there were oceans and rivers of liquid nitrogen on the surface of Pluto, that would fit in with our evolving understanding of Pluto as a much more active planet than we thought.

Richard Binzel, a New Horizons team member from MIT, thinks that lakes of liquid nitrogen could have existed some 800 or 900 million years ago. It all stems from Pluto’s axial tilt, which at 120 degrees is much more pronounced than Earth’s relatively mild 23 degree tilt. And computer modelling suggests that this tilt could have even been more extreme many millions of years ago.

The result of this extreme tilt is that much more of Pluto’s surface would have been exposed to sunlight. That may have warmed Pluto enough to allow liquid nitrogen to flow over the planet’s surface. These kinds of changes to a planet’s axial tilt, (and precession and eccentricity) affect a planet’s climate in what are called Milankovitch cycles. The same cycles are thought to have a similar effect on Earth’s climate, though not as extreme as on Pluto.

According to Binzel, Pluto could be somewhere in between its temperature extremes, meaning that if Pluto will ever be warm enough for liquid nitrogen again, it could be hundreds of millions of years from now. “Right now, Pluto is between two extreme climate states,” Binzel says.

Alan Stern is a planetary scientist at the Southwest Research Institute, and New Horizons’ Principal Investigator. He thinks that these long-cycle climate changes could have a very pronounced effect on Pluto, which has a nitrogen-rich atmosphere. In ancient times, Pluto’s atmosphere could have been more dense than Mars’. “This opens up the possibility that liquid nitrogen may have once or even many times flowed on Pluto’s surface,” he said.

More data from New Horizons is still on its way. About half is yet to arrive. That data, and further analysis, might discredit the fledgling idea that Pluto had and will have again lakes of liquid nitrogen. “We are just beginning to understand the long-term climate of Pluto,” said Binzel.

This week is the 47th Lunar and Planetary Science Conference (LPSC) in Houston. Members of the New Horizons team will be presenting almost 40 reports on Pluto and its system of moons at this conference. Stern’s lecture, titled “The Exploration of Pluto,” will be archived online at http://livestream.com/viewnow/LPSC2016.

Kepler Catches Early Flash Of An Exploding Star

“Life exists because of supernovae,” said Steve Howell, project scientist for NASA’s Kepler and K2 missions at NASA’s Ames Research Center. “All heavy elements in the universe come from supernova explosions. For example, all the silver, nickel, and copper in the earth and even in our bodies came from the explosive death throes of stars.”

So a glimpse of a supernova explosion is of intense interest to astronomers. It’s a chance to study the creation and dispersal of the life-enabling elements themselves. A greater understanding of supernovae will lead to a greater understanding of the origins of life.

Stars are balancing acts. They are a struggle between the pressure to expand, created by the fusion in the star, and the gravitational urge to collapse, caused by their own enormous mass. When the core of a star runs out of fuel, the star collapses in on itself. Then there is a massive explosion, which we call a supernova. And only very large stars can become supernovae.

The brilliant flashes that accompany supernovae are called shock breakouts. These events last only about 20 minutes, an infinitesimal amount of time for an object that can shine for billions of years. But when Kepler captured two of these events in 2011, it was more than just luck.

Peter Garnavich is an astrophysics professor at the University of Notre Dame. He led an international team that analyzed the light from 500 galaxies, captured every 30 minutes over a period of 3 years by Kepler. They searched about 50 trillion stars, trying to catch one as it died as a supernova. Only a fraction of stars are large enough to explode as supernovae, so the team had their work cut out for them.

“In order to see something that happens on timescales of minutes, like a shock breakout, you want to have a camera continuously monitoring the sky,” said Garnavich. “You don’t know when a supernova is going to go off, and Kepler’s vigilance allowed us to be a witness as the explosion began.”

An artist's concept of a shock breakout. Image: NASA Ames/STScl/G. Bacon
An artist’s concept of a shock breakout. Image: NASA Ames/STScl/G. Bacon

In 2011 Kepler caught two gigantic stars as they died their supernova death. Called KSN 2011a, and KSN 2011d, the two red super-giants were 300 times and 500 times the size of our Sun respectively. 2011a was 700 million light years from Earth, and 2011d was 1.2 billion light years away.

The intriguing part of the two supernovae is the difference between them; one had a visible shock breakout and one did not. This was puzzling, since in other respects, both supernovae behaved much like theory predicted they would. The team thinks that the smaller of the two, KSN 2011a, may have been surrounded by enough gas to mask the shock breakout.

The Kepler spacecraft is well-known for searching for and discovering extrasolar planets. But when some components on board Kepler failed in 2013, the mission was re-cast as the K2 Mission. “While Kepler cracked the door open on observing the development of these spectacular events, K2 will push it wide open, observing dozens more supernovae,” said Tom Barclay, senior research scientist and director of the Kepler and K2 guest observer office at Ames. “These results are a tantalizing preamble to what’s to come from K2!”

(For a brilliant and detailed look at the life-cycle of stars, I recommend “The Life and Death of Stars” by Kenneth R. Lang.)