More Evidence that the Milky Way has Four Spiral Arms

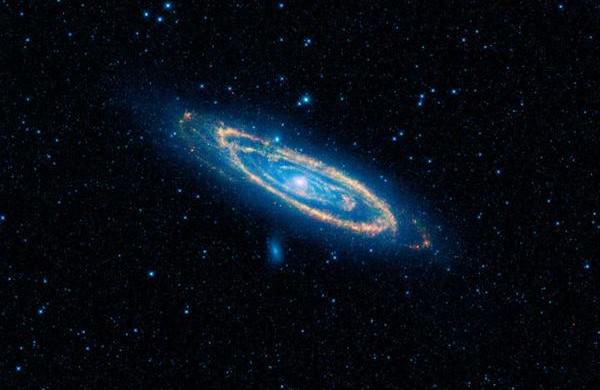
Astronomers have been arguing over just how many spiral arms our Galaxy exhibits. Is the Milky Way a four or two-armed spiral galaxy? Astronomers had often assumed the Milky Way was potentially a four-armed spiral galaxy, but comparatively recent observations from NASA’s Spitzer telescope implied the Galaxy had two spiral arms.  In 2013, astronomers mapped star forming regions and argued they had found the two missing arms, bringing the total number of arms back to four.

The case for a four-armed Milky Way may have just gotten stronger.

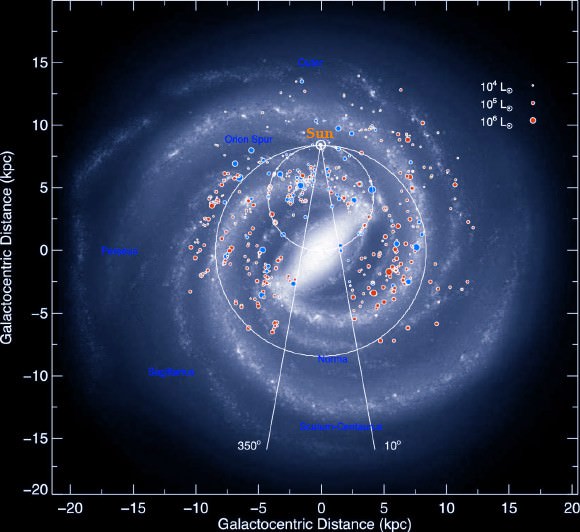
A team of Brazilian astronomers used star clusters embedded in their natal clouds to trace the Galaxy’s structure. “Our results favour a four-armed spiral Galaxy, which includes the Sagittarius-Carina, Perseus, and Outer arms.”, remarked the group from the Universidade Federal do Rio Grande do Sul.

Image credit: Urquhart JS et al / Robert Hurt, the Spitzer Science Center / Robert Benjamin.
Spiral map of the Galaxy by Urquhart et al. 2013 (image credit: Urquhart et al. 2013, R. Hurt, the Spitzer Science Center, R. Benjamin).

“Despite efforts aimed at improving our understanding of the Galaxy’s structure, questions remain. There is no consensus regarding the number and shape of the Galaxy’s spiral arms.”, noted lead author D. Camargo.  He added that the Sun’s location within the obscured disc of the Galaxy was a principal factor hindering our understanding of the Milky Way’s broader structure.  In other words, we do not have a bird’s eye view of our Galaxy.

The team remarked that young embedded clusters are excellent tracers of the Galaxy’s structure, “The present results indicate that the Galaxy’s embedded clusters are predominantly located in the spiral arms.”  They noted that star formation may occur after the collapse and fragmentation of giant molecular clouds found within spiral arms, and consequently the young embedded star clusters that subsequently emerge are excellent probes of Galactic structure as they have not displaced far from their birthplace.

A projected face-on view of the distribution of embedded star clusters studied by Camargo et al. 2015. The objects appear to lie on the Sagittarius-Carina spiral arm, Perseus arm, and potentially an extension of the Outer arm (image credit: Camargo et al. 2015).

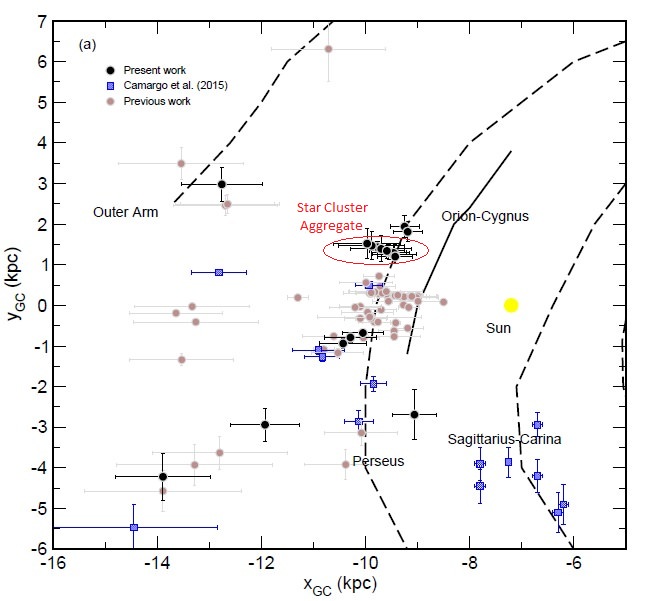
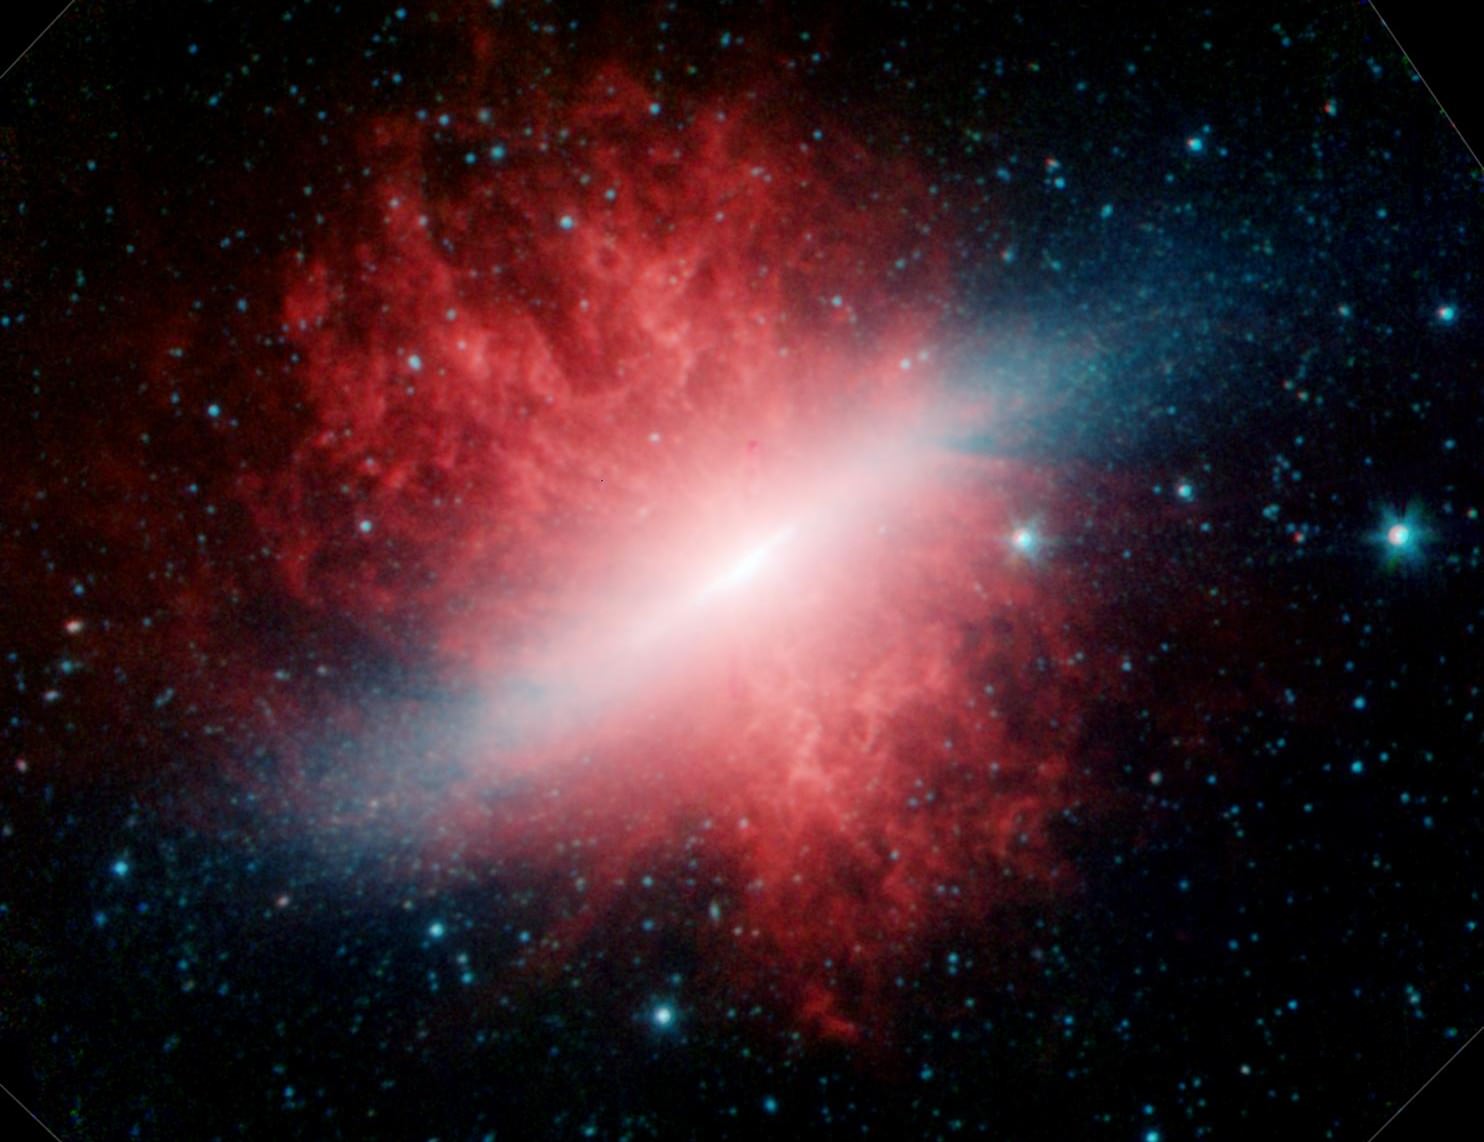
The team used data from NASA’s WISE infrared telescope to identify young clusters still embedded in their natal clouds, which are often encompassed by significant dust.  Infrared stellar light is less obscured by dust than visible light, giving the astronomers an unprecedented view.  Indeed, the group discovered 7 new embedded clusters, several of which (designated Camargo 441-444) may belong to a larger aggregate that resides in the Perseus arm.   They suggested that a giant molecular cloud was compressed by the spiral arm which may have triggered star formation in several clumps, and numerous star clusters with similar ages emerged (an alternative or concurrent scenario is sequential formation).

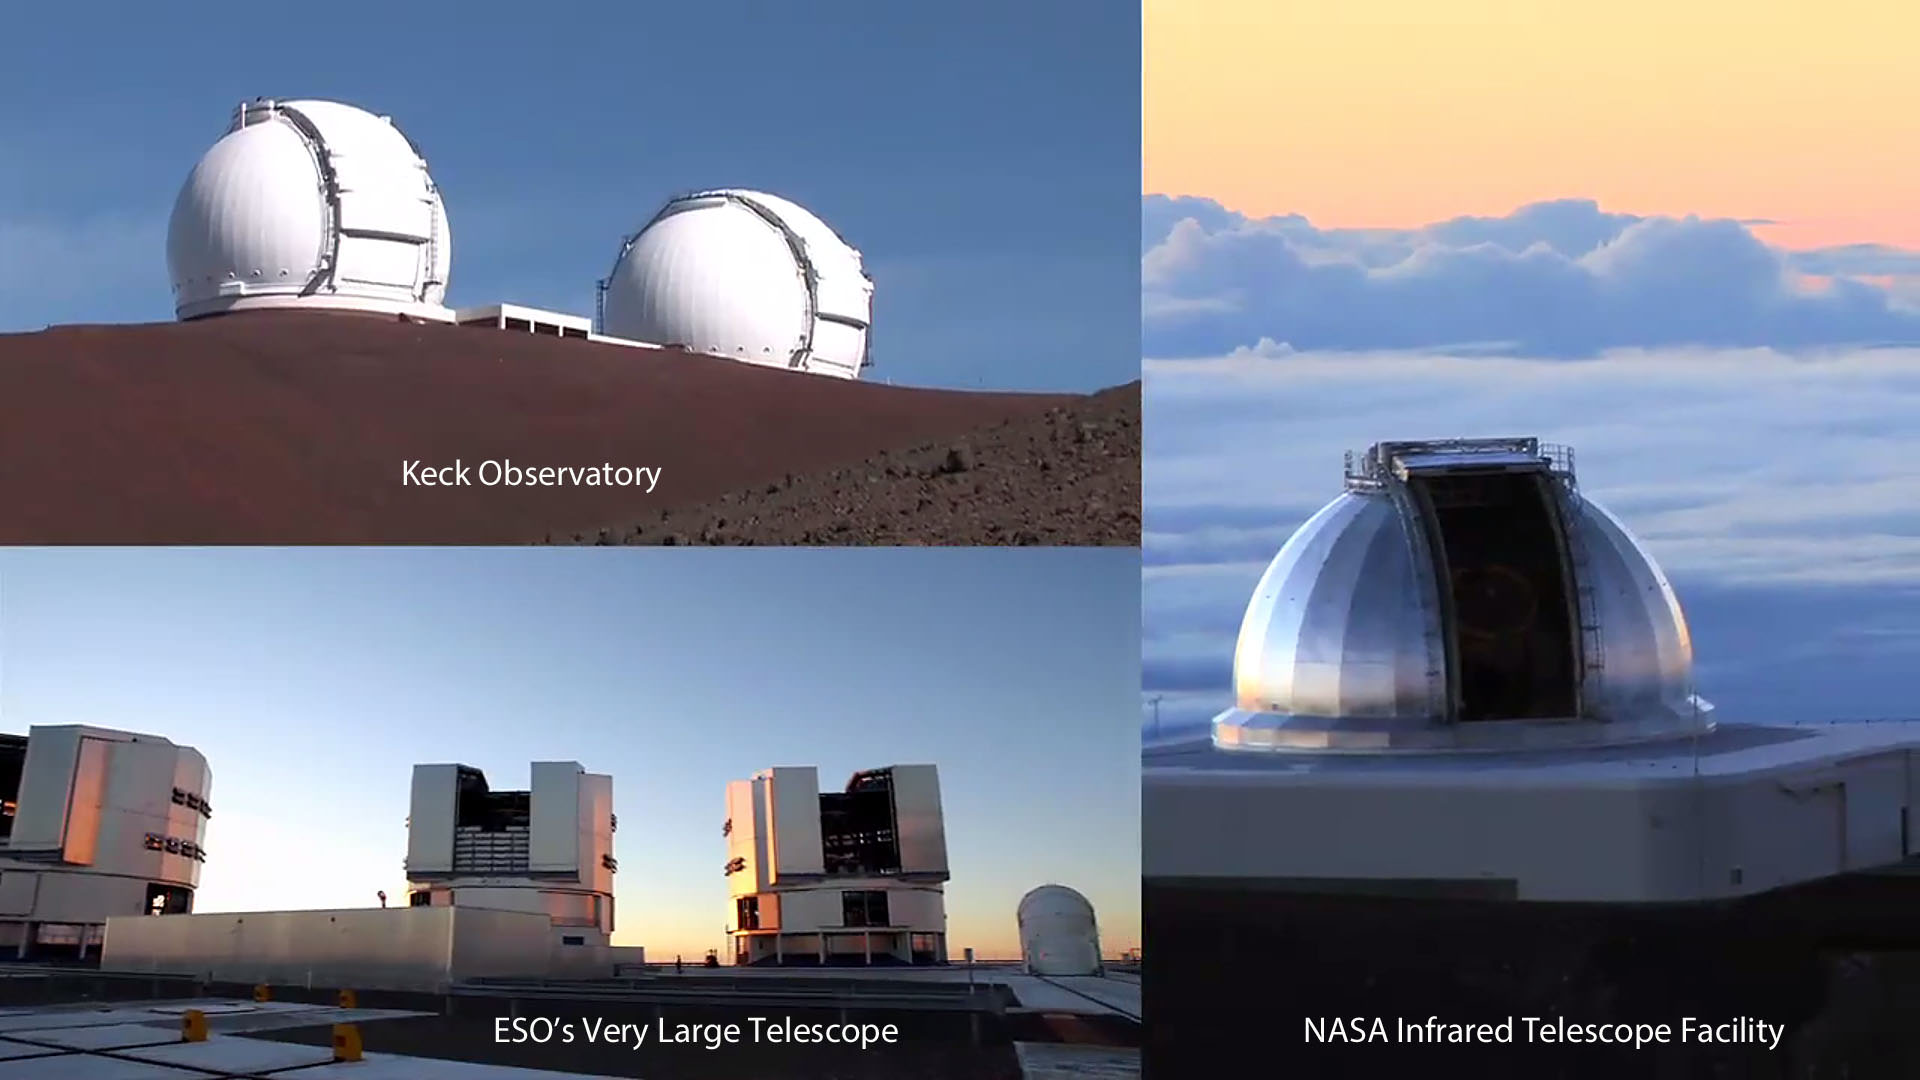
Astronomer A. Mainzer discusses NASA’s WISE telescope (Wide-Field Infrared Survey Explorer), which was used by Camargo et al. 2015 to identify embedded star clusters.

The team also used near-infrared data from the 2MASS survey to determine distances for the star clusters, once the objects were identified in the WISE images.  A primary goal of their work was to establish accurate fundamental cluster parameters, which would bolster any resulting conclusions concerning the Galaxy’s overall structure.   An innovative algorithm was therefore adopted to minimize contamination by foreground and background stars along the sight-line, which may otherwise appear as cluster members and degrade the reliability of any distant estimates.

“The embedded clusters in the present sample are distributed along the Sagittarius-Carina, Perseus, and Outer arms.”, concluded the team. They likewise noted that the search for new embedded clusters throughout the entire Galaxy must continue unabated, since such targets may foster our understanding of the Galaxy’s structure.

The discoveries are described in a new study by D. Camargo, C. Bonatto, and E. Bica that is entitled “Tracing the Galactic spiral structure with embedded clusters”. The research has been accepted for publication, and will appear in a forthcoming issue of the Monthly Notices of the Royal Astronomical Society (MNRAS).  A preprint of the work is available on arXiv.

100,000 Galaxies, and No Obvious Signs of Life

This is a false-color image of the mid-infrared emission from the Great Galaxy in Andromeda, as seen by Nasa's WISE space telescope. The orange color represents emission from the heat of stars forming in the galaxy's spiral arms. The G-HAT team used images such as these to search 100,000 nearby galaxies for unusually large amounts of this mid-infrared emission that might arise from alien civilizations. Credit: NASA/JPL-Caltech/WISE Team

Beam us up, Scotty. There’s no signs of intelligent life out there. At least, no obvious signs, according to a recent survey performed by researchers at Penn State University. After reviewing data taken by the NASA Wide-field Infrared Survey Explorer (WISE) space telescope of over 100,000 galaxies, there appears to be little evidence that advanced, spacefaring civilizations exist in any of them.

First deployed in 2009, the WISE mission has been able to identify thousands of asteroids in our solar system and previously undiscovered star clusters in our galaxy. However, Jason T. Wright, an assistant professor of astronomy and astrophysics at the Center for Exoplanets and Habitable Worlds at Penn State University, conceived of and initiated a new field of research – using the infrared data to assist in the search for signs of extra-terrestrial civilizations.

And while their first look did not yield much in the way of results, it is an exciting new area of research and provides some very useful information on one of the greatest questions ever asked: are we alone in the universe?

“The idea behind our research is that, if an entire galaxy had been colonized by an advanced spacefaring civilization, the energy produced by that civilization’s technologies would be detectable in mid-infrared wavelengths,” said Wright, “exactly the radiation that the WISE satellite was designed to detect for other astronomical purposes.”

This logic is in keeping with the theories of Russian astronomer Nikolai Kardashev and theoretical physicist Freeman Dyson. In 1964, Kardashev proposed that a civilization’s level of technological advancement could be measured based on the amount of energy that civilization is able to utilize.

Freemon Dyson theorized that eventually, a civilization would be able to build a megastructure around its star to capture all its energy. Credit: SentientDevelopments.com
Freemon Dyson theorized that eventually, a civilization would be able to enclose its star with a megastructure that would to capture and utilize its energy. Credit: sentientdevelopments.com

To characterize the level of extra-terrestrial development, Kardashev developed a three category system – Type I, II, and III civilizations –  known as the “Kardashev Scale”. A Type I civilization uses all available resources on its home planet, while a Type II is able to harness all the energy of its star. Type III civilizations are those that are advanced enough to harness the energy of their entire galaxy.

Similarly, Dyson proposed in 1960 that advanced alien civilizations beyond Earth could be detected by the telltale evidence of their mid-infrared emissions. Believing that a sufficiently advanced civilization would be able to enclose their parent star, he believed it would be possible to search for extraterrestrials by looking for large objects radiating in the infrared range of the electromagnetic spectrum.

These thoughts were expressed in a short paper submitted to the journal Science, entitled “Search for Artificial Stellar Sources of Infrared Radiation“. In it, Dyson proposed that an advanced species would use artificial structures – now referred to as “Dyson Spheres” (though he used the term “shell” in his paper) – to intercept electromagnetic radiation with wavelengths from visible light downwards and radiating waste heat outwards as infrared radiation.

“Whether an advanced spacefaring civilization uses the large amounts of energy from its galaxy’s stars to power computers, space flight, communication, or something we can’t yet imagine, fundamental thermodynamics tells us that this energy must be radiated away as heat in the mid-infrared wavelengths,” said Wright. “This same basic physics causes your computer to radiate heat while it is turned on.”

Wide-field Infrared Survey Explorer, or WISE, will scan the entire sky in infrared light, picking up the glow of hundreds of millions of objects and producing millions of images
The Wide-field Infrared Survey Explorer (WISE) scans the entire sky in infrared light, picking up the glow of hundreds of millions of objects and producing millions of images. Credit: NASA/JPL-Caltech

However, it was not until space-based telescopes like WISE were deployed that it became possible to make sensitive measurements of this radiation. WISE is one of three infrared missions currently in space, the other two being NASA’s Spitzer Space Telescope and the Herschel Space Observatory – a European Space Agency mission with important NASA participation.

WISE is different from these missions in that it surveys the entire sky and is designed to cast a net wide enough to catch all sorts of previously unseen cosmic interests. And there are few things more interesting than the prospect of advanced alien civilizations!

To search for them, Roger Griffith – a postbaccalaureate researcher at Penn State and the lead author of the paper – and colleagues scoured the entries in the WISE satellites database looking for evidence of a galaxy that was emitting too much mid-infrared radiation. He and his team then individually examined and categorized 100,000 of the most promising galaxy images.

And while they didn’t find any obvious signs of a Type II civilization or Dyson Spheres in any of them, they did find around 50 candidates that showed unusually high levels of mid-infrared radiation. The next step will be to confirm whether or not these signs are due to natural astronomical processes, or could be an indication of a highly advanced civilization tapping their parent star for energy.

WISE will find the most luminous galaxies in the universe -- incredibly energetic objects bursting with new stars. The infrared telescope can see the glow of dust that shrouds these galaxies, hiding them from visible-light telescopes. An example of a dusty, luminous galaxy is shown here in this infrared portrait of the "Cigar" galaxy taken by NASA's Spitzer Space Telescope. Dust is color-coded red, and starlight blue. Credit: NASA/JPL-Caltech/Steward Observatory
WISE will take images of the most luminous galaxies in the universe, such as the “Cigar” galaxy shown here – taken by NASA’s Spitzer Space Telescope. Credit: NASA/JPL-Caltech/Steward Observatory

In any case, the team’s findings were quite interesting and broke new ground in what is sure to be an ongoing area of research. The only previous study, according to the G-HAT team, surveyed only about 100 galaxies, and was unable to examine them in the infrared to see how much heat they emitted. What’s more, the research may help shed some light on the burning questions about the very existence of intelligent, extra-terrestrial life in our universe.

“Our results mean that, out of the 100,000 galaxies that WISE could see in sufficient detail, none of them is widely populated by an alien civilization using most of the starlight in its galaxy for its own purposes,” said Wright. “That’s interesting because these galaxies are billions of years old, which should have been plenty of time for them to have been filled with alien civilizations, if they exist. Either they don’t exist, or they don’t yet use enough energy for us to recognize them.”

Alas, it seems we are no closer to resolving the Fermi Paradox. But for the first time, it seems that investigations into the matter are moving beyond theoretical arguments. And given time, and further refinements in our detection methods, who knows what we might find lurking out there? The universe is very, very big place, after all.

The research team’s first research paper about their Glimpsing Heat from Alien Technologies Survey (G-HAT) survey appeared in the Astrophysical Journal Supplement Series on April 15, 2015.

Further Reading: Astrophysical Journal via EurekAlert, JPL-NASA

Mars Loses an Ocean But Gains the Potential for Life

NASA scientists have determined that a primitive ocean on Mars held more water than Earth's Arctic Ocean and that the Red Planet has lost 87 percent of that water to space. Credit: NASA/GSFC

It’s hard to believe it now looking at Mars’ dusty, dessicated landscape that it once possessed a vast ocean. A recent NASA study of the Red Planet using the world’s most powerful infrared telescopes clearly indicate a planet that sustained a body of water larger than the Earth’s Arctic Ocean.

If spread evenly across the Martian globe, it would have covered the entire surface to a depth of about 450 feet (137 meters). More likely, the water pooled into the low-lying plains that cover much of Mars’ northern hemisphere. In some places, it would have been nearly a mile (1.6 km) deep. 

Three of the best infrared observatories in the world were used to study normal to heavy water abundances in Mars atmosphere, especially the polar caps, to create a global map of the planet's water content and infer an ancient ocean. Credit: NASA/ GSFC
Three of the best infrared observatories in the world were used to study normal to heavy water abundances in Mars atmosphere, especially the polar caps, to create a global map of the planet’s water content and infer an ancient ocean. Credit: NASA/ GSFC

Now here’s the good part. Before taking flight molecule-by-molecule into space, waves lapped the desert shores for more than 1.5 billion years – longer than the time life needed to develop on Earth. By implication, life had enough time to get kickstarted on Mars, too.

A hydrogen atom is made up of one proton and one electron, but its heavy form, called deuterium, also contains a neutron. HDO or heavy water is rare compared to normal drinking water, but being heavier, more likely to stick around when the lighter form vaporizes into space. Credit: NASA/GFSC

Using the three most powerful infrared telescopes on Earth – the W. M. Keck Observatory in Hawaii, the ESO’s Very Large Telescope and NASA’s Infrared Telescope Facility – scientists at NASA’s Goddard Space Flight Center studied water molecules in the Martian atmosphere. The maps they created show the distribution and amount of two types of water – the normal H2O version we use in our coffee and HDO or heavy water, rare on Earth but not so much on Mars as it turns out.

Maps showing the distribution of H20 and HDO across the planet made with the trio of infrared telescopes. Credit: NASA/GSFC
Maps showing the distribution of H20 and HDO (heavy water) across the planet made with the trio of infrared telescopes. Credit: NASA/GSFC

In heavy water, one of the hydrogen atoms contains a neutron in addition to its lone proton, forming an isotope of hydrogen called deuterium. Because deuterium is more massive than regular hydrogen, heavy water really is heavier than normal water just as its name implies. The new “water maps” showed how the ratio of normal to heavy water varied across the planet according to location and season. Remarkably, the new data show the polar caps, where much of Mars’ current-day water is concentrated, are highly enriched in deuterium.

It's thought that
It’s thought that the decay of Mars’ once-global magnetic field, the solar wind stripped away much of the planet’s early, thicker atmosphere, allowing solar UV light to break water molecules apart. Lighter hydrogen exited into space, concentrating the heavier form. Some of the hydrogen may also departed due to the planet’s weak gravity. Credit: NASA/GSFC

On Earth, the ratio of deuterium to normal hydrogen in water is 1 to 3,200, but at the Mars polar caps it’s 1 to 400.  Normal, lighter hydrogen is slowly lost to space once a small planet has lost its protective atmosphere envelope, concentrating the heavier form of hydrogen. Once scientists knew the deuterium to normal hydrogen ratio, they could directly determine how much water Mars must have had when it was young. The answer is A LOT!

Goddard scientists estimate that only 13% of Mars' original water reserves are still around today, concentrated in the icy polar caps. The rest took off for space. Credit: NASA/GSFC
Goddard scientists estimate that only 13% of Mars’ original water reserves are still around today, concentrated in the icy polar caps. The rest took off for space. Credit: NASA/GSFC

Only 13% of the original water remains on the planet, locked up primarily in the polar regions, while 87% of the original ocean has been lost to space. The most likely place for the ocean would have been the northern plains, a vast, low-elevation region ideal for cupping huge quantities of water. Mars would have been a much more earth-like planet back then with a thicker atmosphere, providing the necessary pressure, and warmer climate to sustain the ocean below.

Mars at the present time has little to no liquid water on its cold, desert-like surface. Long ago, the Sun saw its reflection from wave-rippled lakes and a northern ocean. Credit: NASA/GSFC
Mars at the present time has little to no liquid water on its cold, desert-like surface. Long ago, the Sun almost certainly saw its reflection from wave-rippled lakes and a northern ocean. Credit: NASA/GSFC

What’s most exciting about the findings is that Mars would have stayed wet much longer than originally thought. We know from measurements made by the Curiosity Rover that water flowed on the planet for 1.5 billion years after its formation. But the new study shows that the Mars sloshed with the stuff much longer. Given that the first evidence for life on Earth goes back to 3.5 billion years ago – just a billion years after the planet’s formation – Mars may have had time enough for the evolution of life.

So while we might bemoan the loss of so wonderful a thing as an ocean, we’re left with the tantalizing possibility that it was around long enough to give rise to that most precious of the universe’s creations – life.

To quote Charles Darwin: “… from so simple a beginning endless forms most beautiful and most wonderful have been, and are being, evolved.

Illustration showing Mars evolving from a wet world to the present-day Red Planet. Credit: NASA/GSFC
Illustration showing Mars evolving from a wet world to the present-day where liquid water can’t pond on its surface without vaporizing directly into the planet’s thin air. As Mars lost its atmosphere over billions of years, the remaining water, cooled and condensed to form the north and south polar caps. Credit: NASA/GSFC

What Asteroid 2004 BL86 and Hawaii Have in Common

Toes of a pahoehoe flow advance across a road in Kalapana on the east rift zone of Kilauea Volcano, Hawaii and the binary asteroid 2004 BL86. Credit: U.S. Geological Survey (left) and NASA/JPL-Caltech

At first glance, you wouldn’t think Hawaii has any connection at all with asteroid 2004 BL86, the one that missed Earth by 750,000 miles (1.2 million km) just 3 days ago. One’s a tropical paradise with nightly pig roasts, beaches and shave ice; the other an uninhabitable ball of bare rock untouched by floral print swimsuits.

But Planetary Science Institute researchers Vishnu Reddy and Driss Takir would beg to differ.

Using NASA’s Infrared Telescope Facility on Mauna Kea, Hawaii they discovered that the speedy “space mountain” has a composition similar to the very island from which they made their observations – basalt.

“Our observations show that this asteroid has a spectrum similar to V-type asteroids,” said Reddy. “V-type asteroids are basalt, similar in composition to lava flows we see in Hawaii.

Minerals on the surface of an object like the moon or an asteroid absorb particular wavelengths of light to create a series of "blank spaces" or absorption lines that are unique to a particular element or compound. Credit: NASA
Minerals on the surface of an object like the moon or an asteroid absorb wavelengths of light to create a series of “blank spaces” or absorption lines that are unique to a particular element or compound. Credit: NASA

The researchers used a spectrograph to study infrared sunlight reflected from 2004 BL86 during the flyby. A spectrograph splits light into its component colors like the deli guy slicing up a nice salami. Among the colors are occasional empty spaces or what astronomers call absorption lines, where minerals such as olivine, pyroxene and plagioclase on the asteroid’s surface have removed or absorbed particular slices of sunlight.

You're looking straight down on the 310-mile-wide Rheasilvea crater / impact basin on the asteroid Vesta. Credit: NASA/JPL-Caltech/UCLA/MPS/DLR/IDA
You’re looking straight down into the 310-mile-wide (500 km) Rheasilvea crater / impact basin on the asteroid Vesta. It’s though that many of the Vesta-like asteroids, including 2004 BL86, originated from the impact. It Credit: NASA/JPL-Caltech/UCLA/MPS/DLR/IDA

These are the same materials that not only compose earthly basalts – all that dark volcanic rock that underlies Hawaii’s reefs and resorts – but also Vesta, considered the source of V-type asteroids. It’s thought that the impact that hollowed out the vast Rheasilvia crater at Vesta’s south pole blasted chunks of mama asteroid into space to create a family of smaller siblings called vestoids.


This animation, created from individual radar images, clearly show the rough outline of 2004 BL86 and its newly-discovered moon. Credit: NASA/JPL-Caltech
This animation, created from individual radar images, shows the binary asteroid 2004 BL86 on January 26th.  The moon’s orbital period is about 13.8 hours. Credit: NASA/JPL-Caltech

So it would appear that 2004 BL86 could be a long-lost daughter born through impact and released into space to later be perturbed by Jupiter into an orbit that periodically brings it near Earth. Close enough to watch in wonder as it inches across the field of view of our telescopes like it did earlier this week.

The little moonlet may or may not be related to Vesta, but its presence makes 2004 BL86 a binary asteroid, where each object revolves about their common center of gravity. While the asteroid is unlikely to become future vacation destination, there will always be Hawaii to satisfy our longings for basalt.

Hearing the Early Universe’s Scream: Sloan Survey Announces New Findings

A still photo from an animated flythrough of the universe using SDSS data. This image shows our Milky Way Galaxy. The galaxy shape is an artist’s conception, and each of the small white dots is one of the hundreds of thousands of stars as seen by the SDSS. Image credit: Dana Berry / SkyWorks Digital, Inc. and Jonathan Bird (Vanderbilt University)

Imagine a single mission that would allow you to explore the Milky Way and beyond, investigating cosmic chemistry, hunting planets, mapping galactic structure, probing dark energy and analyzing the expansion of the wider Universe. Enter the Sloan Digital Sky Survey, a massive scientific collaboration that enables one thousand astronomers from 51 institutions around the world to do just that.

At Tuesday’s AAS briefing in Seattle, researchers announced the public release of data collected by the project’s latest incarnation, SDSS-III. This data release, termed “DR12,” represents the survey’s largest and most detailed collection of measurements yet: 2,000 nights’ worth of brand-new information about nearly 500 million stars and galaxies.

One component of SDSS is exploring dark energy by “listening” for acoustic oscillation signals from the the acceleration of the early Universe, and the team also shared a new animated “fly-through” of the Universe that was created using SDSS data.

The SDSS-III collaboration is based at the powerful 2.5-meter Sloan Foundation Telescope at the Apache Point Observatory in New Mexico. The project itself consists of four component surveys: BOSS, APOGEE, MARVELS, and SEGUE. Each of these surveys applies different trappings to the parent telescope in order to accomplish its own, unique goal.

BOSS (the Baryon Oscillation Spectroscopic Survey) visualizes the way that sound waves produced by interacting matter in the early Universe are reflected in the large-scale structure of our cosmos. These ancient imprints, which date back to the first 500,000 years after the Big Bang, are especially evident in high-redshift objects like luminous-red galaxies and quasars. Three-dimensional models created from BOSS observations will allow astronomers to track the expansion of the Universe over a span of 9 billion years, a feat that, later this year, will pave the way for rigorous assessment of current theories regarding dark energy.

At the press briefing, Daniel Eistenstein from the Harvard-Smithsonian Center for Astrophysics explained how BOSS requires huge volumes of data and that so far 1.4 million galaxies have been mapped. He indicated the data analyzed so far strongly confirm dark energy’s existence.

This tweet from the SDSS twitter account uses a bit of humor to explain how BOSS works:

APOGEE (the Apache Point Observatory Galactic Evolution Experiment) employs a sophisticated, near-infrared spectrograph to pierce through thick dust and gather light from 100,000 distant red giants. By analyzing the spectral lines that appear in this light, scientists can identify the signatures of 15 different chemical elements that make up the faraway stars – observations that will help researchers piece together the stellar history of our galaxy.

MARVELS (the Multi-Object APO Radial Velocity Exoplanet Large-Area Survey) identifies minuscule wobbles in the orbits of stars, movements that betray the gravitational influence of orbiting planets. The technology itself is unprecedented. “MARVELS is the first large-scale survey to measure these tiny motions for dozens of stars simultaneously,” explained the project’s principal investigator Jian Ge, “which means we can probe and characterize the full population of giant planets in ways that weren’t possible before.”

At the press briefing, Ge said that MARVELS observed 5,500 stars repeatedly, looking for giant exoplanets around these stars. So far, the data has revealed 51 giant planet candidates as well as 38 brown dwarf candidates. Ge added that more will be found with better data processing.

A still photo from an animated flythrough of the universe using SDSS data. This image shows a small part of the large-scale structure of the universe as seen by the SDSS -- just a few of many millions of galaxies. The galaxies are shown in their proper positions from SDSS data. Image credit: Dana Berry / SkyWorks Digital, Inc.
A still photo from an animated flythrough of the universe using SDSS data. This image shows a small part of the large-scale structure of the universe as seen by the SDSS — just a few of many millions of galaxies. The galaxies are shown in their proper positions from SDSS data. Image credit: Dana Berry / SkyWorks Digital, Inc.

SEGUE (the Sloan Extension for Galactic Understanding and Exploration) rounds out the quartet by analyzing visible light from 250,000 stars in the outer reaches of our galaxy. Coincidentally, this survey’s observations “segue” nicely into work being done by other projects within SDSS-III. Constance Rockosi, leader of the SDSS-III domain of SEGUE, recaps the importance of her project’s observations of our outer galaxy: “In combination with the much more detailed view of the inner galaxy from APOGEE, we’re getting a truly holistic picture of the Milky Way.”

One of the most exceptional attributes of SDSS-III is its universality; that is, every byte of juicy information contained in DR12 will be made freely available to professionals, amateurs, and lay public alike. This philosophy enables interested parties from all walks of life to contribute to the advancement of astronomy in whatever capacity they are able.

As momentous as the release of DR12 is for today’s astronomers, however, there is still much more work to be done. “Crossing the DR12 finish line is a huge accomplishment by hundreds of people,” said Daniel Eisenstein, director of the SDSS-III collaboration, “But it’s a big universe out there, so there is plenty more to observe.”

DR12 includes observations made by SDSS-III between July 2008 and June 2014. The project’s successor, SDSS-IV, began its run in July 2014 and will continue observing for six more years.

Here is the video animation of the fly-through of the Universe:

Observing Challenge: How to See Asteroid Hebe, Mother of Mucho Meteorites

A 3-D model of 6 Hebe based on its light curve. The asteroid is about 120 miles in diameter and orbits in the main asteroid belt between Mars and Jupiter. Credit: Charles University_Josef Durech_Vojtech Sidorin

In the reeds that line the banks of the celestial river Eridanus, you’ll find Hebe on the prowl this month. Discovered in 1847 by German amateur astronomer Karl Ludwig Hencke , the asteroid may hold the key to the origin of  the H-chondrites, a large class of metal-rich stony meteorites found in numerous amateur and professional collections around the world. You can now see this interesting minor planet with nothing more than a pair of binoculars or small telescope. 

By his looks, I would not deign to tell Karl Henke to give up on anything.
Judging by his demeanor, it might have been unwise to tell Karl Hencke he was wasting his time looking for asteroids.

The first four asteroids – Ceres, Pallas, Juno and Vesta –  were discovered in quick succession from 1801 to 1807. Then nothing turned up for years. Most astronomers wrongly assumed all the asteroids had been found and moved on to other projects like measuring the orbits of double stars and determining stellar parallaxes. Nothing could have been further from the truth. Hencke, who worked as a postmaster during the day, doggedly persisted in sieving the stars for new asteroids in his free time at night. His systematic search began in 1830. Fifteen years and hundreds of cold nights at the eyepiece later he turned up 5 Astrae (asteroid no. 5) on Dec. 8, 1845, and 6 Hebe on July 1, 1847.

Hebe orbits in the main asteroid belt between Mars and Jupiter with an average distance from the Sun of 225 million miles. It rotates on its axis once every 7.2 hours. Credit: Wikipedia
Hebe orbits in the main asteroid belt between Mars and Jupiter with an average distance from the Sun of 225 million miles. It spins on its axis once every 7.3 hours. Credit: Wikipedia

Energized by the finds, astronomers returned to their telescopes with renewed gusto to join in the hunt once again. The rest is history.  As of November 2014 there are 415,688 numbered asteroids and a nearly equal number of unnumbered discoveries. Fittingly, asteroid 2005 Hencke honors the man who kept the fire burning.

You'll find Hebe trucking along in Eridanus in December just north of the pair of +3.5 magnitude stars Delta (lleft) and Epsilon Eridani. This map shows stars to magnitude +9.5 and Hebe's position is marked every 5 nights. Source: Chris Marriott's SkyMap software
You’ll find Hebe trucking along in Eridanus this month just north of Delta (left) and Epsilon Eridani, a pair of +3.5 magnitude stars. This map shows stars to magnitude +9.5 with Hebe’s position marked every 5 nights. Click to enlarge. Source: Chris Marriott’s SkyMap software

At 120 miles (190 km) across, Hebe is one of the bigger asteroids (officially 33rd in size in the main belt) and orbits the Sun once every 3.8 years. It will be our guest this final month of the year shining at magnitude +8.2 in early December, +8.5 by mid-month and +8.9 when you don your party hat on New Year’s Eve. All the while, Hebe will loop across the barrens of Eridanus west of Orion. Use the maps here to help track it down. I’ve included a detailed color map above, but also created a “black stars on white” version for those that find reverse charts easier to use.

Use this wide view of the sky to get oriented before honing in with the more detailed map above. Source: Stellarium
Use this wide view of the sky to get oriented before zeroing in with the more detailed map above. Hebe lies just a few degrees north of Delta and Epsilon Eridani for much of December. Best viewing time is from 10 p.m. to 2 a.m. local time early in the month. Source: Stellarium

In more recent times, Hebe’s story takes an interesting turn. Through a study of its gravitational nudges on other asteroids, astronomers discovered that Hebe is a very compact, rocky object, not a loosey-goosey pile of rubble like some asteroids. Its high density provides strong evidence for a composition of both rock and iron. Scientists can determine the approximate composition of  an asteroid’s surface by studying its reflectance spectrum, or what colors or wavelengths are reflected back from the object after a portion is absorbed by its surface. They use infrared light because different minerals absorb different wavelengths of infrared light. That data is compared to infrared absorptions from rocks and meteorites found on Earth. Turns out, our friend Hebe’s spectrum is a good match to two classes of meteorites – the H-chondrites, which comprise 40% of known meteorites – and the rarer IIE silicated iron meteorites.

Did this slice of meteorite come from Hebe? I'm holding a small slice of NWA 2710, an H5 chondrite. Credit: Bob King
Did this slice of meteorite come from Hebe? A 12.9-gram specimen of NWA 2710, an H5 stony chondrite, sparkles in the light. The shiny flecks are iron-nickel metal set in a stony matrix. Credit: Bob King

Because Hebe orbits close to an unstable zone in the asteroid belt,  any impacts it suffers are soon perturbed by Jupiter’s gravity and launched into trajectories than can include the Earth.  When you spot Hebe in your binoculars the next clear night, you might just be seeing where many of the more common space rocks in our collections originated.

Did a Galactic Smashup Kick Out a Supermassive Black Hole?

Near-infrared image of the dwarf galaxy Markarian 177 and what appears to be an ejected SMBH. Credit: W. M. Keck Observatory/M. Koss (ETH Zurich) et al.

Crazy things can happen when galaxies collide, as they sometimes do. Although individual stars rarely impact each other, the gravitational interactions between galaxies can pull enormous amounts of gas and dust into long streamers, spark the formation of new stars, and even kick objects out into intergalactic space altogether. This is what very well may have happened to SDSS1133, a suspected supermassive black hole found thousands of light-years away from its original home.

The two Keck 10-meter domes atop Mauna Kea. (Rick Peterson/WMKO)

Seen above in a near-infrared image acquired with the Keck II telescope in Hawaii, SDSS1133 is the 40-light-year-wide bright source observed 2,300 light-years out from the dwarf galaxy Markarian 177, located 90 million light-years away in the constellation Ursa Major (or, to use the more familiar asterism, inside the bowl of the Big Dipper.)

The two bright spots at the disturbed core of Markarian 177 are thought to indicate recent star formation, which could have occurred in the wake of a previous collision.

“We suspect we’re seeing the aftermath of a merger of two small galaxies and their central black holes,” said Laura Blecha, an Einstein Fellow in the University of Maryland’s Department of Astronomy and a co-author of an international study of SDSS1133. “Astronomers searching for recoiling black holes have been unable to confirm a detection, so finding even one of these sources would be a major discovery.”

Interactions between supermassive black holes during a galactic collision would also result in gravitational waves, elusive phenomena predicted by Einstein that are high on astronomers’ most-wanted list of confirmed detections.

Read more: “Spotter’s Guide” to Detecting Black Hole Collisions

Watch an animation of how the suspected collision and subsequent eviction may have happened:

But besides how it got to where it is, the true nature of SDSS1133 is a mystery as well.

The persistently bright near-infrared source has been detected in observations going back at least 60 years. Whether or not SDSS1133 is indeed a supermassive black hole has yet to be determined, but if it isn’t then it’s a very unusual type of extremely massive star known as an LBV, or Luminous Blue Variable. If that is the case though, it’s peculiar even for an LBV; SDSS1133 would have had to have been continuously pouring out energy in a for over half a century until it exploded as a supernova in 2001.

To help determine exactly what SDSS1133 is, continued observations with Hubble’s Cosmic Origins Spectrograph instrument are planned for Oct. 2015.

“We found in the Pan-STARRS1 imaging that SDSS1133 has been getting significantly brighter at visible wavelengths over the last six months and that bolstered the black hole interpretation and our case to study SDSS1133 now with HST,” said Yanxia Li, a UH Manoa graduate student involved in the research.

And, based on data from NASA’s Swift mission the UV emission of SDSS1133 hasn’t changed in ten years, “not something typically seen in a young supernova remnant” according to Michael Koss, who led the study and is now an astronomer at ETH Zurich.

Regardless of what SDSS1133 turns out to be, the idea of such a massive and energetic object soaring through intergalactic space is intriguing, to say the least.

The study will be published in the Nov. 21 edition of Monthly Notices of the Royal Astronomical Society.

Source: Keck Observatory

ALMA Shows Off Baby Pictures… Baby Planets, That Is!

This is the sharpest image ever taken by ALMA — sharper than is routinely achieved in visible light with the NASA/ESA Hubble Space Telescope. It shows the protoplanetary disc surrounding the young star HL Tauri. These new ALMA observations reveal substructures within the disc that have never been seen before and even show the possible positions of planets forming in the dark patches within the system. Credit: ALMA (ESO/NAOJ/NRAO)

In a test of its new high resolution capabilities, the Atacama Large Millimeter/submillimeter Array (ALMA) is happily sharing some family snapshots with us. Astronomers manning the cameras have captured one of the best images so far of a newly-forming planet system gathering itself around a recently ignited star. Located about 450 light years from us in the constellation of Taurus, young HL Tau gathers material around it to hatch its planets and fascinate researchers.

Thanks to ALMA images, scientists have been able to witness stages of planetary formation which have been suspected, but never visually confirmed. This very young star is surrounded by several concentric rings of material which have neatly defined spacings. Is it possible these clearly marked gaps in the solar rubble disc could be where planets have started to gel?

“These features are almost certainly the result of young planet-like bodies that are being formed in the disk. This is surprising since HL Tau is no more than a million years old and such young stars are not expected to have large planetary bodies capable of producing the structures we see in this image,” said ALMA Deputy Director Stuartt Corder.

“When we first saw this image we were astounded at the spectacular level of detail. HL Tauri is no more than a million years old, yet already its disc appears to be full of forming planets. This one image alone will revolutionize theories of planet formation,” explained Catherine Vlahakis, ALMA Deputy Program Scientist and Lead Program Scientist for the ALMA Long Baseline Campaign.

Let’s take a look at what we understand about solar system formation…

Through repeated research, astronomers suspect that all stars are created when clouds of dust and gas succumb to gravity and collapse on themselves. As the star begins to evolve, the dust binds together – turning into “solar system soup” consisting of an array of different sized sand and rocks. This rubble eventually congeals into a thin disc surrounding the parent star and becomes home to newly formed asteroids, comets, and planets. As the planets collect material into themselves, their gravity re-shapes to structure of the disc which formed them. Like dragging a lawn sweeper over fallen leaves, these planets clear a path in their orbit and form gaps. Eventually their progress pulls the gas and dust into an even tighter and more clearly defined structure. Now ALMA has shown us what was once only a computer model. Everything we thought we knew about planetary formation is true and ALMA has proven it.

This is the sharpest image ever taken by ALMA — sharper than is routinely achieved in visible light with the NASA/ESA Hubble Space Telescope. It shows the protoplanetary disc surrounding the young star HL Tauri. The observations reveal substructures within the disc that have never been seen before and even show the possible positions of planets forming in the dark patches within the system. In this picture the features seen in the HL Tauri system are labelled.  Credit: ALMA (ESO/NAOJ/NRAO)
This is the sharpest image ever taken by ALMA — sharper than is routinely achieved in visible light with the NASA/ESA Hubble Space Telescope. It shows the protoplanetary disc surrounding the young star HL Tauri. The observations reveal substructures within the disc that have never been seen before and even show the possible positions of planets forming in the dark patches within the system. In this picture the features seen in the HL Tauri system are labelled. Credit: ALMA (ESO/NAOJ/NRAO)

“This new and unexpected result provides an incredible view of the process of planet formation. Such clarity is essential to understand how our own solar system came to be and how planets form throughout the universe,” said Tony Beasley, director of the National Radio Astronomy Observatory (NRAO) in Charlottesville, Virginia, which manages ALMA operations for astronomers in North America.

“Most of what we know about planet formation today is based on theory. Images with this level of detail have up to now been relegated to computer simulations or artist’s impressions. This high resolution image of HL Tauri demonstrates what ALMA can achieve when it operates in its largest configuration and starts a new era in our exploration of the formation of stars and planets,” says Tim de Zeeuw, Director General of ESO.

The major reason astronomers have never seen this type of structure before is easy to envision. The very dust which creates the planetary disc around HL Tau also conceals it to visible light. Thanks to ALMA’s ability to “see” at much longer wavelengths, it can image what’s going on at the very heart of the cloud. “This is truly one of the most remarkable images ever seen at these wavelengths. The level of detail is so exquisite that it’s even more impressive than many optical images. The fact that we can see planets being born will help us understand not only how planets form around other stars but also the origin of our own solar system,” said NRAO astronomer Crystal Brogan.

How does ALMA do it? According to the research staff, its new high-resolution capabilities were achieved by spacing the antennas up to 15 kilometers apart. This baseline at millimeter wavelengths enabled a resolution of 35 milliarcseconds, which is equivalent to a penny as seen from more than 110 kilometers away. “Such a resolution can only be achieved with the long baseline capabilities of ALMA and provides astronomers with new information that is impossible to collect with any other facility, including the best optical observatories,” noted ALMA Director Pierre Cox.

This is a composite image of the young star HL Tauri and its surroundings using data from ALMA (enlarged in box at upper right) and the NASA/ESA Hubble Space Telescope (rest of the picture). This is the first ALMA image where the image sharpness exceeds that normally attained with Hubble.  Credit: ALMA (ESO/NAOJ/NRAO)
This is a composite image of the young star HL Tauri and its surroundings using data from ALMA (enlarged in box at upper right) and the NASA/ESA Hubble Space Telescope (rest of the picture). This is the first ALMA image where the image sharpness exceeds that normally attained with Hubble. Credit: ALMA (ESO/NAOJ/NRAO)

The long baselines spell success for the ALMA observations and are a tribute to all the technology and engineering that went into its construction. Future observations at ALMA’s longest possible baseline of 16 kilometers will mean even more detailed images – and an opportunity to further expand our knowledge of the Cosmos and its workings. “This observation illustrates the dramatic and important results that come from NSF supporting world-class instrumentation such as ALMA,” said Fleming Crim, the National Science Foundation assistant director for Mathematical and Physical Sciences. “ALMA is delivering on its enormous potential for revealing the distant universe and is playing a unique and transformational role in astronomy.”

Pass them baby pictures our way, Mama ALMA… We’re delighted to take a look!

Original Story Source: “Revolutionary ALMA Image Reveals Planetary Genesis” – ESO Press Release

Hubble Finds 3 (Relatively) Dry Exoplanets, Raising Questions About Water Outside The Solar System

Artist's conception of gas giant planet HD 209458b in the constellation Pegasus, which has less water vapor in its atmosphere than expected. Credit: NASA, ESA, G. Bacon (STScI) and N. Madhusudhan (UC)

Surprise! Three planets believed to be good candidates for having water vapor in their atmosphere actually have much lower quantities than expected.

The planets (HD 189733b, HD 209458b, and WASP-12b) are “hot Jupiters” that are orbiting very close to their parent star, at a distance where it was expected the extreme temperatures would turn water into a vapor that could be seen from afar.

But observations of the planets with the Hubble Space Telescope, who have temperatures between 816 and 2,204 degrees Celsius (1,500 and 4,000 degrees Fahrenheit), show only a tenth to a thousandth of the water astronomers expected.

“Our water measurement in one of the planets, HD 209458b, is the highest-precision measurement of any chemical compound in a planet outside our solar system, and we can now say with much greater certainty than ever before that we’ve found water in an exoplanet,” stated Nikku Madhusudhan, an astrophysicist at the University of Cambridge, England who led the research. “However, the low water abundance we have found so far is quite astonishing.”

This finding, if confirmed by other observations, could force exoplanet formation theory to be revised and could even have implications for how much water is available in so-called “super-Earths”, rocky planets that are somewhat larger than our own, the astronomers said.

Kepler-62f, an exoplanet that is about 40% larger than Earth. It's located about 1,200 light-years from our solar system in the constellation Lyra. Credit: NASA/Ames/JPL-Caltech
Kepler-62f, an exoplanet that is about 40% larger than Earth. It’s located about 1,200 light-years from our solar system in the constellation Lyra. Credit: NASA/Ames/JPL-Caltech

That theory states that planets form over time as small dust particles stick to each other and grow into larger bodies. As it becomes a planet and takes on an atmosphere from surrounding gas bits, it’s believed that those elements should be “enhanced” in proportion to its star, especially in the case of oxygen. That oxygen in turn should be filled with water.

“We should be prepared for much lower water abundances than predicted when looking at super-Earths (rocky planets that are several times the mass of Earth),” Madhusudhan stated.

The research will be published today (July 24) in the Astrophysical Journal.

Source: NASA

Feel The Heat! New Mars Map Shows Differences Between Bedrock And Sand

An impact crater on Mars called Graterri, which is only 4.3 miles (6.9 km) in diameter, shines in a global heat map of the Red Planet produced in 2014. Credit: NASA/JPL-Caltech/Arizona State University

For years, NASA’s Mars Odyssey has been working on some night moves. It’s been taking pictures of the Red Planet during nighttime — more than 20,000 in all — to see how the planet’s heat signature looks while the sun is down.

The result is the highest-resolution map ever of the thermal properties of Mars, which you can see here. Why is this important? Researchers say it helps tell the story about things such as if an area is shrouded with dust, where bare bedrock is, and whether sediments in a crater are packed tight or floating freely.

“Darker areas in the map are cooler at night, have a lower thermal inertia and likely contain fine particles, such as dust, silt or fine sand,” stated Robin Fergason at the USGS Astrogeology Science Center in Arizona, who led the map’s creation. Brighter areas are warmer, likely yielding regions of bedrock, crust or coarse sand.

The map from Odyssey’s Thermal Emission Imaging System (THEMIS) is also used for a more practical purpose: deciding where to set down NASA’s next Mars mission.

After assisting in landing site selection for the Curiosity mission, the THEMIS data will be used to figure out where the Mars 2020 rover will be placed, Arizona State University stated.

You can check out more recent THEMIS images (updated daily) on this website.

Source: Arizona State University