
The National Oceanic and Atmospheric Administration posted satellite images online that showed the extent of the power blackout that affected more than 50 million people late last week. The photos show the areas both before and after the lights went out and demonstrate the dramatic change in power. The images were acquired by the agency’s Defense Meteorological Satellite Program (DMSP) on August 14 at 9:03 pm EDT.
Three Gorges Dam Seen From Above
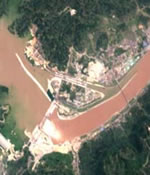
Image credit: ESA
China’s Three Gorges Dam was recently photographed from above by the European Space Agency’s CHRIS instrument on the Proba satellite. Since the sluice gates were closed in June, the water levels have risen 135 metres, and the dam will begin generating its first commercial electricity in August. More than 600,000 people were forced to abandon their homes, and the same number again will have to leave before the waters reach their planned 175 metre depth.
Water churns through diversion holes in the world?s largest dam – China?s Three Gorges project on the Yangtze River, imaged here by ESA?s Proba satellite this week. Seen to the left, the waters behind the dam have risen to a level of 135 metres since the sluice gates were first closed in early June, and in August Three Gorges is due to generate its first commercial hydroelectricity.
The Three Gorges project is set to create a new 600-km-long body of water on the face of the 21st century Earth: the thick concrete dam walls stand 190 metres tall and already they hold back an estimated 10 billion cubic metres of water. More than 600,000 people have had to abandon their homes to the rising reservoir, and as many again will have to relocate before the waters reach their final planned level of 175 metres.
Water flows through dam diversion holes
It can be clearly seen in the image how the river has burst its banks and is inundating the land upriver of the dam. The waters of the world?s third-longest river appear brown in colour because they are heavy with sediment.
Many environmentalists have campaigned against the ?20 billion-plus Three Gorges project due to the drowning of multiple cultural heritage sites, the fear that reservoir will collect industrial pollution and sewage that cannot now be washed to the sea, and the risk posed to downstream populations if the dam should ever break. But the Chinese government says the project will tame the flood-prone Yangtze River and generate much-needed electricity for economic development.
This 18-metre resolution image was acquired by the CHRIS sensor onboard Proba on 30 July 2003.
About Proba
Proba (Project for On Board Autonomy) is a micro-satellite the size of a small box, launched by ESA in October 2001 and operated from ESA’s Redu Ground Station (Belgium). Orbiting 600 km above the Earth?s surface, Proba was designed to be a one-year technology demonstration mission but has since had its lifetime extended as an Earth Observation mission. It now routinely provides scientists with detailed environmental images thanks to CHRIS – a Compact High Resolution Imaging Spectrometer developed by UK-based Sira Electro-Optics Ltd – the main payload on the 100 kg spacecraft.
Proba boasts an ?intelligent? payload, has the ability to observe the same spot on Earth from a number of different angles and can record images of an 18.6 km square area to a resolution of 18 m. More than 60 scientific teams across Europe are making use of Proba data. A follow-on mission, Proba-2, is due to be deployed by ESA around 2005.
Original Source: ESA News Release
Satellite Confirms Ozone Recovery
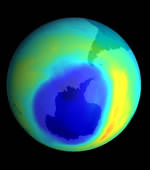
Image credit: NASA
Observations from three NASA satellites have confirmed that the rate of ozone depletion in the Earth’s upper atmosphere is decreasing. The observations were made by SAGE I, SAGE II, and HALOE satellites which scanned the upper stratosphere since 1997. Their observations are consistent with the decline of man-made chemicals in the atmosphere which contribute to ozone depletion. The ozone layer protects the Earth’s surface from sun’s harmful ultraviolet radiation.
NASA satellite observations have provided the first evidence the rate of ozone depletion in the Earth’s upper atmosphere is decreasing. This may indicate the first stage of ozone layer recovery.
From an analysis of ozone observations from NASA’s first and second Stratospheric Aerosol and Gas Experiment (SAGE) and the Halogen Occultation Experiment (HALOE) satellite instruments, scientists have found less ozone depletion in the upper stratosphere (22-28 miles altitude) after 1997. The American Geophysical Union Journal of Geophysical Research has accepted a paper for publication on these results.
This decrease in the rate of ozone depletion is consistent with the decline in the atmospheric abundance of man-made chorine and bromine-containing chemicals that have been documented by satellite, balloon, aircraft and ground based measurements.
Concerns about ozone depletion in the upper atmosphere or stratosphere led to ratification of the Montreal Protocol on Substances that Deplete the Ozone Layer by the international community in 1987. The protocol restricts the manufacture and use of human-made, ozone-depleting compounds, such as chlorofluorocarbons and halons.
“Ozone is still decreasing but just not as fast,” said Mike Newchurch, associate professor at the University of Alabama, Huntsville, Ala., and lead scientist on the study. “We are still decades away from total ozone recovery. There are a number of remaining uncertainties such as the effect of climate change on ozone recovery. Hence, there is a need to continue this precise long-term ozone data record,” he said.
“This finding would have been impossible had either SAGE II or HALOE not lasted so long past their normal mission lifetime,” said Joe Zawodny, scientist on the SAGE II satellite instrument science team at NASA’s Langley Research Center, Hampton, Va.
SAGE II is approaching the 19th anniversary of its launch, and HALOE has been returning data for 11 years. Scientists also used international ground networks to confirm these data from satellite results.
SAGE I was launched on the Applications Explorer Mission-B spacecraft in 1979; the Earth Radiation Budget Satellite carried SAGE II into orbit in 1984. The Space Shuttle Discovery carried HALOE into space on the Upper Atmosphere Research Satellite in 1991.
NASA’s Earth Science Enterprise funded this research in an effort to better understand and protect our home planet. The ozone layer protects the Earth’s surface from the sun’s harmful ultraviolet rays. Ultraviolet radiation can contribute to skin cancer and cataracts in humans and harm other animals and plants. Ozone depletion in the stratosphere also causes the ozone hole that occurs each spring over Antarctica.
Original Source: NASA News Release
New Satellite Image of the Aral Sea
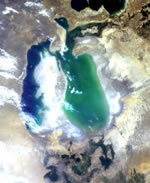
Image credit: ESA
A new image taken by the European Space Agency’s Envisat satellite shows how much the Aral Sea has evaporated. Located in Central Asia, the Aral Sea used to be the fourth largest lake in the world, but rivers that feed the lake were diverted for cotton agriculture. It’s now half its former surface area and one-quarter its original volume and continuing to shrink. The picture was taken using the Medium Resolution Imaging Spectrometer (MERIS) instrument which has a resolution of 300 metres.
Earth?s youngest desert is shown in this July MERIS satellite image of the Aral Sea in Central Asia. Once the fourth largest lake in the world, over the last 40 years the Aral Sea has evaporated back to half its original surface area and a quarter its initial volume, leaving a 40,000 square kilometre zone of dry white-coloured salt terrain now called the Aralkum Desert.
As its water level has dropped 13 metres since the 1960s the Sea has actually split into two ? the larger horseshoe-shaped body of water and a smaller almost unconnected lake a little to its north. This Small Aral Sea is the focus of international preservation efforts, but the Large Aral Sea has been judged beyond saving (the shallowness of its eastern section is clear in the image). It is expected to dry out completely by 2020.
Towards the bottom right can be seen the sands of the Qyzylqum Desert. Already stretching across an area greater than Italy, this desert is set to extend further west in future, eventually merging with its younger Aralkum sibling. The distinctive darker area to the south of the Large Aral Sea is the delta of the Amu Darya river. Its waters support environmentally-unique tugai forests found only in Central Asia, along with land used for rice and cotton cultivation.
The grey area seen in the otherwise whitish zone between the two arms of the Large Aral Sea was once Vozrozhdeniye (‘Rebirth’) Island, the isolated site of biological warfare experimentation during the Cold War, now joined to the mainland and freely accessible by foot. In reaction to this development, a US-led international team last year moved in to destroy remaining anthrax stocks.
Located on the border between Uzbekistan and Kazakhstan, the Aral Sea shows what happens when the concept of sustainable development is disregarded. Starting in the 1960s, the waters of the two rivers feeding the Sea ? the Amu Darya, seen south, and the Syr Darya to the northwest ? were diverted by Soviet planners to irrigate thirsty cotton fields across the region. By the 1980s there was little water reaching the lake and it began to shrink.
For local people the results have been disastrous. The Aral Sea’s retreating shoreline has left ports landlocked and boats stranded on dry sand. Commercial fishing was forced to halt twenty years ago. The few remaining fishermen commute by car to the water’s edge. The waters that remain grow increasingly saline so only salt-resistant fish imported from elsewhere can endure them. Wildlife habitats have been destroyed and communities find themselves without clean water supplies.
The retreat of the waters has also altered the regional microclimate. Winters are colder and the summers hotter. Each year violent sandstorms pick up at least 150,000 tonnes of salt and sand from the dried-up lakebed and transport it across hundreds of kilometres.
The sandstorms are tainted with pesticide residue and have been linked to high regional rates of respiratory illnesses and certain types of cancer. The salty dust does harm to livestock pastures and has even been linked with melting glaciers up in the distant Pamir Mountains, on the Afghanistan border.
Back in the days of the USSR, planners spoke casually of diverting Siberian rivers to save the Aral Sea. Today that certainly will not happen. Instead Central Asian governments have come together to establish the International Fund for Saving the Aral Sea. But their economies are too dependent on cotton exports to end all irrigation.
The Small Aral Sea is still thought to be saveable, and several dikes have been constructed to cut it off from the Large Aral Sea ? preventing water loss and salt contamination – but shifting water levels have so far defeated these efforts. The channel connecting the two should soon dry up anyway, preserving the Small Aral Sea at least. Meanwhile researchers are studying the salty Aralkum Desert ? effectively the newest land surface on Earth ? to see how best to promote plant growth and stabilise the dusty dry lakebed.
Original Source: ESA News Release
Gravity Map Released
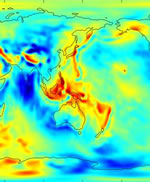
Image credit: NASA
The Gravity Recovery and Climate Experiment (Grace) mission has created the most accurate map of the Earth’s gravity field. The joint NASA-German Aerospace Center mission consists of two spacecraft connected by a cable which is able to measure fluctuations in the Earth’s gravity to a precision of a few centimetres. They found that the gravity field can fluctuate by as much as 200 metres around the world. This gravity map will give future water level measurements better accuracy, and help scientists better understand the slow redistribution of mass on the planet.
The joint NASA-German Aerospace Center Gravity Recovery and Climate Experiment (Grace) mission has released its first science product, the most accurate map yet of Earth’s gravity field. Grace is the newest tool for scientists working to unlock secrets of ocean circulation and its effects on climate.
Created from 111 days of selected Grace data, to help calibrate and validate the mission’s instruments, this preliminary model improves knowledge of the gravity field so much it is being released to oceanographers now, months in advance of the scheduled start of routine Grace science operations. The data are expected to significantly improve our ability to understand ocean circulation, which strongly influences weather and climate.
Dr. Byron Tapley, Grace principal investigator at UT’s Center for Space Research, called the new model a feast for oceanographers. “This initial model represents a major advancement in our knowledge of Earth’s gravity field. “Pre- Grace models contained such large errors many important features were obscured. Grace brings the true state of the oceans into much sharper focus, so we can better see ocean phenomena that have a strong impact on atmospheric weather patterns, fisheries and global climate change.”
Grace is accomplishing that goal by providing a more precise definition of Earth’s geoid, an imaginary surface defined only by Earth’s gravity field, upon which Earth’s ocean surfaces would lie if not disturbed by other forces such as ocean currents, winds and tides. The geoid height varies around the world by up to 200 meters (650 feet).
“I like to think of the geoid as science’s equivalent of a carpenter’s level, it tells us where horizontal is,” Tapley said. “Grace will tell us the geoid with centimeter-level precision.”
So why is knowing the geoid height so important? JPL’s Dr. Lee-Lueng Fu, scientist on Topex/Poseidon and Jason project said, “The ocean’s surface, while appearing flat, is actually covered with hills and valleys caused by currents, winds and tides, and also by variations in Earth’s gravity field. “Scientists want to separate out these gravitational effects, so they can improve the accuracy of satellite altimeters like Jason and Topex/Poseidon, which measure sea surface height, ocean heat storage and global ocean circulation. This will give us a better understanding of ocean circulation and how it affects climate.”
Dr. Michael Watkins, Grace project scientist at JPL, put improvements to Earth’s gravity model into perspective. “Scientists have studied Earth’s gravity for more than 30 years, using both satellite and ground measurements that were of uneven quality. “Using just a few months of our globally uniform quality Grace data, we’ve already improved the accuracy of Earth’s gravity model by a factor of between 10 and nearly 100, depending on the size of the gravity feature. In some locations, errors in geoid height based upon previous data were as much as 1 meter (3.3 feet). Now, we can reduce these errors to a centimeter (0.4 inches) in some instances. That’s progress.”
Dr. Christoph Reigber, Grace co-principal investigator at GeoForschungsZentrum Potsdam, said, “As we continue to assess and refine Grace’s instruments and subsystems, we’re confident future monthly gravity solutions will be even better than the map we’re releasing now. “Those solutions will allow us to investigate processes associated with slow redistribution of mass inside Earth and on its land, ocean and ice surfaces. Our initial attempts to identify such small gravity signals with Grace look very promising.”
Grace senses minute variations in gravitational pull from local changes in Earth’s mass by precisely measuring, to a tenth of the width of a human hair, changes in the separation of two identical spacecraft following the same orbit approximately 220 kilometers (137 miles) apart. Grace will map the variations from month to month, following changes imposed by the seasons, weather patterns and short-term climate change.
Original Source: University of Texas News Release
Mars Express Says Goodbye to the Earth and Moon
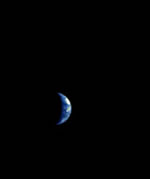
Image credit: ESA
Now well on its way to the Red Planet, the European Space Agency’s Mars Express spacecraft took a farewell image of the Earth and Moon. The photo was snapped on July 3 when the spacecraft was 8 million kilometres away from the Earth. The picture was taken as part of a series of tests the ESA is doing to make sure the Mars Express’ cameras and instruments are working properly. Once it reaches Mars in late December, the spacecraft will be able to resolve objects on the surface of Mars as small as 2 metres.
A unique view of our home planet and its natural satellite ? the Moon – is one of the first data sets coming from ESA’s Mars Express.
?It is very good news for the mission,? says ESA’s Mars Express Project Scientist, Agustin Chicarro. These and other data, such as those recording the major constituents of Earth as seen from space, are the actual proof that the instruments on board Mars Express, launched 2 June 2003, are working perfectly.
The routine check-outs of Mars Express’s instruments and of the Beagle-2 lander, performed during the last weeks, have been very successful. “As in all space missions little problems have arisen, but they have been carefully evaluated and solved. Mars Express continues on its way to Mars performing beautifully”, comments Chicarro.
The views of the Earth/Moon system were taken on 3 July 2003 by Mars Express’s High Resolution Stereo Camera (HRSC), when the spacecraft was 8 million kilometres from Earth. The image taken shows true colours; the Pacific Ocean appears in blue, and the clouds near the Equator and in mid to northern latitudes in white to light grey. The image was processed by the Instrument Team at the Institute of Planetary Research of DLR, Berlin (Germany). It was built by combining a super resolution black and white HRSC snap-shot image of the Earth and the Moon with colour information obtained by the blue, green, and red sensors of the instrument.
?The pictures and the information provided by the data prove the camera is working very well. They provide a good indication of what to expect once the spacecraft is in its orbit around Mars, at altitudes of only 250-300 kilometres: very high resolution images with brilliant true colour and in 3D,? says the Principal Investigator of the HRSC, Gerhard Neukum, of the Freie Universit?t of Berlin (Germany). This camera will be able to distinguish details of up to 2 metres on the Martian surface.
Another striking demonstration of Mars Express’s instruments high performance are the data taken by the OMEGA spectrometer. Once at Mars, this instrument will provide the best map of the molecular and mineralogical composition of the whole planet, with 5% of the planetary surface in high resolution. Minerals and other compounds such as water will be charted as never before. As the Red Planet is still too far away, the OMEGA team devised an ingenious test for their instrument: to detect the Earth?s surface components.
As expected, OMEGA made a direct and unambiguous detection of major and minor constituents of the Earth?s atmosphere, such as molecular oxygen, water and carbon dioxide, ozone and methane, among other molecules. “The sensitivity demonstrated by OMEGA on these Earth spectra should reveal really minute amounts of water in both Martian surface materials and atmosphere,” says the Principal Investigator of OMEGA, Jean Pierre Bibring , from the Institut d’Astrophysique Spatiale, Orsay, France.
The experts will carry on testing Mars Express?s instruments up till the arrival to the Red Planet, next December. The scientists agree on the fact that these instruments will enormously increase our understanding of the morphology and topography of the Martian surface, of the geological structures and processes – active now and in the past, and eventually of Mars?s geological evolution. With such tools, Mars Express is also able to address the important ?water? question, namely how much water there is today and how much there was in the past. Ultimately, this will also tell us whether Mars had environmental conditions that could favour the evolution of life.
Original Source: ESA News Release
Earth Could Have Formed Quickly
Our Earth might have formed a lot earlier that astronomers previously believed, maybe as quickly as 10 million years after the birth of the Sun. In fact, all of the inner planets might have started forming as soon as 10,000 years after the Sun ignited 4.5 billion years ago. Within 10 million years, the Earth had reached 64 percent of its mass, and later collided with a Mars-sized object to provide additional mass and create the Moon. Scientists originally believed that the Earth took 50 million years to form.
Earthquakes Simulation Could Lead to Quake Forecasts
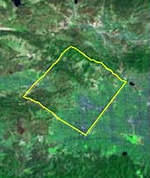
Image credit: NASA
NASA scientists are working on ways to predict earthquakes using an advanced computer simulation. The software is called QuakeSim, and it uses hundreds of thousands of measurements gathered by a variety of land and space-based instruments to calculate how the Earth’s crust deforms through plate tectonics. The technology is already starting to show results – one team has been able to identify regions in California with higher risks of earthquakes and predicted every magnitude 5+ quake since the year 2000 within 11 kilometres.
Advanced computer simulation tools now being developed by NASA and university researchers may soon give scientists new insights into the complex and mysterious physics of earthquakes and enable vastly improved earthquake forecasting.
Scientists at NASA?s Jet Propulsion Laboratory, Pasadena, Calif., together with NASA?s Goddard Space Flight Center, Greenbelt, Md.; Ames Research Center, Mountain View, Calif.; and several universities, are developing an advanced earthquake modeling system called QuakeSim. When completed in late 2004, QuakeSim?s simulation tools will help scientists learn more about what makes earthquakes happen.
The tools are based upon the latest technologies. For example, one uses finite element analysis, which solves complex computer modeling problems by breaking them into small pieces. For QuakeSim, the finite elements are tens to hundreds of thousands of measurements of how Earth?s crust deforms in response to movement of the giant tectonic plates Earth?s landmasses ride upon. The measurements are gathered through both ground and space-based techniques. The latter include global positioning system and interferometric synthetic aperture radar, which measure the ?quiet? (non-earthquake) motions associated with plate tectonics and the quake cycle.
QuakeSim Principal Investigator Dr. Andrea Donnellan of JPL calls QuakeSim a vital step toward eventual earthquake forecasting. ?The deformation of Earth?s crust and the interaction between quake faults is a complex 3-D process happening on timescales of minutes to thousands of years,? she said. ?Studying it requires sophisticated simulation models and high-performance supercomputers. The availability of space-based data and our current limited understanding of quake processes make this an ideal time to develop a system for studying deformation processes such as tectonics, quakes and volcanoes.?
?New quake models developed under QuakeSim are expected to yield future earthquake forecasts that will be used by a variety of federal and state agencies to develop decision support tools that will help mitigate losses from future large earthquakes,” Donnellan added.
QuakeSim?s three major simulation tools are Park, Virtual California and the Geophysical Finite Element Simulation Tool (Geofest).
Park simulates the evolution of a quake on a single, unstable fault over time. It is based upon current knowledge of the rate of movement (or ?slip?) and friction on a well-studied section of the San Andreas Fault in Parkfield, Calif., but is applicable to any fault or collection of faults. Park will be the tool of choice for researchers seeking to determine the nature and detectability of quake warning signals. It will determine how stress is distributed over a fault and how it is redistributed by quakes or ?quiet? seismic motion. It can also be used to compute the history of slip, slip speed and stress on a fault. Up to 1,024 computer processors will be used in parallel to demonstrate Park’s capability.
Virtual California simulates how California?s hundreds of independent fault segments interact and allows scientists to determine correlated patterns of activity that can be used to forecast seismic hazard, especially for quakes of magnitude 6 or greater. Patterns from the simulated data are compared to patterns in real data to strengthen understanding of the quake process. The approach’s potential is already being demonstrated. Under a joint NASA/Department of Energy study lead by Dr. John Rundle, director of the Center for Computational Science and Engineering at the University of California at Davis, Virtual California was used to identify regions of the state with elevated probabilities of quakes over the next decade. Since the study was completed in 2000, all of California’s five largest quakes of magnitude 5 or greater have occurred within 11 kilometers (6.8 miles) of these sites. The probability of this occurring randomly is about one in 100,000. The last three of these quakes occurred after the forecast map was published in the Proceedings of the National Academy of Sciences in February 2002.
Geofest creates 2-D and 3-D models of stress and strain in Earth?s crust and upper mantle in a complex geologic region with many interacting fault systems. It shows how the ground will deform in response to a quake, how deformation changes over time following a quake, and the net effects to the ground from a series of quakes. The entire Southern California system of interacting faults will be analyzed, covering a portion of the crust approximately 1,000 kilometers (621 miles) on a side. The simulation will require millions of equations and hundreds of computer processors.
In addition to JPL, the QuakeSim team includes the Davis and Irvine campuses of the University of California; Brown University, Providence, R.I.; Indiana University; and the University of Southern California. An independent review board provides oversight. Codes will be run on supercomputers at NASA?s Goddard, Ames and JPL facilities and other institutions. The California Institute of Technology in Pasadena manages JPL for NASA.
NASA’s Earth Science Enterprise is dedicated to understanding Earth as an integrated system and applying Earth system science to improve prediction of climate, weather and natural hazards using the unique vantage point of space. A primary goal of NASA’s solid Earth science program is assessment and mitigation of natural hazards. QuakeSim supports the Enterprise’s goal of developing predictive capabilities for quake hazards.
Original Source: NASA News Release
Photos of Mt. Etna Captured By Four Satellites
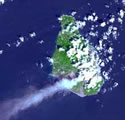
Image credit: NASA
By combining the data from four separate instruments, NASA scientists are able to study the Earth’s volcanoes in tremendous detail. Most recently, Italy’s Mt. Etna was captured mid-eruption using the instruments on board the Terra and Aqua spacecraft, and the data will help the scientists understand the complex behaviour of volcanic plumes and the effects the eruptions have on the environment.
Think of them as the Good Witches of the North, South, East and West, whizzing around the globe daily on their techno “broomsticks” in space. When Europe’s largest, most active volcano, Italy’s Mount Etna, cackled to life and spewed ash and noxious sulfur dioxide gases last October, a quartet of remote sensing instruments from NASA’s Earth Observing System armada flew into action to analyze the smoky, caustic potion.
NASA’s atmospheric science and volcanology wizards can now study the evolution and structure of plumes from Mount Etna and Earth’s 500 or so other active volcanoes in greater detail than ever before. They do this by combining data from the Multi-angle Imaging SpectroRadiometer (Misr), Moderate Resolution Imaging SpectroRadiometer (Modis) and the joint U.S./Japan Advanced Spaceborne Thermal Emission and Reflection Radiometer (Aster) sensors on NASA’s Terra spacecraft with the Atmospheric Infrared Sounder (Airs) and Modis sensors on NASA’s Aqua spacecraft.
“The synergies from NASA’s remote sensing capabilities are helping us understand the complex behavior of volcanic plumes and the effects volcanic eruptions have on the environment,” said Dr. Vince Realmuto, a member of the Earth Observing System volcanology team and supervisor of the Visualization and Scientific Animation Group at NASA’s Jet Propulsion Laboratory, Pasadena, Calif. “By combining data from Airs, Aster, Misr and Modis, we can study volcanic plumes and clouds from many dimensions at once and observe targets of interest like Mount Etna on a daily basis.”
Mount Etna’s most recent eruption, which has subsided but not ended, has released sulfur dioxide into the atmosphere at rates as high as 20,000 metric tons (44.1 million pounds) a day. A major air pollutant vented by some volcanoes, this gas rapidly converts to sulfate aerosols in Earth’s atmosphere, impacting local, regional and global environments.
“At the local and regional level, sulfate aerosols can affect air quality and visibility and cause acid fog and rain, while their small size allows them to penetrate deep into human lungs, impacting respiratory health,” Realmuto said. “To affect global climate, these aerosols have to make their way into Earth’s upper atmosphere, or stratosphere.
“The eruptions of the Philippines’ Mount Pinatubo in 1991 and Mexico’s El Chichon in 1982 deposited aerosols in the stratosphere and had measurable effects on global climate,” Realmuto continued. “These volcanic aerosol layers can reflect incoming solar radiation, resulting in less radiation reaching the ground and throwing off the radiation balance between the Earth, atmosphere and sun. They can trap greenhouse gasses, such as carbon dioxide and water vapor, rising through the atmosphere. They can also lead to the formation of polar stratospheric clouds, a component of the process that destroys Earth’s protective ozone layer.”
Airs, Aster and Modis all collect measurements in the thermal infrared spectrum. Sulfur dioxide, sulfate aerosols and volcanic ash are all easily detectable in this spectral region.
The high spatial resolution of Aster makes it the only orbiting instrument that can detect the non-explosive venting of sulfur dioxide from small volcanic vents. Aster’s visible and near infrared channels can also be used to determine some properties of aerosols and ash. Aster was built by Japan’s Ministry of Economy, Trade and Industry and has a joint U.S./Japan science team.
Airs’ high spectral resolution will allow scientists to identify the components that make up volcanic plumes and estimate the quantity of these components with greater accuracy. In addition, Airs’ atmospheric temperature and relative humidity data will help scientists develop thermal infrared models that can be used to determine ash and aerosol makeup.
Modis’ spatial resolution falls in between that of Aster and Airs. Thus, Modis data are a bridge between the more localized Aster measurements and the more regional Airs data. Since Aster observations of particular targets must be scheduled in advance, Modis often provides the highest spatial resolution thermal infrared data for a given eruption. Both Modis and Airs transmit data in real time-a key to monitoring volcanoes from space.
Misr’s multi-angle imaging allows scientists to identify thin clouds of airborne volcanic ash and aerosol plumes and estimate the abundance and size of the particles. For thicker plumes, Misr can determine the height of the aerosol plume and the speed at which winds are moving the plume through the atmosphere. Knowing the plume height above the ground is important to thermal infrared modeling because it determines the temperature contrast between clouds and their backgrounds. Wind speed data are essential to accurately estimate the rate at which the material is horizontally dispersed into the atmosphere.
Original Source: NASA News Release
New Mission to Study the Earth’s Clouds
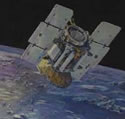
Image credit: NASA
CloudSat, a new satellite mission planned to launch in 2004, will use an advanced radar to study the properties of clouds. It will measure every aspect of the Earth’s clouds, including thickness, height, water and ice content. Using its cloud-penetrating radar, it should be able to increase the accuracy of severe storm, hurricane and flood warnings. It will also fly in orbital formation with several other weather satellites to help form a more complete picture of the Earth’s weather.
“I’ve looked at clouds from both sides now, from up and down and still somehow
It’s clouds’ illusions I recall. I really don’t know clouds at all…”
So laments Joni Mitchell’s classic song “Both Sides Now,” appropriate words as NASA prepares for a mission that should remove much of the mystery from those “rows and flows of angel hair” that so affect Earth’s weather and climate, yet are so misunderstood.
CloudSat, the most advanced radar designed to measure the properties of clouds, will provide the first global measurements of cloud thickness, height, water and ice content, and a wide range of precipitation data linked to cloud development. The Earth System Science Pathfinder Mission is expected to improve weather forecasting and advance our understanding of key climate processes during its two-year design lifetime. CloudSat is planned for launch in 2004 aboard a Boeing Delta rocket from Vandenberg Air Force Base, Calif. NASA’s Jet Propulsion Laboratory, Pasadena, Calif., manages the mission for NASA’s Earth Explorers Program Office at the Goddard Space Flight Center, Greenbelt, Md.
“Despite the fundamental role of clouds in climate and weather, there is much we do not know about them,” said CloudSat Principal Investigator Dr. Graeme Stephens of Colorado State University’s Department of Atmospheric Science, Fort Collins, Colo. “The lack of understanding of cloud feedback is widely acknowledged in the scientific community to be a major obstacle confronting credible prediction of climate change. CloudSat aims to provide observations necessary to greatly advance understanding of climate issues.”
Stephens and Co-Principal Investigator Dr. Deborah Vane of JPL discuss the necessity of CloudSat’s measurements in the current Bulletin of the American Meteorological Society. “The vertical profiles of global cloud properties provided by CloudSat will fill a critical gap in the understanding of how clouds affect climate, uncovering new knowledge about clouds and precipitation, and the connection of clouds to the large-scale motions of Earth’s atmosphere,” Vane said.
CloudSat will help researchers in numerous disciplines. It will provide better understanding of climate processes by supporting new, detailed investigations of how clouds determine Earth’s energy balance and how Earth responds to the incoming solar energy that fuels the climate system. It will improve weather prediction models by measuring cloud properties from the top of the atmosphere to Earth’s surface, filling in a gap in existing and planned space observational systems. CloudSat’s radar can penetrate thick cloud systems, providing information to increase the accuracy of severe storm, hurricane and flood warnings. CloudSat will improve water resource management by linking climate conditions such as El Nino to hydrological processes that affect drought, severe weather and water supply availability. The mission will also develop advanced technologies, including high-power radar sources, methods of radar signal transmission within spacecraft, and integrated geophysical retrieval algorithms.
CloudSat will fly in orbital formation with NASA’s Aqua and Aura satellites, the French Space Agency’s Parasol satellite, and the NASA-French Space Agency Calipso satellite. Its radar measurements will overlap those of the other satellites. It will be the first time five research satellites fly together. The precision of the radar overlap creates a unique multi-satellite observing system, providing unsurpassed information about the role of clouds in weather and climate.
Colorado State’s Stephens conceived CloudSat. JPL, with the Canadian Space Agency, developed the mission’s first-ever space borne millimeter wavelength profiling radar, which measures the altitude and physical properties of clouds. Ball Aerospace, Boulder, Colo., is building the spacecraft. The U.S. Air Force will operate CloudSat on-orbit and deliver raw data to the Cooperative Institute for Research in the Atmosphere at Colorado State, which will process the data for the scientific community, civilian and military weather forecast agencies. The U.S. Department of Energy and an international team of scientists will provide independent verification of the radar performance through its Atmospheric Radiation Measurement Program.
NASA’s Earth Science Enterprise is dedicated to understanding the Earth as an integrated system and applying Earth system science to improve prediction of climate, weather, and natural hazards using the vantage point of space. This mandate is part of NASA’s overall mission to understand and protect our home planet. The California Institute of Technology in Pasadena manages JPL for NASA.
Original Source: NASA/JPL News Release