Strange Ozone Hole this Year

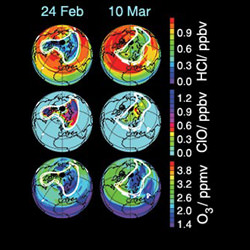
Changing ozone hole. Image credit: NASA/JPL. Click to enlarge.
Despite near-record levels of chemical ozone destruction in the Arctic this winter, observations from NASA’s Aura spacecraft showed that other atmospheric processes restored ozone amounts to near average and stopped high levels of harmful ultraviolet radiation from reaching Earth’s surface.

Analyses from Aura’s Microwave Limb Sounder indicated Arctic chemical ozone destruction this past winter peaked at near 50 percent in some regions of the stratosphere, a region of Earth’s atmosphere that begins about 8 to 12 kilometers (5 to 7 miles) above Earth’s poles. This was the second highest level ever recorded, behind the 60 percent level estimated for the 1999-2000 winter. Data from another instrument on Aura, the Ozone Monitoring Instrument, found the total amount of ozone over the Arctic this past March was similar to other recent years when much less chemical ozone destruction occurred. So what tempered the ozone loss? The answer appears to lie in this year’s unusual Arctic atmospheric conditions.

“This was one of the most unusual Arctic winters ever,” said scientist Dr. Gloria Manney of NASA’s Jet Propulsion Laboratory, Pasadena, Calif., who led the Microwave Limb Sounder analyses. “Arctic lower stratospheric temperatures were the lowest on record. But other conditions like wind patterns and air motions were less conducive to ozone loss this year.”

While the Arctic polar ozone was being chemically destroyed toward the end of winter, stratospheric winds shifted and transported ozone-rich air from Earth’s middle latitudes into the Arctic polar region, resulting in little net change in the total amount of ozone. As a result, harmful ultraviolet radiation reaching Earth’s surface remained at near-normal levels.

Imagery and an animation depicting the Microwave Limb Sounder and Ozone Monitoring Instrument 2005 Arctic ozone observations may be viewed at:

http://www.nasa.gov/vision/earth/lookingatearth/ozone-aura.html

Extensive ozone loss occurs each winter over Antarctica (the “ozone hole”) due to the extreme cold there and its strong, long-lived polar vortex (a band of winds that forms each winter at high latitudes). This vortex isolates the region from middle latitudes. In contrast, the Arctic winter is warmer and its vortex is weaker and shorter-lived. As a result, Arctic ozone loss has always been lower, more variable and much more difficult to quantify.

This was the first Arctic winter monitored by Aura, which was launched in July 2004. Aura’s Microwave Limb Sounder is contributing to our understanding of the processes that cause Arctic wind patterns to push ozone-rich air to the Arctic lower stratosphere from higher altitudes and lower latitudes. Through Aura’s findings, scientists can differentiate chemical ozone destruction from ozone level changes caused by air motions, which vary dramatically from year to year.

“Understanding Arctic ozone loss is critical to diagnosing the health of Earth’s ozone layer,” said Dr. Phil DeCola, Aura program scientist at NASA Headquarters, Washington. “Previous attempts to quantify Arctic ozone loss have suffered from a lack of data. With Aura, we now have the most comprehensive, simultaneous, global daily measurements of many of the key atmospheric gases needed to understand and quantify chemical ozone destruction.”

Ozone loss in Earth’s stratosphere is caused primarily by chemical reactions with chlorine from human-produced compounds like chlorofluorocarbons. When stratospheric temperatures drop below minus 78 degrees Celsius (minus 108 degrees Fahrenheit), polar stratospheric clouds form. Chemical reactions on the surfaces of these clouds activate chlorine, converting it into forms that destroy ozone when exposed to sunlight.

The data obtained by Aura were independently confirmed by instruments participating in NASA’s Polar Aura Validation Experiment, which flew underneath Aura as it passed over the polar vortex. The experiment, flown on NASA’s DC-8 flying laboratory from NASA’s Dryden Flight Research Center, Edwards, Calif., carried 10 instruments to measure temperatures, aerosols, ozone, nitric acid and other gases. The experiment was carried out in January and February 2005.

Aura is the third and final major Earth Observing System satellite. Aura carries four instruments: the Ozone Monitoring Instrument, built by the Netherlands and Finland in collaboration with NASA; the High Resolution Dynamics Limb Sounder, built by the United Kingdom and the United States; and the Microwave Limb Sounder and Tropospheric Emission Spectrometer, both built by JPL. Aura is managed by NASA’s Goddard Space Flight Center, Greenbelt, Md.

For more information on Aura on the Internet, visit: http://aura.gsfc.nasa.gov/

For more information on the Microwave Limb Sounder on the Internet, visit: http://mls.jpl.nasa.gov/

JPL is managed for NASA by the California Institute of Technology in Pasadena.

Original Source: NASA/JPL News Release

B-15 About to Crash Again

ESA’s Envisat image of iceberg B-15A. Image credit: ESA. Click to enlarge.
The mammoth B-15A iceberg appears poised to strike another floating Antarctic ice feature, a month on from a passing blow that broke off the end of the Drygalski ice tongue. As this Envisat image reveals, this time its target is the ice tongue of the Aviator Glacier.

First discovered in 1955, and named to mark the work done by airmen to open up the Antarctic continent, the Aviator Glacier is a major valley glacier descending from the plateau of Victoria Land along the west side of the Mountaineer Range. It enters the sea at Lady Newnes Bay, where it forms a floating ice tongue that extends into the water for about 25 kilometres.

This Envisat Advanced Synthetic Aperture Radar (ASAR) image was acquired on 16 May 2005 in Wide Swath Mode (WSM), providing spatial resolution of 150 metres across a 400-km swath. ASAR can pierce through clouds and local darkness and is capable of differentiating between different types of ice.

The sensor has been following the movements of B-15A since the beginning of the year, gathering the highest frequency weather-independent dataset of this part of the Ross Sea.

Measuring around 115 kilometres in length with an area exceeding 2500 square kilometres, the B-15A iceberg is the world’s largest free-floating object. It is the largest remaining section of the even larger B-15 iceberg that calved from the Ross Ice Shelf in March 2000 before breaking up into smaller sections.

Since then its B-15A section has drifted into McMurdo Sound, where its presence blocked ocean currents and led to a build-up of sea ice that decimated local penguin colonies, deprived of open waters for feeding. During the spring of this year prevailing currents took B-15A slowly past the Drygalski ice tongue. A full-fledged collision failed to take place, but a glancing blow broke the end off Drygalski in mid-April.

The stretch of Victoria Land coast parallel to B-15A’s current position is unusually rich in wildlife, noted for colonies of Adelie penguins as well as Weddell seals and Skuas. If B-15A were to remain in its current position for any prolonged length of time, the danger is that the iceberg could pin sea-ice behind it, blocking the easy access to open water that local animal inhabitants currently enjoy.

Twin-mode Antarctic observations
Envisat’s ASAR instrument monitors Antarctica in two different modes: Global Monitoring Mode (GMM) provides 400-kilometre swath one-kilometre resolution images, enabling rapid mosaicking of the whole of Antarctica to monitor changes in sea ice extent, ice shelves and iceberg movement.

Wide Swath Mode (WSM) possesses the same swath but with 150-metre resolution for a detailed view of areas of particular interest.

ASAR GMM images are routinely provided to a variety of users including the US National Oceanic and Atmospheric Administration (NOAA) National Ice Centre, responsible for tracking icebergs worldwide.

ASAR imagery is also being used operationally to track icebergs in the Arctic by the Northern View and ICEMON consortia, which provide ice monitoring services as part of the Global Monitoring for Environment and Security (GMES) initiative, jointly backed by ESA and the European Union.

This year also sees the launch of CryoSat, a dedicated ice-watching mission designed to precisely map changes in the thickness of polar ice sheets and floating sea ice.

CryoSat, in connection with regular Envisat ASAR GMM mosaics and SAR interferometry – a technique used to combine radar images to measure tiny centimetre-scale shifts between acquisitions – should answer the question of whether the kind of ice-shelf calving that gave rise to B-15 and its descendants are a consequence of ice sheet dynamics or other factors.

Together they will provide insight into whether such iceberg calving occurrences are becoming more common, as well as improving our understanding of the relationship between the Earth’s ice cover and the global climate.

Original Source: ESA News Release

Plankton Bloom in the Bay of Biscay

Envisat image of a plankton bloom of the coast of Spain. Image credit: ESA. Click to enlarge.
A break in the clouds in an Envisat observation of the west coast of Europe this week reveals a striking marine phytoplankton bloom currently dominating the Bay of Biscay.

Phytoplankton are microscopic marine plants that drift on or near the surface of the sea, by far the most abundant type of life found in the ocean. Just like plants on land they employ green-pigmented chlorophyll for photosynthesis – the process of turning sunlight into chemical energy.

While individually microscopic, phytoplankton chlorophyll collectively tints the surrounding ocean waters, providing a means of detecting these tiny organisms from space with dedicated ‘ocean colour’ sensors.

As if dye had been placed in the water, the greenish colour highlights whirls of ocean currents. Floating freely in the water, phytoplankton are sensitive not just to available sunlight but also to local environmental variations such as nutrient levels, temperature, currents and winds. Favourable conditions lead to concentrated ‘blooms’ like the one we see here.

Monitoring phytoplankton is important because they form the base of the marine food web ? sometimes known as ‘the grass of the sea’.

On a local level, out-of-control blooms can devastate marine life, de-oxygenating whole stretches of water, while some species of phytoplankton and marine algae are toxic to both fish and humans. It is useful that fishermen, fish farmers and public health officials know about such events as soon as possible.

Globally, phytoplankton are a major influence on the amount of carbon in the atmosphere, and hence need to be modelled into calculations of future climate change.

Phytoplankton blooms occur frequently at this time of year in the Bay of Biscay. This ‘spring bloom’ takes place as cold, nutrient-rich waters are finally exposed to sufficient sunlight to trigger rapid phytoplankton growth. The bloom is signaling a new cycle of biological production, important for the local fishing industry – the Bay of Biscay being a rich fishery.

Envisat’s Medium Resolution Imaging Spectrometer (MERIS) instrument is optimised for ocean colour detection, but also returns detailed multispectral information on land cover, clouds and atmospheric aerosols.

MERIS acquires continuous daytime observations in Reduced Resolution mode as part of its background mission. This is a detail from a MERIS Reduced Resolution image was acquired on 2 May 2005. The full version, viewable by clicking the high-resolution image, has a spatial resolution of 1200 metres and covers an area of 838 by 2277 km.

Original Source: ESA News Release

High Resolution Global Map in Development

Envisat will build up the most detailed map of the entire Earth. Image credit: ESA. Click to enlarge.
The most detailed portrait ever of the Earth’s land surface is being created with ESA’s Envisat environmental satellite. The GLOBCOVER project aims at producing a global land cover map to a resolution three times sharper than any previous satellite map.

It will be a unique depiction of the face of our planet in 2005, broken down into more than 20 separate land cover classes. The completed GLOBCOVER map will have numerous uses, including plotting worldwide land use trends, studying natural and managed ecosystems and modelling climate change extent and impacts.

Envisat’s Medium Resolution Imaging Spectrometer (MERIS) instrument is being systematically used in Full Resolution Mode for the project, acquiring images with a spatial resolution of 300 metres, with an average 150 minutes of acquisitions occurring daily.

The estimate is that up to 20 terabytes of imagery will be needed to mosaic together the final worldwide GLOBCOVER map ? an amount of data equivalent to the contents of 20 million books. The image acquisition strategy is based around regional climate patterns to minimise cloud or snow cover. Multiple acquisitions are planned for some regions to account for seasonal variations in land cover.

Other Envisat sensors will work in synergy with MERIS. The Advanced Synthetic Aperture Radar (ASAR) instrument will be used to differentiate between similar land cover classes, such as wetlands and humid tropical rainforests. And information from the satellite’s Advanced Along Track Scanning Radiometer will be used to correct for atmospheric distortion and to perform ‘cloud masking’, or the elimination of cloud pixels.

An international network of partners is working with ESA on the two-year GLOBCOVER project, which is taking place as part of the Earth Observation Data User Element (DUE).

Participants include the United Nations Environment Programme (UNEP), the Food and Agriculture Organisation (FAO), the European Commission’s Joint Research Centre (JRC), the International Geosphere-Biosphere Programme (IGBP) and the Global Observations of Forest Cover and Global Observations of Land Dynamics (GOFC-GOLD) Implementation Team Project Office.

“UNEP anticipates being able to put the GLOBCOVER map to good use within its programme of assessment and early warning of emerging environmental issues and threats, particularly those of a trans-boundary nature,” said Ron Witt of UNEP. “Changes in land cover patterns, effects of environmental pollution and loss of biodiversity often do not respect national or other artificial boundaries. “An updated view of such problems – or their effects – from interpreted space imagery should offer a large boost to UNEP’s effort to monitor the health of the planet and our changing environment.”

Located at Friedrich-Schiller University in Jena, Germany, the GOFC-GOLD Implementation Team Project Office is responsible for developing international standards and methodology for global observations, and is advising GLOBCOVER on classification issues.

The GLOBCOVER classification system is being designed to be compatible with the Global Land Cover map previously produced for the JRC for the year 2000, a one-kilometre resolution map produced from SPOT-4 Vegetation Instrument data and known as GLC 2000.

GLOBCOVER will also serve to update and improve the European Environment Agency’s CORINE 2000 database, a 300-metre resolution land cover map of the European continent based on a combination of updated land cover maps and satellite imagery.

Once worldwide MERIS Full Resolution coverage is achieved, there will actually be two GLOBCOVER maps produced. The first, GLOBCOVER V1, will be produced automatically by mosaicking images together in a standardised way.

The JRC is then utilising its GLC2000 experience to produce the more advanced GLOBCOVER V2 in the second year, taking a regionally-tuned approach to the data. Some 30 teams worldwide will participate in analysing and validating GLOBCOVER products.

Acquired in a standardised 15 bands, the MERIS images are going to be processed with an upgraded algorithm that includes an ortho-rectification fool, correcting for altitude based on a digital elevation model (DEM) derived from the Radar Altimeter-2 (RA-2), another Envisat instrument.

Original Source: ESA News Release

The Earth Through Rosetta’s Eyes

Rosetta’s view of Earth, taken during its March 2005 flyby. Image credit: ESA. Click to enlarge.
ESA?s comet chaser mission Rosetta took infrared and visible images of Earth and the Moon, during the Earth fly-by of 4/5 March 2005 while on its way to Comet 67P/Churyumov-Gerasimenko.

These images, now processed, are part of the first scientific data obtained by Rosetta. ?The Earth fly-by represented the first real chance to calibrate and validate the performance of the Rosetta?s instruments on a real space object, to make sure everything works fine at the final target,? said Angioletta Coradini, Principal Investigator for the Visible and Infrared Thermal Imaging Spectrometer (VIRTIS) instrument.

?Although we were just calibrating VIRTIS during the Earth fly-by last month, we obtained images of Earth and the Moon which have a high scientific content,? she added.

On 4 and 5 March, before closest approach to Earth and from a distance of 400 000 kilometres from our Moon, Rosetta?s VIRTIS took these images with high resolution in visible and infrared light. In these images, only a small portion of the Moon surface was illuminated (between 19% and 32%).

The spectral analysis (chemical ?finger-printing?) gives indications of the mineralogical differences between highlands and ?seas? or ?maria?. For instance, it was possible to see marked differences in the abundance of two kinds of rocks known as pyroxene and olivine.

On 5 March, after the closest approach to Earth, VIRTIS then took a series of high-resolution images of our planet in visible and infrared light from a distance of 250 000 kilometres. Only 49% of the Earth surface was visible from Rosetta.

Once at Comet 67P/Churyumov-Gerasimenko in 2014, VIRTIS will be used to determine the composition and the nature of the solid nucleus and the gases present in the comet?s coma.

In combination with the other Rosetta instruments, it will also help the selection of the ?touchdown? site for the Rosetta lander Philae.

Before then, Rosetta will make more cosmic loops to reach the comet, and its instruments will collect new data about planets, asteroids and comets. The next encounter with Earth is planned for November 2007.

VIRTIS as been developed by a large consortium of European scientists, with major contribution by Italy, France and Germany.

Original Source: ESA News Release

Earthquake Should Show a Gravity Scar

Image credit: ESA
A new ESA study predicts that the devastating Sumatran earthquake, which resulted in the tragic tsunami of 26 December 2004, will have left a ?scar? on Earth?s gravity that could be detected by a sensitive new satellite, due for launch next year.

The Sumatran earthquake measured 9 on the Richter scale and caused widespread devastation and death when it struck unexpectedly late last year. Thankfully, earthquakes of this magnitude are rare events, taking place perhaps once every two decades.

Seismological data suggests that, during the event, the seafloor on either side of a fault line running for 1000 km along the bottom of the Indian Ocean dramatically changed height, producing a ledge, 6 metres high. Such a large-scale movement will change the gravitational field of the Earth. Roberto Sabadini and Giorgio Dalla Via, University of Milan, and colleagues have calculated this change. They found that the Earth?s gravity altered, in an instant, by as much as is expected from six years’ worth of melting at the Patagonian Ice Fields in southernmost South America.

It may seem surprising that Earth?s gravity is not equally strong at all points of the globe. Instead, it varies by a small fraction due to the presence of such things as mountains or deep ocean trenches. The tides and ocean circulation patterns also affect the gravity, as does the rotation of the Earth itself, which bulges out the planet?s equator and makes its diameter 21 kilometres wider than the pole-to-pole distance.

In order to measure the deviations from the average level of gravity, Earth scientists invented the concept of the geoid. This is a bit like a hi-tech version of ?sea level?, which is often used to give an absolute height measure. Today?s modern measurements need something more accurate, however.

The geoid is a hypothetical surface, on which the gravitational pull of the Earth is the same everywhere. It wraps itself around the Earth, moving away from the real surface when it is over areas of greater density and therefore stronger gravity. Over less dense regions, the geoid moves closer to the real surface.

When material is moved around, either instantaneously in an earthquake or gradually as in a melting ice field, the Earth?s gravity in the local region changes and so does the height of the geoid. In the Sumatran earthquake, Sabadini and Dalla Via found that the total geoid movement was some 18 mm ? a lot for a geoid!

ESA?s Gravity Field and Ocean Circulation Explorer (GOCE) is designed to sensitively investigate the gravitational field of the Earth from orbit. As the spacecraft passes over regions of stronger and weaker gravitational pull, it will bob up and down. Such deviations are far below the perceptible limits of humans but GOCE is equipped with a device called a gradiometer than can detect these ultra-subtle differences. By measuring the deviations in the geoid, scientists can gain a unique window into our planet.

?This work is at the frontier of geophysics and the perfect complement to seismology,? says Sabadini, ?Seismology is good for detecting the slip of earthquake faults and the location of the epicentre, geoid monitoring can determine how much mass is actually being moved around.?

It can also be used in the quest to understand climate change as ocean circulation also affects the geoid. Changes in climate, which in turn affect the ocean circulation pattern, will show up as a yearly change in the geoid. With so much to offer, the GOCE satellite is scheduled to launch in 2006. A paper on the Sumatran Earthquake by Roberto Sabadini, Giorgio Dalla Via, Masja Hoogland, Abdelkrim Aoudia is published in EOS, the journal of the American Geophysical Union.

Original Source: ESA News Release

Iceberg Smashes Off a Chunk of Antarctica

Maps of Antarctica need to be amended. The long-awaited collision between the vast B-15A iceberg and the landfast Drygalski ice tongue has taken place. This Envisat radar image shows the ice tongue ? large and permanent enough to feature in Antarctic atlases – has come off worst.

An image acquired by Envisat on 15 April 2005 shows that a five-kilometre-long section at the seaward end of Drygalski has broken off following a collision with the drifting B-15A. The iceberg itself appears so far unaffected. With more than half the iceberg still to clear the floating pier of ice, Drygalski may undergo more damage in coming days.

It is an old philosophical paradox: what happens when an irresistible force meets an immovable object? For the past few months, ESA’s Envisat satellite has been watching an answer play out in ice, as the B-15A iceberg converged on the Drygalski ice tongue.

The sheer scale of B-15A is best appreciated from space. The bottle-shaped Antarctic iceberg is around 115 kilometres long, with an area exceeding 2500 square kilometres, making it about as large as the entire country of Luxembourg.

From January the iceberg has been drifting towards, then past, the 70-kilometre-long Drygalski ice tongue in McMurdo Sound on the Ross Sea. In the last month prevailing currents have been slowly edging B-15A along past the northern edge of Drygalski.

Envisat’s Advanced Synthetic Aperture Radar (ASAR) instrument has been monitoring events since the start of the year, gathering the highest frequency weather-independent satellite dataset of this area ever.

Ice in opposition
B-15A is the largest remaining section of the even larger B-15 iceberg that calved from the Ross Ice Shelf in March 2000. Equivalent in size to Jamaica, B-15 had an initial area of 11 655 square kilometres but subsequently broke up into smaller pieces.

Since then, the largest piece – B-15A – has found its way to McMurdo Sound, where its presence has blocked ocean currents and led to a build-up of sea ice. With the Antarctic summer now at an end and in-situ observations therefore limited, the ASAR instrument aboard Envisat becomes even more useful for monitoring changes in polar ice and tracking icebergs.

Its radar signals pass freely through the thickest polar storm clouds or local darkness. And because ASAR is sensitive to surface texture as well as physical and chemical properties, the sensor is extremely sensitive to different types of ice ? for example clearly delineating the older rougher surface of the Drygalski ice tongue and iceberg B15A from the surrounding sea ice pack.

The Drygalski ice tongue is located at the opposite end of McMurdo Sound from the US and New Zealand bases. The long narrow tongue stretches out to sea as an extension of the land-based David Glacier, which flows through coastal mountains of Victoria Land.

Twin-mode ASAR Antarctic observations
Envisat’s ASAR instrument monitors Antarctica in two different modes: Global Monitoring Mode (GMM) provides 400-kilometre swath one-kilometre resolution images, enabling rapid mosaicking of the whole of Antarctica to monitor changes in sea ice extent, ice shelves and iceberg movement.

Wide Swath Mode (WSM) possesses the same swath but with 150-metre resolution for a detailed view of areas of particular interest.

ASAR GMM images are routinely provided to a variety of users including the US National Oceanic and Atmospheric Administration (NOAA) National Ice Centre, responsible for tracking icebergs worldwide.

ASAR imagery is also being used operationally to track icebergs in the Arctic by the Northern View and ICEMON consortia, which provide ice monitoring services as part of the Global Monitoring for Environment and Security (GMES) initiative, jointly backed by ESA and the European Union.

This year also sees the launch of CryoSat, a dedicated ice-watching mission designed to precisely map changes in the thickness of polar ice sheets and floating sea ice.

CryoSat, in connection with regular Envisat ASAR GMM mosaics and SAR interferometry ? a technique used to combine radar images to measure tiny centimetre-scale shifts between acquisitions – should answer the question of whether the kind of ice-shelf calving that gave rise to B-15 and its descendants are a consequence of ice sheet dynamics or other factors.

Together they will provide insight into whether such iceberg calving occurrences are becoming more common, as well as improving our understanding of the relationship between the Earth’s ice cover and the global climate.

Original Source: ESA News Release

Earth Seen in Gamma Rays

A NASA-funded scientist has produced a new type of picture of the Earth from space, which complements the familiar image of our “blue marble”. This new picture is the first detailed image of our planet radiating gamma rays, a type of light that is millions to billions of times more energetic than visible light.

The image portrays how the Earth is constantly bombarded by particles from space. These particles, called cosmic rays, hit our atmosphere and produce the gamma-ray light high above the Earth. The atmosphere blocks harmful cosmic rays and other high-energy radiation from reaching us on the Earth’s surface.

“If our eyes could see high-energy gamma rays, this is what the Earth would look like from space,” said Dr. Dirk Petry of NASA Goddard Space Flight Center in Greenbelt, Md. “Other planets — most famously, Jupiter — have a gamma-ray glow, but they are too far away from us to image in any detail.”

Petry assembled this image from seven years of data from NASA’s Compton Gamma-Ray Observatory, which was active from 1991 to 2000. The Compton Observatory orbited the Earth at an average altitude of about 260 miles (420 km). From this distance, the Earth appears as a huge disk with an angular diameter of 140 degrees. The long exposure and close distance enabled Petry to produce a gamma-ray image of surprisingly high detail. “This is essentially a seven-year exposure,” Petry said.

The gamma rays produced in the Earth’s atmosphere were detected by Compton’s EGRET instrument, short for Energetic Gamma-Ray Experiment Telescope. In fact, 60 percent of the gamma rays detected by EGRET were from Earth and not deep space. Although it makes a pretty image, local gamma-ray production interferes with observations of distant gamma-ray sources, such as black holes, pulsars, and supernova remnants.

Petry created this gamma-ray Earth image to better understand the impact of “local” cosmic-ray and gamma-ray interactions on an upcoming NASA mission called GLAST, the Gamma-ray Large Area Space Telescope. GLAST is planned for launch in 2007. Its main instrument, the Large Area Telescope, is essentially EGRET’s successor.

In 1972 and 1973 the NASA satellite SAS-II captured the first resolved image of the Earth in gamma rays, but the detectors had less exposure time (a few months) and worse energy resolution.

Petry, a member of the GLAST team at NASA Goddard, is an assistant research professor at the Joint Center for Astrophysics of the University of Maryland, Baltimore Country. A scientific paper describing his work is available at:

http://xxx.lanl.gov/abs/astro-ph/0410487

Original Source: NASA News Release

Libya’s Ubari and Murzuq Sand Seas

This Envisat image shows two huge sand dune seas in the Fezzan region of southwestern Libya, close to the border with Algeria.

Most of the face of the Sahara desert stretching across Northern Africa is bare stone and pebbles rather than sand dunes, but there are exceptions ? sprawling sea of multi-storey sand dunes known as ‘ergs’.

The Erg Ubari (also called Awbari) is the reddish sand sea towards the top of the image. A dark outcrop of Nubian sandstone separates the Erg Ubari sand from the Erg Murzuq (also called Murzuk) further south.

A persistent high-pressure zone centred over Libya keeps the centre of the Sahara completely arid for years at a time, but research has discovered evidence of ‘paleolakes’ in this region associated with a wetter and more fertile past.

Libya today has no permanent rivers or water bodies, but has various vast fossil aquifers. These natural underground basins hold enormous amounts of fresh water.

Two decades ago an ambitious project called Great Man-Made River was begun, aimed at drawing water from the aquifers beneath the Fezzan region shown in the image, via a network of underground pipes for irrigation in the coastal belt. Upon completion the huge network of pipelines will extend to about 3,380 km.

Envisat’s Medium Resolution Imaging Spectrometer (MERIS), working in Full Resolution mode to provide a spatial resolution of 300 metres, acquired this image on 24 November 2004. It has a width of 672 kilometres.

Original Source: ESA News Release

Lightning Makes Radiation Belts Safer

Lightning in clouds, only a few miles above the ground, clears a safe zone in the radiation belts thousands of miles above the Earth, according to NASA-funded researchers. The unexpected result resolves a forty-year-old debate as to how the safe zone is formed, and it illuminates how the region is cleared after it is filled with radiation during magnetic storms.

The safe zone, called the Van Allen Belt slot, is a potential haven offering reduced radiation dosages for satellites that require Middle Earth Orbits (MEOs). The research may eventually be applied to remove radiation belts around the Earth and other worlds, reducing the hazards of the space environment.

“The multi-billion-dollar Global Positioning System satellites skirt the edge of the safe zone,” said Dr. James Green of NASA’s Goddard Space Flight Center, Greenbelt, Md. He is the lead author of the paper about the research published in the Journal of Geophysical Research. “Without the cleansing effect from lightning, there would be just one big radiation belt, with no easily accessible place to put satellites,” he said.

If the Van Allen radiation belts were visible from space, they would resemble a pair of donuts around the Earth, one inside the other, with the planet in the hole of the innermost. The Van Allen Belt slot would appear as a space between the inner and outer donut. The belts are comprised of high-speed electrically charged particles (electrons and atomic nuclei) trapped in the Earth’s magnetic field. The Earth’s magnetic field has invisible lines of magnetic force emerging from the South Polar Region, out into space and back into the North Polar Region. Because the radiation belt particles are electrically charged, they respond to magnetic forces. The particles spiral around the Earth’s magnetic field lines, bouncing from pole to pole where the planet’s magnetic field is concentrated.

Scientists debated two theories to explain how the safe zone was cleared. The prominent theory stated radio waves from space, generated by turbulence in the zone, cleared it. An alternate theory, confirmed by this research, stated radio waves generated by lightning were responsible. “We were fascinated to discover evidence that strongly supported the lightning theory, because we usually think about how the space environment affects the Earth, not the reverse,” Green said.

The flash we see from lightning is just part of the total radiation it produces. Lightning also generates radio waves. In the same way visible light is bent by a prism, these radio waves are bent by electrically charged gas trapped in the Earth’s magnetic field. That causes the waves to flow out into space along the Earth’s magnetic field lines.

According to the lightning theory, radio waves clear the safe zone by interacting with the radiation belt particles, removing a little of their energy and changing their direction. This lowers the mirror point, the place above the polar regions where the particles bounce. Eventually, the mirror point becomes so low; it is in the Earth’s atmosphere. When this happens, the radiation belt particles can no longer bounce back into space, because they collide with atmospheric particles and dissipate their energy.

To confirm the theory, the team used a global map of lightning activity made with the Micro Lab 1 spacecraft. They used radio wave data from the Radio Plasma Imager on the Imager for Magnetopause to Aurora Global Exploration (IMAGE) spacecraft, combined with archival data from the Dynamics Explorer spacecraft. IMAGE and Dynamics Explorer showed the radio wave activity in the safe zone closely followed terrestrial lightning patterns observed by Micro Lab 1.

According to the team, there would not be a correlation if the radio waves came from space instead of Earth. They concluded when magnetic storms, caused by violent solar activity, inject a new supply of high-speed particles into the safe zone, lightning clears them away in a few days.

Engineers may eventually design spacecraft to generate radio waves at the correct frequency and location to clear radiation belts around other planets. This could be useful for human exploration of interesting bodies like Jupiter’s moon Europa, which orbits within the giant planet’s intense radiation belt.

The research team included Drs. Scott Boardsen, Leonard Garcia, William Taylor, and Shing Fung from Goddard; and Dr. Bodo Reinisch, University of Massachusetts, Lowell. For images and information about this research on the Web, visit: http://www.nasa.gov/vision/universe/solarsystem/image_lightning.html

Original Source: NASA News Release