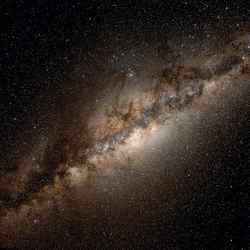
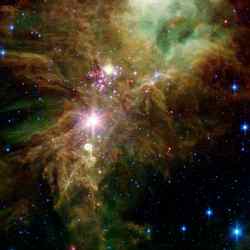
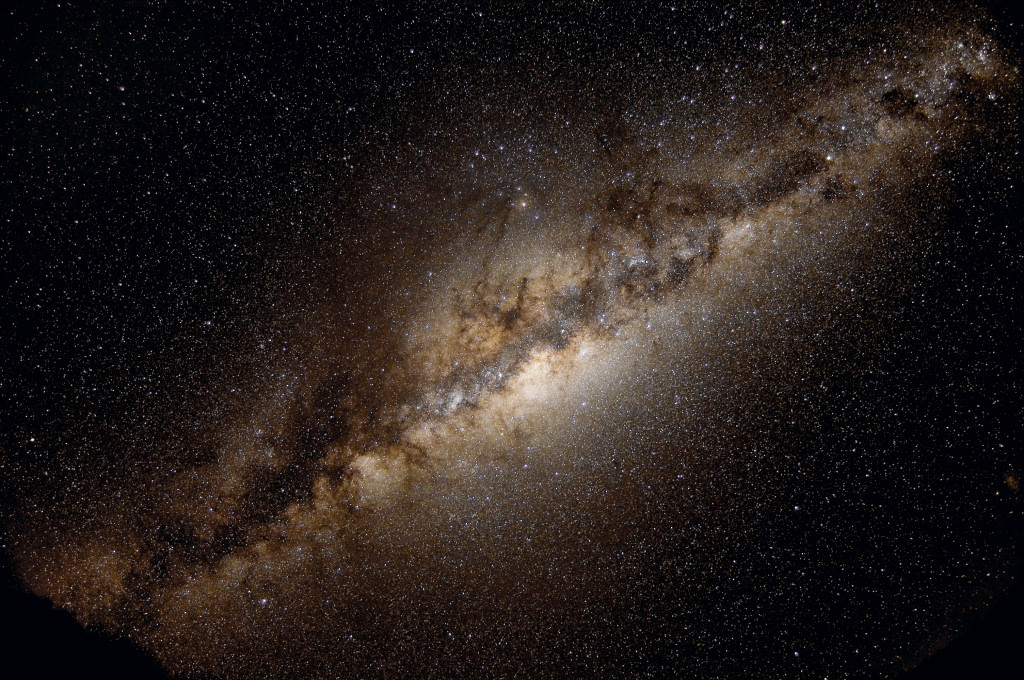
Nearby Star is Forming a Jupiter-Like Planet

Image credit: UA

Astronomers from the University of Arizona have used a new technique called “nulling interferometry” to reveal the planetary disk around a newly-forming star. Incredibly, they discovered a gap in the disk, where a Jupiter-like planet is probably forming. This nulling technique works by combining the light from the central star in such a way that it gets canceled out. This allows fainter objects, such as dust and planets to be observed. The planet is likely several times the mass of Jupiter and orbits its star at about 1.5 billion kilometers.

University of Arizona astronomers have used a new technique called nulling interferometry to probe a dust disk around a young nearby star for the first time. They not only confirmed that the young star does have a protoplanetary disk — the stuff from which solar systems are born — but discovered a gap in the disk, which is strong evidence of a forming planet.

“It’s very exciting to find a star that we think should be forming planets, and actually see evidence of that happening,” said UA astronomer Philip Hinz.

“The bottom line is, we not only confirmed the hypothesis that this young star has a protoplanetary disk, we found evidence that a giant, Jupiter-like protoplanet is forming in this disk,” said Wilson Liu, a doctoral student and research assistant on the project.

“There’s evidence that this star is right on the cusp of becoming a main-sequence star,” Liu added. “So basically, we’re catching a star that is right at the point of becoming a main-sequence star, and it looks like it’s caught in the act of forming planets.”

Main-sequence stars are those like our sun that burn hydrogen at their cores.

Earlier this year, Hinz and Liu realized that observations of HD 100546 at thermal, or mid-infrared, wavelengths showed that the star had a dust disk.

Finding faint dust disks is “analogous to finding a lighted flashlight next to Arizona Stadium when the lights are on,” Liu said.

The nulling technique combines starlight in such a way that it is canceled out, creating a dark background where the star’s image normally would be. Because HD 100546 is such a young star, its dust disk is still relatively bright, about as bright as the star itself. The nulling technique is needed to distinguish what light comes from the star, which can be suppressed, and what comes from the extended dust disk, which nulling does not suppress.

Hinz and UA astronomers Michael Meyer, Eric Mamajek, and William Hoffmann took the observations in May 2002. They used BLINC, the only working nulling interferometer in the world, along with MIRAC, a state-of-the-art mid-infrared camera, on the 6.5-meter (21-foot) diameter Magellan telescope in Chile to study the roughly 10-million-year-old star in the Southern Hemisphere sky.

Typically, dust in disks around stars is uniformly distributed, forming a continuous, flattened, orbiting cloud of material that is hot on the inner edge but cold most of the distance to the frigid outer edge.

“The data reduction was complicated enough that we didn’t realize until later that there was an inner gap in the disk,” Hinz noted.

“We realized the disk appeared about the same size at warmer (10 micron) wavelengths and at colder (20 micron) wavelengths. The only way that could be is if there’s an inner gap.”

The most likely explanation for this gap is that it is created by the gravitational field of a giant protoplanet =AD an object that could be several times more massive than Jupiter. The researchers believe the protoplanet may be orbiting the star at perhaps 10 AU. (An AU, or astronomical unit, is the distance between Earth and the sun. Jupiter is about 5 AU from the sun.)

Astronomers from the Netherlands and Belgium had previously used the Infrared Space Observatory to study HD 100546, which is 330 light-years from Earth. They detected comet-like dust around the star and concluded that it might be a protoplanetary disk. But the European space telescope was too small to clearly see dust surrounding the star.

Hinz, who developed BLINC, has been using the nulling interferometer with two 6.5-meter telescopes for the past three years for his survey of nearby stars in search of protoplanetary systems. In addition to the Magellan telescope that covers the Southern Hemisphere, Hinz uses the 6.5-meter UA/Smithsonian MMT atop Mount Hopkins, Ariz., for the Northern Hemisphere sky.=20

Hinz developed BLINC as a technology demonstration for the Terrestrial Planet Finder mission, which is managed for NASA by the Jet Propulsion Laboratory, Pasadena, Calif. NASA, which funds Hinz’ survey, supports research on solar-system formation under its Origins program and is developing nulling interferometry for Terrestrial Planet Finder.

“Nulling interferometry is very exciting because it is one of only a few technologies that can directly image circumstellar environments,” Liu said.

Using MIRAC, the camera developed by William Hoffmann and others, was important because it is sensitive to mid-infrared wavelengths, Hinz said. Astronomers will have to look in mid-infrared wavelengths, which correspond to room temperatures, to find planets with liquid water and possible life, he said.

Hinz’ survey includes HD 100546 and other “Herbig Ae” stars, which are nearby young stars generally more massive than our sun, but are not yet main sequence stars powered by nuclear fusion.

Hinz and Liu plan to observe increasingly mature star systems, searching for ever-fainter circumstellar dust disks and planets, as they continue to improve nulling interferometry and adaptive optics technologies. Adaptive optics is a technique that eliminates the effects of Earth’s shimmering atmosphere from starlight.

Hinz and others at UA Steward Observatory are designing a nulling interferometer for the Large Binocular Telescope, which will view the sky with two 8.4-meter (27-foot) diameter mirrors on Mount Graham, Ariz., in 2005.

Original Source: UA News

Gamma Ray Map of the Milky Way

Image credit: ESA

The European Space Agency’s Integral gamma-ray observatory has produced a new map of the Milky Way in the gamma-ray spectrum. Integral is looking for traces of radioactive aluminum, which gives off gamma rays with a specific wavelength. But the question is, what’s producing all this aluminum? Some astronomers believe these could be created by specific objects in the Milky Way, like Red Giant stars or hot blue stars. Another possibility is that it’s produced as part of supernova explosions. Integral will help get to the bottom of this mystery.

ESA’s gamma-ray observatory Integral is making excellent progress, mapping the Galaxy at key gamma-ray wavelengths.

It is now poised to give astronomers their truest picture yet of recent changes in the Milky Way’s chemical composition. At the same time, it has confirmed an ‘antimatter’ mystery at the centre of the Galaxy.

Since its formation from a cloud of hydrogen and helium gas, around 12 000 million years ago, the Milky Way has gradually been enriched with heavier chemical elements. This has allowed planets and, indeed, life on Earth to form.

Today, one of those heavier elements – radioactive aluminium – is spread throughout the Galaxy and, as it decays into magnesium, gives out gamma rays with a wavelength known as the ‘1809 keV line.’ Integral has been mapping this emission with the aim of understanding exactly what is producing all this aluminium.

In particular, Integral is looking at the aluminium ‘hot spots’ that dot the Galaxy to determine whether these are caused by individual celestial objects or the chance alignment of many objects.

Astronomers believe that the most likely sources of the aluminium are supernovae (exploding high-mass stars) and, since the decay time of the aluminium is around one million years, Integral’s map shows how many stars have died in recent celestial history. Other possible sources of the aluminium include ‘red giant’ stars or hot blue stars that give out the element naturally.

To decide between these options, Integral is also mapping radioactive iron, which is only produced in supernovae. Theories suggest that, during a supernova blast, aluminium and iron should be produced together in the same region of the exploding star. Thus, if the iron’s distribution coincides with that of the aluminium, it will prove that the overwhelming majority of aluminium comes indeed from supernovae.

These measurements are difficult and have not been possible so far, since the gamma-ray signature of radioactive iron is about six times fainter than that of the aluminium. However, as ESA’s powerful Integral observatory accumulates more data in the course of the next year, it will finally be possible to reveal the signature of radioactive iron. This test will tell astronomers whether their theories of how elements form are correct.

In addition to these maps, Integral is also looking deeply into the centre of the Galaxy, to make the most detailed map ever of ‘antimatter’ there.

Antimatter is like a mirror image to normal matter and is produced during extremely energetic atomic processes: for example, the radioactive decay of aluminium. Its signature is known as the ‘511 keV line.’ Even though Integral’s observations are not yet complete, they show that there is too much antimatter in the centre of the Galaxy to be coming from aluminium decay alone. They also show clearly that there must be many sources of antimatter because it is not concentrated around a single point.

There are many possible sources for this antimatter. As well as supernovae, old red stars and hot blue stars, there are jets from neutron stars and black holes, stellar flares, gamma-ray bursts and interaction between cosmic rays and the dusty gas clouds of interstellar space.

Chris Winkler, Integral’s Project Scientist, says: “We have collected excellent data in the first few months of activity but we can and will do much more in the next year. Integral’s accuracy and sensitivity have already exceeded our expectations and, in the months to come, we could get the answers to some of astronomy’s most intriguing questions.”

Original Source: ESA News Release

Mapping the Hidden Dark Matter

Image credit: Berkeley

Dark matter is an invisible halo of material that seems to surround every galaxy. Astronomers can’t see it, but they know it’s there by the effect of its gravity; there seems to be 10 times as much dark matter as regular matter. Until now, astronomers believed that dark matter probably formed an even mist of particles in space, but researchers from UC Berkeley and MIT have created a computer simulation of how dark matter might clump together into larger chunks of material.

The “dark matter” that comprises a still-undetected one-quarter of the universe is not a uniform cosmic fog, says a University of California, Berkeley, astrophysicist, but instead forms dense clumps that move about like dust motes dancing in a shaft of light.

In a paper submitted this week to Physical Review D, Chung-Pei Ma, an associate professor of astronomy at UC Berkeley, and Edmund Bertschinger of the Massachusetts Institute of Technology (MIT), prove that the motion of dark matter clumps can be modeled in a way similar to the Brownian motion of air-borne dust or pollen.

Their findings should provide astrophysicists with a new way to calculate the evolution of this ghost universe of dark matter and reconcile it with the observable universe, Ma said.

Dark matter has been a nagging problem for astronomy for more than 30 years. Stars within galaxies and galaxies within clusters move in a way that indicates there is more matter there than we can see. This unseen matter seems to be in a spherical halo that extends probably 10 times farther than the visible stellar halo around galaxies. Early proposals that the invisible matter is comprised of burnt-out stars or heavy neutrinos have not panned out, and the current favorite candidates are exotic particles variously called neutrilinos, axions or other hypothetical supersymmetric particles. Because these exotic particles interact with ordinary matter through gravity only, not via electromagnetic waves, they emit no light.

“We’re only seeing half of all particles,” Ma said. “They’re too heavy to produce now in accelerators, so half of the world we don’t know about.”

The picture only got worse four years ago when “dark energy” was found to be even more prevalent than dark matter. The cosmic account now pegs dark energy at about 69 percent of the universe, exotic dark matter at 27 percent, mundane dark matter – dim, unseen stars – at 3 percent, and what we actually see at a mere 1 percent.

Based on computer models of how dark matter would move under the force of gravity, Ma said that dark matter is not a uniform mist enveloping clusters of galaxies. Instead, dark matter forms smaller clumps that look superficially like the galaxies and globular clusters we see in our luminous universe. The dark matter has a dynamic life independent of luminous matter, she said.

“The cosmic microwave background shows the early effects of dark matter clumping, and these clumps grow under gravitational attraction,” she said. “But each of these clumps, the halo around galaxy clusters, was thought to be smooth. People were intrigued to find that high-resolution simulations show they are not smooth, but instead have intricate substructures. The dark world has a dynamic life of its own.”

Ma, Bertschinger and UC Berkeley graduate student Michael Boylan-Kolchin performed some of these simulations themselves. Several other groups over the past two years have also showed similar clumping.

The ghost universe of dark matter is a template for the visible universe, she said. Dark matter is 25 times more abundant than mere visible matter, so visible matter should cluster wherever dark matter clusters.

Therein lies the problem, Ma said. Computer simulations of the evolution of dark matter predict far more clumps of dark matter in a region than there are clumps of luminous matter we can see. If luminous matter follows dark matter, there should be nearly equivalent numbers of each.

“Our galaxy, the Milky Way, has about a dozen satellites, but in simulations we see thousands of satellites of dark matter,” she said. “Dark matter in the Milky Way is a dynamic, lively environment in which thousands of smaller satellites of dark matter clumps are swarming around a big parent dark matter halo, constantly interacting and disturbing each other.”

In addition, astrophysicists modeling the motion of dark matter were puzzled to see that each clump had a density that peaked in the center and fell off toward the edges in the exact same way, independent of its size. This universal density profile, however, appears to be in conflict with observations of some dwarf galaxies made by Ma’s colleague, UC Berkeley professor of astronomy Leo Blitz, and his research group, among others.

Ma hopes that a new way of looking at the motion of dark matter will resolve these problems and square theory with observation. In her Physical Review article, discussed at a meeting earlier this year of the American Physical Society, she proved that the motion of dark matter can be modeled much like the Brownian motion that botanist Robert Brown described in 1828 and Albert Einstein explained in a seminal 1905 paper that helped garner him the 1921 Nobel Prize in Physics.

Brownian motion was first described as the zigzag path traveled by a grain of pollen floating in water, pushed about by water molecules colliding with it. The phenomenon refers equally to the motion of dust in air and dense clumps of dark matter in the dark matter universe, said Ma.

This insight “let’s us use a different language, a different point of view than the standard view,” to investigate the movement and evolution of dark matter, she said.

Other astronomers, such as UC Berkeley emeritus professor of astronomy Ivan King, have used the theory of Brownian motion to model the movement of hundreds of thousands of stars within star clusters, but this, Ma said, “is the first time it has been applied rigorously to large cosmological scales. The idea is that we don’t care exactly where the clumps are, but rather, how clumps behave statistically in the system, how they scatter gravitationally.”

Ma noted that the Brownian motion of clumps is governed by an equation, the Fokker-Planck equation, that is used to model many stochastic or random processes, including the stock market. Ma and collaborators are currently working on solving this equation for cosmological dark matter.

“It is surprising and delightful that the evolution of dark matter, the evolution of clumps, obeys a simple, 90-year-old equation,” she said.

The work was supported by the National Aeronautics and Space Administration.

Original Source: UC Berkeley

First Light for New Infrared Observatory

Image credit: UH IfA

Astronomers from the University of Hawaii’s Institute for Astronomy released new images from their brand new 16-megapixel camera installed on the 2.2 metre telescope on Mauna Kea. This new camera provides a tremendous increase in resolution over the 1-megapixel camera the telescope was using before, and makes this telescope one of the most powerful on Earth for Infrared astronomy. The newly-released image is of galaxy NGC 891, which is 10 million light-years away in the constellation of Andromeda.

Astronomers from the University of Hawaii (UH), Institute for Astronomy (IfA) today released the first image from a gigantic new 16 Megapixel infrared camera recently mounted on the UH 2.2-meter (88-inch) Telescope on Mauna Kea. The new camera provides a sixteen-fold increase in sky coverage together with much higher sensitivity than the 1-Megapixel cameras in widespread use on telescopes for the last decade. Until larger telescopes have similar cameras, it makes the 30-year-old UH 2.2-meter telescope the most powerful in the world for infrared imaging.

The development of this new technology has been driven by the requirements of NASA’s James Webb Space Telescope (JWST), the next step beyond the Hubble Space Telescope and planned for launch within ten years. This 6 meter class space telescope with six times the collecting area of Hubble will be launched into an orbit far beyond the moon where it will cool to temperatures of -400 degrees Fahrenheit, allowing extremely sensitive infrared observations. NASA has selected the UH/RSC (Rockwell Scientific Company) detector technology for the camera on JWST and is expected to adopt it for several other instruments.

Funded by a nearly $7 million award from NASA Ames Research Center, a team at the IfA Hilo facility headed up by Dr. Don Hall, former IfA director, has partnered with the Rockwell Scientific Company in Camarillo, CA, in a four year program to develop 4 Megapixel chips utilizing new infrared detector materials and state of the art silicon chips which, at a size of nearly 2″ x 2″, are some of the largest ever produced. In partnership with GL Scientific, a Honolulu small business, the team has innovated a new approach to mounting the individual 4 Megapixel chips so that four of them can be “tiled” into a 16 Megapixel camera. This approach allows for even larger “mosaic” cameras in the future.

Hall emphasized that the project was run from Hilo. “The IfA team provided technical direction of both the development effort at Rockwell Scientific and the silicon chip fabrication at the UMC foundry in Taiwan,” he said. “In addition, we have established in Hilo a facility to test these new detectors that is widely regarded as the best available”. Hall also commented “complex instruments like this camera usually require extensive de-bugging once they are mounted at the telescope. It is a tribute to the technical excellence of the IfA staff and the superb equipment at the IfA facility that this camera produced science data on its first night”.

The galaxy imaged, NGC 891, is in the constellation Andromeda at a distance of about 10 million light years. It is of particular scientific interest because it is very similar to our own Milky Way Galaxy but is seen almost exactly edge-on. Dr. Richard Wainscoat and Peter Capak, who are analyzing the image, emphasized the importance of being able to image the entire galaxy in a single exposure with the new camera. “With smaller cameras, galaxies such as NGC 891 had to be imaged in small postage stamp sized pieces that had to be painstakingly pieced together – the new camera produces a better image in a tiny fraction of the time,” Wainscoat said. “By allowing us to image very large areas of the sky, this camera will allow us to detect some of the most distant galaxies in the Universe”.

Along with the JWST, large ground based telescopes are already racing to take advantage of this new technology. Two Mauna Kea projects, the Canada-France-Hawaii Telescope and the Gemini Telescopes, are forging ahead with 16 Megapixel infrared cameras and Rockwell Scientific has orders for several other cameras for telescopes in Chile.

IfA Director Dr. Rolf Kudritzki said “This project is an excellent example of IfA’s nurturing of extremely high-tech projects in its Hilo facility and there is an institutional commitment to continued support of such activities. It is particularly gratifying that a number of the key personnel on this project grew up in Hilo and were recruited back from the Mainland and that several others were recruited directly as graduates of UH Hilo. The project also provided important training for undergraduate assistants from UH Hilo, many of whom have gone on to positions in related fields”.

The Institute for Astronomy at the University of Hawaii conducts research into galaxies, cosmology, stars, planets, and the Sun. Its faculty and staff are also involved in astronomy education, deep space missions, and in the development and management of the observatories on Haleakala and Mauna Kea. Refer to http://www.ifa.hawaii.edu/ for more information about the Institute.

Original Source: IFA News Release

ESO Provides Views of N44 Nebula

Image credit: ESO

The European Southern Observatory has released new images of nebula N44 in the Large Magellanic Cloud. Astronomers used the ESO’s Wide-Field-Imager on the 2.2 metre La Silla Observatory to capture the area with unprecedented clarity. N44 is approximately 1,000 light-years across and contains about 40 bright luminous blue stars. The blue stars live for a very short time and then explode as supernovae – some have already exploded in the area, creating some of the nebula’s visible material.

The two best known satellite galaxies of the Milky Way, the Magellanic Clouds, are located in the southern sky at a distance of about 170,000 light-years. They host many giant nebular complexes with very hot and luminous stars whose intense ultraviolet radiation causes the surrounding interstellar gas to glow.

The intricate and colourful nebulae are produced by ionised gas [1] that shines as electrons and positively charged atomic nuclei recombine, emitting a cascade of photons at well defined wavelengths. Such nebulae are called “H II regions”, signifying ionised hydrogen, i.e. hydrogen atoms that have lost one electron (protons). Their spectra are characterized by emission lines whose relative intensities carry useful information about the composition of the emitting gas, its temperature, as well as the mechanisms that cause the ionisation. Since the wavelengths of these spectral lines correspond to different colours, these alone are already very informative about the physical conditions of the gas.

N44 [2] in the Large Magellanic Cloud is a spectacular example of such a giant H II region. Having observed it in 1999 (see ESO PR Photos 26a-d/99), a team of European astronomers [3] again used the Wide-Field-Imager (WFI) at the MPG/ESO 2.2-m telescope of the La Silla Observatory, pointing this 67-million pixel digital camera to the same sky region in order to provide another striking – and scientifically extremely rich – image of this complex of nebulae. With a size of roughly 1,000 light-years, the peculiar shape of N44 clearly outlines a ring that includes a bright stellar association of about 40 very luminous and bluish stars.

These stars are the origin of powerful “stellar winds” that blow away the surrounding gas, piling it up and creating gigantic interstellar bubbles. Such massive stars end their lives as exploding supernovae that expel their outer layers at high speeds, typically about 10,000 km/sec.

It is quite likely that some supernovae have already exploded in N44 during the past few million years, thereby “sweeping” away the surrounding gas. Smaller bubbles, filaments, bright knots, and other structures in the gas together testify to the extremely complex structures in this region, kept in continuous motion by the fast outflows from the most massive stars in the area.
The new WFI image of N44

The colours reproduced in the new image of N44, shown in PR Photo 31a/03 (with smaller fields in more detail in PR Photos 31b-e/03) sample three strong spectral emission lines. The blue colour is mainly contributed by emission from singly-ionised oxygen atoms (shining at the ultraviolet wavelength 372.7 nm), while the green colour comes from doubly-ionised oxygen atoms (wavelength 500.7 nm). The red colour is due to the H-alpha line of hydrogen (wavelength 656.2 nm), emitted when protons and electrons combine to form hydrogen atoms. The red colour therefore traces the extremely complex distribution of ionised hydrogen within the nebulae while the difference between the blue and the green colour indicates regions of different temperatures: the hotter the gas, the more doubly-ionised oxygen it contains and, hence, the greener the colour is.

The composite photo produced in this way approximates the real colours of the nebula. Most of the region appears with a pinkish colour (a mixture of blue and red) since, under the normal temperature conditions that characterize most of this H II region, the red light emitted in the H-alpha line and the blue light emitted in the line of singly-ionised oxygen are more intense than that emitted in the line of the doubly-ionised oxygen (green).

However, some regions stand out because of their distinctly greener shade and their high brightness. Each of these regions contains at least one extremely hot star with a temperature somewhere between 30,000 and 70,000 degrees. Its intense ultraviolet radiation heats the surrounding gas to a higher temperature, whereby more oxygen atoms are doubly ionised and the emission of green light is correspondingly stronger, cf. PR Photo 31c/03.

Original Source: ESO News Release

Closest Galaxy Discovered

Image credit: CNRS

An international team of astronomers have discovered a new galaxy colliding with our own Milky Way. This new galaxy, Canis Major, is located only 42,000 light years away from the centre of the Milky Way – it’s our new “closest galaxy”. Canis Major was discovered during an infrared survey of the sky, which allowed the astronomers to peer through the obscuring dust and gas of the Milky Way. Canis Major is quite small (as galaxies go); it only contains about a billion stars.

An international team of astronomers from France, Italy, the UK and Australia has found a previously unknown galaxy colliding with our own Milky Way. This newly-discovered galaxy takes the record for the nearest galaxy to the centre of the Milky Way. Called the Canis Major dwarf galaxy after the constellation in which it lies, it is about 25000 light years away from thesolar system and 42000 light years from the centre of the Milky Way. This i closer than the Sagittarius dwarf galaxy, discovered in 1994, which is also colliding with the Milky Way. The discovery shows that the Milky Way is building up its own disk by absorbing small satellite galaxies. The research is to be published in the Monthly Notices of the Royal Astronomical Society within the next few weeks.

The discovery of the Canis Major dwarf was made possible by a recent survey of the sky in infrared light (the Two-Micron All Sky Survey or “2MASS”), which has allowed astronomers to look beyond the clouds of dust in the disk of the Milky Way. Until now, the dwarf galaxy lay undetected behind the dense disk. “It’s like putting on infrared night-vision goggles,” says team-member Dr Rodrigo Ibata of Strasbourg Observatory. “We are now able to study a part of the Milky Way that has been previously out of sight”.

The new dwarf galaxy was detected by its M-giant stars =AD cool, red stars that shine especially brightly in infrared light. “We have used these rare M-giant stars as beacons to trace out the shape and location of the new galaxy because its numerous other stars are too faint for us to see,” explains Nicolas Martin, also of Strasbourg Observatory. “They are particularly useful stars as we can measure their distances, and so map out the three-dimensional structure of distant regions of the Milky Way disk.” In this way, the astronomers found the main dismembered corpse of the dwarf galaxy in Canis Major and long trails of stars leading back to it. It seems that streams of stars pulled out of the cannibalised Canis Major galaxy not only contribute to the outer reaches of the Milky Way’s disk, but may also pass close to the Sun.

Astronomers currently believe that large galaxies like the Milky Way grew to their present majestic proportions by consuming their smaller galactic neighbours. They have found that cannibalised galaxies add stars to the vast haloes around large galaxies. However, until now, they did not appreciate that even the disks of galaxies can grow in this fashion. Computer simulations show that the Milky Way has been taking stars from the Canis Major dwarf and adding them to its own disk – and will continue to do so.

“On galactic scales, the Canis Major dwarf galaxy is a lightweight of about only one billion Suns,” said Dr. Michele Bellazzini of Bologna Observatory. “This small galaxy is unlikely to hold together much longer. It is being pushed and pulled by the colossal gravity of our Milky Way, which has been progressively stealing its stars and pulling it apart.” Some remnants of the Canis Major dwarf form a ring around the disk of the Milky Way.

“The Canis Major dwarf galaxy may have added up to 1% more mass to our Galaxy,” said Dr Geraint Lewis of the University of Sydney. “This is also an important discovery because it highlights that the Milky Way is not in its middle age – it is still forming.” “Past interactions of the sort we are seeing here could be responsible for some of the exquisite detail we see today in the structure of the Galaxy,” says Dr Michael Irwin of the University of Cambridge.

Original Source: RAS News Release

Cassini Listens to a Solar Storm

Image credit: NASA/JPL

The Sun ejected two massive flares towards the Earth last week, and NASA’s Cassini spacecraft listened in on the burst of radio waves that accompanied them. The radio waves took 69 minutes to reach Cassini, moving at the speed of light, and they sound a bit like the whoosh of a jet engine. The blast of radio waves was one of the largest ever recorded – a type 3 event. Cassini is on track to reach Saturn on July 1, 2004.

University of Iowa Professor and Space Physicist Dr. Don Gurnett used NASA’s Cassini spacecraft to record the sound of one of the largest solar flares seen in decades, as it moved outward from the Sun.

The sound can be heard online at: http://www-pw.physics.uiowa.edu/space-audio/.

NASA’s Solar and Heliospheric Observatory (SOHO) spacecraft captured this image of a solar flare, seen in the lower center of the image, as it erupted from the Sun early on Tuesday, October 28, 2003.

The radio wave burst, resembling the clicking of an old-fashioned telegraph machine followed by the rush of a jet engine, was recorded Oct. 28 by Cassini while on its way to a July 1, 2004, encounter with Saturn. Cassini will be the first orbiter to give us a close-up look at the ringed world and its moons. Its piggybacked Huygens probe, contributed by the European Space Agency, will descend through the smoggy atmosphere of Saturn’s moon Titan, impacting on what could be a liquid methane ocean.

Gurnett noted that the radio waves — moving at the speed of light — took just 69 minutes to reach the spacecraft, currently some 1.3 billion kilometers (809 million miles) from Earth.

“This is one of the biggest events of its kind ever seen,” said Gurnett. The event, described as a “type 3” radio burst, was detected using the Cassini radio and plasma wave instrument, largely built at the University of Iowa, and for which Gurnett serves as principal investigator.

“The sound is produced by electrons moving out from the solar flare, beginning at a high frequency before dropping to a lower frequency,” Gurnett said. Scientists monitoring the solar flare said that the massive cloud — composed of billions of tons of electrically charged particles — reached Earth on Oct. 29.

Cassini-Huygens is a cooperative mission of NASA, the European Space Agency and the Italian Space Agency. JPL, a division of Caltech, manages the mission for NASA’s Office of Space Science, Washington, D.C.

Original Source: NASA/JPL News Release

Sloan Builds 3D Map of the Universe

Image credit: SDSS

Astronomers from the Sloan Digital Sky Survey have gathered data to build a precise 3-dimensional map that details the clusters of galaxies and dark matter. The map includes images of 200,000 galaxies up to 2 billion light-years away, accounting for six percent of the sky. The SDSS team – 200 astronomers in 13 countries – measured the Universe to contain 70% dark energy (a mysterious force that repels galaxies apart), 25% dark matter, and 5% normal matter.

Astronomers from the Sloan Digital Sky Survey (SDSS) have made the most precise measurement to date of the cosmic clustering of galaxies and dark matter, refining our understanding of the structure and evolution of the Universe.

“From the outset of the project in the late 80’s, one of our key goals has been a precision measurement of how galaxies cluster under the influence of gravity”, explained Richard Kron, SDSS’s director and a professor at The University of Chicago.

SDSS Project spokesperson Michael Strauss from Princeton University and one of the lead authors on the new study elaborated that: “This clustering pattern encodes information about both invisible matter pulling on the galaxies and about the seed fluctuations that emerged from the Big Bang.”

The findings are described in two papers submitted to the Astrophysical Journal and to the Physical review D; they can be found on the physics preprint Web site, www.arXiv.org, on October 28.

MAPPING FLUCTUATIONS
The leading cosmological model invokes a rapid expansion of space known as inflation that stretched microscopic quantum fluctuations in the fiery aftermath of the Big Bang to enormous scales. After inflation ended, gravity caused these seed fluctuations to grow into the galaxies and the galaxy clustering patterns observed in the SDSS.

Images of these seed fluctuations were released from the Wilkinson Microwave Anisotropy Probe (WMAP) in February, which measured the fluctuations in the relic radiation from the early Universe.

“We have made the best three-dimensional map of the Universe to date, mapping over 200,000 galaxies up to two billion light years away over six percent of the sky”, said another lead author of the study, Michael Blanton from New York University. The gravitational clustering patterns in this map reveal the makeup of the Universe from its gravitational effects and, by combining their measurements with that from WMAP, the SDSS team measured the cosmic matter to consist of 70 percent dark energy, 25 percent dark matter and five percent ordinary matter.

The SDSS is two separate surveys in one: galaxies are identified in 2D images (right), then have their distance determined from their spectrum to create a 2 billion lightyears deep 3D map (left) where each galaxy is shown as a single point, the color representing the luminosity – this shows only those 66,976 our of 205,443 galaxies in the map that lie near the plane of Earth’s equator. (Click for high resolution jpg, version without lines.)
They found that neutrinos couldn’t be a major constituent of the dark matter, putting among the strongest constraints to date on their mass. Finally, the SDSS research found that the data are consistent with the detailed predictions of the inflation model.

COSMIC CONFIRMATION
These numbers provide a powerful confirmation of those reported by the WMAP team. The inclusion of the new SDSS findings helps to improve measurement accuracy, more than halving the uncertainties from WMAP on the cosmic matter density and on the Hubble parameter (the cosmic expansion rate). Moreover, the new measurements agree well with the previous state-of-the-art results that combined WMAP with the Anglo-Australian 2dF galaxy redshift survey.

“Different galaxies, different instruments, different people and different analysis – but the results agree”, says Max Tegmark from the University of Pennsylvania, first author on the two papers. “Extraordinary claims require extraordinary evidence”, Tegmark says, “but we now have extraordinary evidence for dark matter and dark energy and have to take them seriously no matter how disturbing they seem.”
The new SDSS results (black dots) are the most accurate measurements to date of how the density of the Universe fluctuates from place to place on scales of millions of lightyears. These and other cosmological measurements agree with the theoretical prediction (blue curve) for a Universe composed of 5% atoms, 25% dark matter and 70% dark energy. The larger the scales we average over, the more uniform the Universe appears. (Click for high resolution jpg, no frills version.)

“The real challenge is now to figure what these mysterious substances actually are”, said another author, David Weinberg from Ohio State University.

SDSS LARGE-SCALE UNDERTAKING
The SDSS is the most ambitious astronomical survey ever undertaken, with more than 200 astronomers at 13 institutions around the world.

“The SDSS is really two surveys in one”, explained Project Scientist James Gunn of Princeton University. On the most pristine nights, the SDSS uses a wide-field CCD camera (built by Gunn and his team at Princeton University and Maki Sekiguchi of the Japan Participation Group) to take pictures of the night sky in five broad wavebands with the goal of determining the position and absolute brightness of more than 100 million celestial objects in one-quarter of the entire sky. When completed, the camera was the largest ever built for astronomical purposes, gathering data at the rate of 37 gigabytes per hour.

On nights with moonshine or mild cloud cover, the imaging camera is replaced with a pair of spectrographs (built by Alan Uomoto and his team at The Johns Hopkins University). They use optical fibers to obtain spectra (and thus redshifts) of 608 objects at a time. Unlike traditional telescopes in which nights are parceled out among many astronomers carrying out a range of scientific programs, the special-purpose 2.5m SDSS telescope at Apache Point Observatory in New Mexico is devoted solely to this survey, to operate every clear night for five years.

The first public data release from the SDSS, called DR1, contained about 15 million galaxies, with redshift distance measurements for more than 100,000 of them. All measurements used in the findings reported here would be part of the second data release, DR2, which will be made available to the astronomical community in early 2004.

Strauss said the SDSS is approaching the halfway point in its goal of measuring one million galaxy and quasar redshifts.

“The real excitement here is that disparate lines of evidence from the cosmic microwave background (CMB), large-scale structure and other cosmological observations are all giving us a consistent picture of a Universe dominated by dark energy and dark matter”, said Kevork Abazajian of the Fermi National Accelerator Laboratory and the Los Alamos National Laboratory.

Original Source: Sloan Digital Sky Survey News Release

Learning How Planets Form

Astronomers are hoping NASA’s new Space Infrared Telescope Facility will answer more questions about how disks of gas and dust turn into a planetary system. The problem is that the disk seems to get obscured by material during the middle stages of its formation. SIRTF should be able to peer through the obscuring material to reveal this missing link of planetary formation. At some point in the system’s evolution, mass is eaten up by the star, ejected into space or transformed into planets – SIRTF may help to solve this riddle.

Just as anthropologists sought “the missing link” between apes and humans, astronomers are embarking on a quest for a missing link in planetary evolution. Only instead of dusty fields and worn shovels, their laboratory is the universe, and their tool of choice is NASA?s new Space Infrared Telescope Facility.

Launched on Aug.25, NASA’s fourth and final Great Observatory will soon set its high-tech infrared eyes on, among other celestial objects, the dusty discs surrounding stars where planets are born.

While other ground- and space-based telescopes have spied these swirling “circumstellar” discs, both young and old, they have missed middle-aged discs for various reasons. The Space Infrared Telescope Facility’s unprecedented sensitivity and resolution will allow it to fill in this gap ? and in the process answer fundamental questions regarding how planets, including those resembling Earth, may form.

“With the Space Infrared Telescope Facility, we anticipate seeing many planetary discs at all stages of development,” says Dr. Karl Stapelfeldt of JPL, a scientist with the mission. “By studying how they change over time, we may be able to determine what conditions favor planet formation.”

Circumstellar discs are a natural step in the evolution of stars. Stars begin life as dense cocoons of gas and dust, then as pressure and gravity kick in, they begin to coalesce, and a flat ring of gas and dust takes shape around them. As stars continue to age, they suck material from this disc into their core. Eventually, a state of equilibrium is reached, leaving a more mature star encircled by a stable disc of debris.

It is around this time, about 10 million years into the lifetime of the star, that astronomers believe planets arise. Dust particles in the discs are thought to collide to form larger bodies, which ultimately sweep out gaps in the discs, much like those lying between the rings of Saturn.

“You can think of planets as wrecking balls that either clear away debris or gather it up as if it were mud,” says Dr. George Rieke, principal investigator on one of the three science instruments onboard the observatory.

Infrared telescopes can sense the glow of the cosmic dust that makes up these discs; however, they cannot detect planets directly. Planets have less surface area than their equivalent in dust grains and thus give off less infrared light. This is the same reason coffee is ground up before brewing: the larger combined surface area of the coffee grains results in a more robust pot of coffee.

Past observations of circumstellar discs generally fall into two categories: young, opaque discs (called protoplanetary discs) with more than enough mass to match our own solar system’s planetary bodies; or older, transparent discs (called debris discs) with masses equal to a few moons, and doughnut-like holes at their center. Middle-aged discs linking these two developmental stages have gone undetected.

One of the questions astronomers hope to address with the Space Infrared Telescope Facility is: What happened to all the mass observed in the younger discs? Somewhere in their evolution, mass is either eaten up by the star, ejected by the star ? or transformed into planets that lie in the doughnut holes of the discs. By analyzing the composition and structure of the “missing link” discs, astronomers hope to solve this riddle, and better understand how planetary systems like our own evolved.

Original Source: NASA News Release

SIRTF Successfully Focused

Image credit: NASA

NASA?s recently launched Space Infrared Telescope Facility (SIRTF) passed an important milestone this week when it was successfully focused. The fourth, and last, of NASA?s great observatory has been in space since it was launched on August 25, and since then, it?s been slowly cooling down. The telescope is now only five degrees above Absolute Zero ? this will let it pick up the faint infrared emissions from distant objects in space without seeing its own heat. The observatory will eventually reveal previously unseen objects obscured by gas and dust.

The Space Infrared Telescope Facility, NASA’s fourth and final Great Observatory, has been successfully focused. This crucial milestone ? which will enable the observatory’s infrared eyes to see the cosmos in clear detail ? was achieved after a series of delicate adjustments were made to the telescope’s secondary mirror.

Since launch on Aug. 25, the Space Infrared Telescope Facility has performed as expected, proceeding through in-orbit checkout activities on schedule. In addition to achieving final focus, the telescope has cooled to an operating temperature of approximately 5 Kelvin (-268 Celsius or -451 Fahrenheit). This cold temperature will allow the observatory to detect the infrared radiation, or heat, from celestial objects without picking up its own infrared signature.

“The science community now has an outstanding observatory with which to study the universe,” said Dr. Michael Werner, project scientist for the mission at NASA’s Jet Propulsion Laboratory, Pasadena, Calif. “We are eager to complete the fine-tuning of the observatory and begin the science program.”

In-orbit checkout activities are scheduled to continue for 11 more days, after which a one-month science verification phase will occur. Following this, the science program will begin.

From its innovative Earth-trailing orbit around the Sun, the Space Infrared Telescope Facility will pierce the dusty darkness enshrouding much of the universe, revealing galaxies billions of light years away; brown dwarfs, or failed stars; and planet-forming discs around stars.

JPL, a division of the California Institute of Technology in Pasadena, manages the Space Infrared Telescope Facility for NASA’s Office of Space Science, Washington, D.C. Further information about the Space Infrared Telescope Facility is available at http://sirtf.caltech.edu/.

Original Source: NASA/JPL News Release