Map of the Milky Way

The major and minor arms of the Milky Way. Image Credit: NASA/JPL-Caltech

[/caption]

The Milky Way is pretty hard to map, given that we live inside of it and have to peer through all of the dust and gas that lie inside the disk. Though we can’t get a picture of our galaxy from outside, we can create images and maps from computer modeling of the stars we see in the disk.

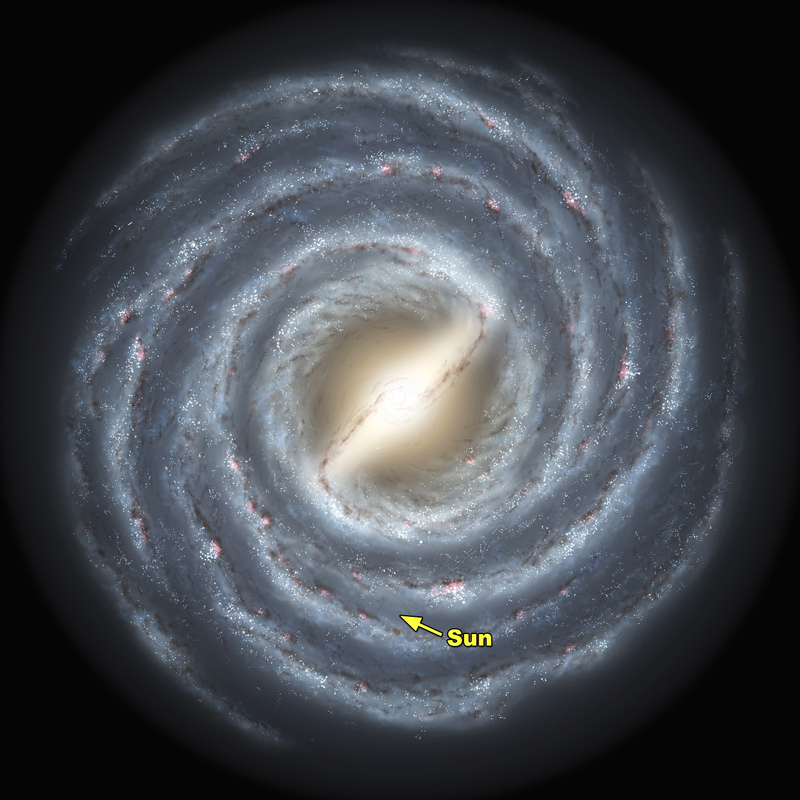
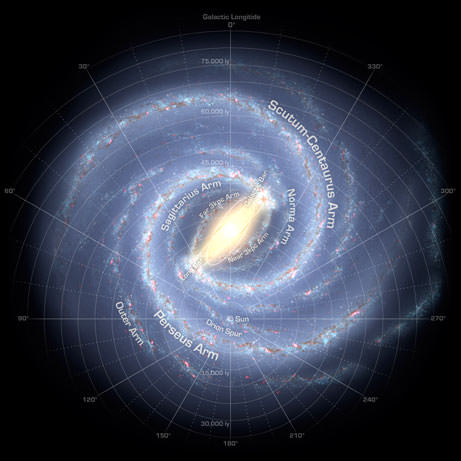
The Milky Way – until recently – was thought to be a barred spiral with four star-forming arms, named  Norma, Scutum-Centaurus, Sagittarius and Perseus. In June of 2008, images from NASA’s Spitzer Space Telescope revealed that the Milky Way is a barred spiral with only two major arms, demoting the Sagittarius and Norma arms to minor arms. The Sun lies in a minor arm, named the Orion Arm, or Orion Spur, sandwiched between the Sagittarius minor arm and Perseus arm.

Our galaxy is a large disk approximately 100,000 light years across. There’s a bulge in the center that is 12,000-16,000 light years thick, and is home to a black hole named Sagittarius A*. Other areas of the disk range between 2,300 and 2,600 light years in thickness.

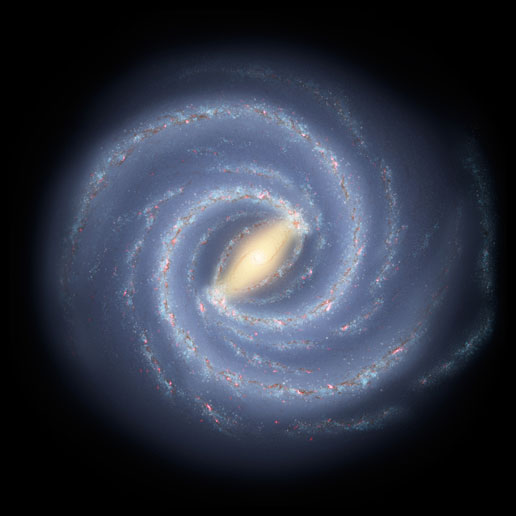
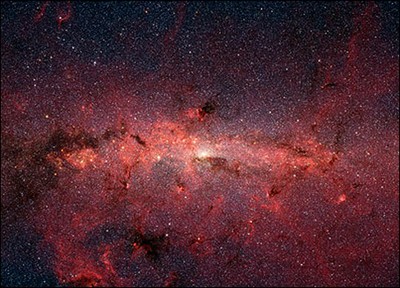
The image above is a representation of what the Milky Way would look like from above. Of course, there are plenty of maps of the Milky Way as we see it from the Earth. Also, you can go outside on a clear night and see it splashed across the sky. Below is an image in the infrared, with the various regions marked (named because of the constellation in which they lie).

Infrared map of the Milky Way. Image Credit: NASA/JPL-Caltech

Plenty of maps are available all over the web in a variety of spectrum. Here’s a gallery of 9 images of the Milky Way in different spectra to get you started, and An Atlas of the Universe has maps of the Milky Way and Universe from different perspectives and distances. If you’re looking for interactive maps of the sky and Milky Way, Sky-Map.org, Google Sky and the downloadable Stellarium are all great resources to familiarize yourself with our Galaxy.

If you’re interested in learning more about other aspects of the Milky Way, Astronomy Cast has a whole episode devoted to it. You can also check out the rest of our resources in the Milky Way section of the Guide to Space.

Sources: NASA, Wikipedia

The Diameter of the Milky Way

Map of the Milky Way. Image credit: Caltech

[/caption]

The diameter of the luminous Milky Way is between 100,000 and 120,000 light years across, but that number could be much larger if you take into account dark matter. It all depends on where you measure the edge of the Milky Way to be…

If you are just measuring the normal matter we can see (in visible, infrared, X-ray and ultraviolet light), then the Milky Way is at least 100,000 light years across. The diameter is a bit larger (120,000 light years) if you take into account tidal streams – basically other galaxies the Milky Way is eating, such as the Sagittarius Dwarf Elliptical Galaxy.

But normal matter isn’t all that makes up the Milky Way. Simulations of our galaxy show that it has a “halo” of dark matter, which makes up about 10 times the mass of the visible matter in the Milky Way. Dark matter has never been directly observed, but is inferred due to its gravitational pull. This halo extends past the edge of the luminous part of the Milky Way, but the size of the halo has yet to be determined to a great degree of accuracy.

How do we measure the diameter of the Milky Way, given the fact that we live inside of it? We measure the distance to Cepheid variable stars. These are stars whose luminosity changes in a very predictable way because they puff up and shrink. Knowing the absolute luminosity of these stars allows us to measure their distance. Think of it this way: if you know how bright a flashlight is at 10 feet from you, and how that luminosity changes over distance, when it moves further away you can calculate that distance by determining how much dimmer the flashlight is.

Pamela talks about the diameter of the Milky Way, and how we measure it, in Episode 99 of Astronomy Cast. If you’re interested in learning more about variable stars – or even observing them – the American Association of Variable Star Observers is a great place to start.

How Old is the Milky Way?

Artist's illustration of the Milky Way. Credit; NASA

If you were going to throw a birthday party for the Milky Way, how many candles would you put on the cake? What is the age of the Milky Way? Well, even though this is a difficult question to answer, either way you slice the cake you need a lot of candles. If you were to put a candle for each year the Milky way has aged, then you’d need between 10 and 13.6 billion candles. That would be mighty difficult to blow out all in one go.

The oldest stars in the Milky Way are 13.4 billion years, give or take 800 million years. This is somewhat close to what the age of the Universe is (which hovers around 13.7 billion years). By measuring the age of these stars, and then calculating the interval between their formation and the death of the previous generation of stars, we can come to an approximate age of the Milky Way as 13.6 billion years. Here’s a good article on how this process works.

The age of the Milky Way is determined by measuring the amount of beryllium present in some of the oldest known stars in the Milky Way. Hydrogen, helium and lithium were all present right after the Big Bang, while heavier elements are produced in the interiors of stars and dispersed via supernovae. Beryllium-9, however, is produced by collisions of cosmic rays with heavier elements.

Since beryllium is formed in this way, and not in supernovae, it can act as a “cosmic clock” of sorts. The longer the duration between the first stars that created heavier elements and the stars that make up globular clusters in the early Milky Way, the more beryllium there should be from the exposure to galactic cosmic rays. By measuring the beryllium content of the oldest stars in the Milky Way, the age of the Milky Way can be approximated.

This method is kind of like using radioactive decay of carbon-14 on Earth to determine the age of fossils. Radioactive decay of uranium-238 and thorium-232 gives an age of the Milky Way as similar to that of measuring the abundance of beryllium.

The age of the Milky Way is a tricky question to answer, though, because we can say that the oldest stars are 13.4 billion years old but the galaxy as we know it today still had to form out of globular clusters and dwarf elliptical galaxies in an elegant gravitational dance. If you want to define the age of the Milky Way as the formation of the galactic disk, our galaxy would be much younger. The galactic disk is not thought to have formed until about 10 – 12 billion years ago.

Here’s an article on how the bulge in the Milky Way may have formed earlier than the rest. Also, we’ve recorded a show all about the Milky Way on Astronomy Cast.

Source: ESO News Release

Center of the Milky Way

The center of the Milky Way in infrared. Credit: NASA, ESA, and Q.D. Wang (University of Massachusetts, Amherst), Jet Propulsion Laboratory, and S. Stolovy (Spitzer Science Center/Caltech)

[/caption]

The center of the Milky Way is a pretty happenin’ place. As with most other galaxies, there is a supermassive black hole there. Ours is named Sagittarius A* (pronounced “Sagittarius A-star”, abbreviated as Sgr A*). Not only does Sgr A* try to eat anything that goes near it, the area around it is a good place for new stars to form.

Since a black hole has such a huge gravitational footprint, it tries to suck up anything that comes within its reach. All of this gravity can attract a huge amount of matter, which bunches up around the black hole and heats up. The bunched up matter is called an accretion disk, and because of friction the gas and dust heats up, emitting infrared light. Looking at the center of the Milky Way doesn’t reveal much in visible light, but radio, infrared, and X-ray telescopes can tell us a lot about the black hole lurking there.

The Milky Way’s center is 26,000 light-years from Earth, and Sgr A* is measured to be about 14 million miles across. This means that the black hole itself would easily fit inside the orbit of Mercury. How much mass is crammed inside this relatively small space? The lower mass limit of the black hole itself is calculated to be more than 40,000 Suns. However, the radio-emitting part of Sgr A* is a bit bigger, about the size of the Earth’s orbit around the Sun (93 million miles), and weighs much, much more – 4 billion Suns.

The black hole at the center is very active, spitting out flares of gas from stars it has eaten. If you want to know more, there is a whole book written just about our very own supermassive black hole.

Sgr A* isn’t the only thing at the heart of the Milky Way. There are massive star clusters, such as the Arches,Quintuplet, and the GC star cluster. The stars in these clusters are also very bright in the X-ray part of the spectrum, as winds blowing off their surfaces collide with gas emitted from other stars in the region. The clusters are slamming into clouds of molecular gas, creating more diffuse emissions in the X-ray spectrum. These collisions may result in a higher proportion of more massive stars than low-mass ones in the Galactic center, compared to a quieter neighborhood. Here’s a longer article about the image below.

The center of the Milky Way in X-ray vision. Image Credit: Chandra X-Ray Telescope

For more information on the Milky Way, listen to Episode 99 of Astronomy Cast.

Source: NASA

Supersonic Bubbles Blown By Black Holes Regulate Size

[/caption]

Apparently, black holes can walk and chew gum at the same time. Or at least they can chew up gas and dust and blow supersonic bubbles with it at the same time. Analysis into the formation of large bubbles of plasma formed by supermassive black holes reveals that creating the bubbles may stunt the growth of the black hole, as well as curb star formation in elliptical galaxies.

Many galaxies (including our own Milky Way) contain a black hole at the center, which constantly sucks in material from the surrounding regions. As the material gets close to the black hole, it bunches up, jostling with other material being sucked into the black hole and giving off energy. This process powers quasars – jets of radio and light emissions beamed into space.

A team of international astronomers imaged the elliptical galaxy M84 using the Chandra X-ray observatory. M84 has just such a black hole, and at the ends of each of its jets large cavities of ionized gas (plasma) form. The bubbles measure 13,000 light years across, and are formed about every 10 million years.

The constant cycle of bubbles being blown inside of each other, then “popping” and releasing their energy to the may slow the stream of matter that flows into the black hole.

As the outer bubble leaks its energy into the surrounding interstellar medium and disperses, the next bubble expands to take its place. Colder matter surrounding a black hole (outside the event horizon) is absorbed more readily than warmer matter. In the same way that heat rises in your house, hot gas surrounding the black hole is harder for it to capture, so the bubbles slow the growth of the black hole by siphoning off the matter and energy it could potentially feed on.

Four bubbles surrounding the M84 galaxy's black hole. The top bubble is bursting and spilling its energy away from the black hole Image Credit: A.Finoguenov et al.

.

And as if bubbles of plasma 13,000 light years across surrounding a black hole weren’t impressive enough, the transfer of thermal energy into mechanical energy creates shock waves traveling at hypersonic speeds that expand the bubbles. Try getting your standard bubble blowing apparatus to do that!

The transfer of energy into the gas contained in an elliptical galaxy could potentially limit the amount of star formation there, in addition to stunting the growth of the supermassive black hole. Stars form out of the dust and gas in the interstellar medium, and the hotter the gas and dust is, the less likely it is to clump up due to gravitational interaction with surrounding material and snowball enough to create a star.

The results are be published in the Oct. 20th issue of the Astrophysical Journal, and the pre-print article can be found on Arxiv.

Source: Space.com

NASA Satellites ‘To Serve’ in Africa Disaster Warnings

Real-time imagery of a flood-prone region near Lake Victoria will provide information in case of disaster. Image Credit: NASA

[/caption]

Outside of the scientific understanding of our Universe that comes from being a spacefaring civilization, there are many benefits to our continued presence in space. Satellites, besides their obvious benefits like research and communication, also can help keep an eye on the Earth, and are valuable tools in case of disasters such as hurricanes and floods. In other words, satellites can save lives, not to mention allow you to find your own house using Google Earth.

NASA and U.S. Agency for International Development (USAID) recently announced that they will be putting the tool of satellite monitoring in the hands of African countries, giving them previously inaccessible information related to floods, climate change, and other large-scale environmental factors.

NASA and USAID recently unveiled SERVIR-Africa (servir being the Spanish word for “to serve”) in Africa, a monitoring system that provides satellite imaging of the continent using existing United States satellite missions. The project has been in use in southern Mexico, Central America, and the Caribbean since 2005 (thus the Spanish namesake, I’m guessing).

Dan Irwin, SERVIR project director at NASA’s Marshall Space Flight Center in Huntsville, Ala said, “SERVIR-Africa will benefit from the breadth and depth of valuable NASA Earth science satellite and model analyses. Science and technology are key, but ultimately it is the combination of local knowledge along with space-based observations that makes real time monitoring of Africa’s environment effective.”

SERVIR-Africa will provide satellite imaging via the internet to the Regional Center for Mapping of Resources for Development in Nairobi, Kenya. The center is an intergovernmental organization comprised of 15 member states in eastern and southern Africa and is already a pioneer in geospatial mapping in the region.

Data acquired from NASA’s satellites will help predict whether regions of the country are flood-prone, and map regions hit by floods to aid in rescue and cleanup efforts. It’s also possible to create an early-warning tool to predict the spread of vector-borne diseases such as Rift Valley Fever, and monitor climate change on the continent to better understand impacts on many of Africa’s diverse ecosystems. Satellite information will also be used to track urbanization, create more accurate maps and more efficiently manage natural resources.

Better information on climate and flooding will likely translate to the reduction of famine due to poor crops, and will aid in the preservation of already-damaged ecosystems in Africa.

In addition to these long-term benefits, African countries will be better equipped when responding to immediate disasters. SERVIR provided real-time data that led to warnings for specific regions in Panama when heavy rainfall caused large landslides in November 2006, and currently monitors the Alantic ocean for potential hurricanes.

Source: NASA

Mars Express Maps Aurorae

If you’ve been lucky enough to ever see the aurorae (or Northern Lights) on Earth, I’m sure you’ll remember it as a spectacular sight. Fortunately, this phenomenon is not unique to the Earth: Venus, Jupiter, Saturn and Mars all have their own unique auroae, and none of them would appear to a Martian or Venusian like those of our own planet.The SPICAM instrument aboard Mars Express first observed an auroral emission event in 2004, and has since been training its UV eyes on the planet, observing a total of nine events since.

Aurorae are created by the interaction of electrically charged particles with the atmosphere of a planet. The solar wind is made up of these charged particles, and when they pass near an orbiting planet, the magnetic field channels them along its field lines (in the case of the Earth, this occurs near the poles). When the interaction occurs, light is emitted, whether it be in the infrared, visible or ultraviolet. On Earth – which has a magnetic field created by a dynamo inside of the planet – the light is visible. Saturn’s recently discovered aurorae can emit light in the infrared, and Jupiter’s aurorae are much more complicated, emitting light in the UV.

Mars doesn’t have it’s own magnetic field, though. Large stores of magnetic rocks in the crust of Mars are scattered throughout the entire planet, and the aurorae correlate with the concentrations of these rock.

NASA
A map of Mars' many magnetic fields - they're all over the place! Image Credit: NASA

SPICAM has observed nine aurorae, all near highly magnetic locations mapped by the Mars Global Surveyor Electron Reflectometer. Though there is a strong correlation between the aurorae and magnetic locations, this isn’t absolute proof that the magnetic fields in these regions are the only cause of the aurorae, but it is rather likely.

The large magnetic field structure of the Earth accelerates the charged particles, which slam into the atmosphere and spark auroral events. The dispersed nature of the magnetic fields on Mars wouldn’t do this, which leaves scientists unsure as to how exactly the aurorae are created.
“It may be that magnetic fields on Mars connect with the solar wind, providing a road for the electrons to travel along,” said Francois Leblanc, from the Service d’Aéronomie, lead author of a paper on the aurorae observed so far, titled “Observations of aurorae by SPICAM ultraviolet spectrograph on board Mars Express: Simultaneous ASPERA-3 and MARSIS measurements” which appeared in the August 2008 Journal of Geophysical research.

The elements that create the colors we see here on Earth – molecular and atomic oxygen and molecular nitrogen – are not very abundant in the thin atmosphere of Mars. SPICAM can only see in the ultraviolet, so is not equipped to detect whether the aurorae would be visible to the human eye. So will future Martian colonists looking out of their glass-domed cities have spectacular light shows every time the Sun acts up?

“We’re not sure whether the aurorae will be bright enough to be observed at visible wavelengths,” said Leblanc.

Source: ESA

The Bow Shock of Betelgeuse Revealed

Betelgeuse creates a bow shock as it travels through the interstellar medium, just like a ship traveling trough water. Image Credit: ESA

[/caption]

You may be familiar with Betelgeuse, as it is the upper-left star in the constellation Orion, forming what would be his shoulder. But this is an image of Betelgeuse that you wouldn’t see with your own eyes or even your own telescope. Images taken with the Akari infrared telescope show that as Betelgeuse travels through the interstellar medium, it creates what is called a “bow shock”.

Betelgeuse (pronounced “beetle-juice”, just like the 80’s film starring Michael Keaton) is a red supergiant 640 light-years from Earth, and is located in the winter constellation Orion. It travels through the interstellar medium at 30 km/sec (19 miles/sec). It’s not the star itself that creates the bow shock, but rather the interaction of the stellar wind emanating from Betelgeuse with the gas in the interstellar medium.

As Betelgeuse plows through the interstellar medium, the wind that it’s spewing out at 17 km/sec (11 miles/sec) warms up the surrounding gas – which originates from star-forming regions in Orion’s Belt – releasing light in the infrared. There is a rather strong current of interstellar gas in the area surrounding Betelegeuse, and just like the wave of water that is produced in front of a boat traveling over a lake, the dust and gas bunches up in front of Betelgeuse in the direction of travel.

ESA
An artist's rendering of the bow shock created by Betelgeuse. Image Credit: ESA

The bow shock is approximately 3 light-years across, and the interaction it has with the stellar wind from Betelgeuse gives astronomers a better understanding of the density of the interstellar medium in the region, which in turn can help them get a better picture of the star forming regions in Orion’s Belt that are the source of the gas.

If you turned your telescope towards the Betelgeuse star, you sadly would not be able to see the bow shock. Akari created the image using a composite of images taken at 65 (blue), 90 (green) and 140 (red) micrometers, well below what the human eye can see.

Source: ESA, Bad Astronomy

Final Resting Place of Nicolas Copernicus is Confirmed

This is what Copernicus looked like, based on forensic reconstruction from his skull. Credit: The Kronenberg Foundation

[/caption]

The rightful place of the man who put the Earth in its rightful place has now been confirmed. New DNA analysis confirms that the remains of a 70-year old man found in Frombork Cathedral in Northern Poland are those of Nicolas Copernicus. Discovered three years ago, the remains allowed archaeologists produce a facial reconstruction from the skull, creating a likeness to portraits of Copernicus. But though the placement of the grave and the age of the body corresponded to the details of Copernicus’ death, scientists couldn’t be sure that the remains were actually those of Copernicus himself.

Copernicus – often known as the “father of modern astronomy” – formulated a predictive model of the Solar System that put the Sun at the center, rather than the Earth, which was believed to be the center of the Universe up until the end 16th century. He wasn’t the first to put forward the idea of heliocentrism, though; that distinction belongs to Aristarchus of the Greek island Samos, who lived in the 3rd century BC.

Copernicus, born in 1473 in Poland, used his own observations to formulate a heliocentric model of the Solar System, which he presented in his book, De Revolutionibus Orbium Coelestium (which, translated from Latin, means “On the Revolutions of Celestial Spheres”). Copernicus didn’t publish the book until 1543, the year of his death, out of fear of religious persecution. His model of the Solar System influenced Kepler to formulate his laws of planetary motion, and Galileo suffered much persecution for insisting that Copernicus was right.

The DNA analysis of two strands of hair from a book that Copernicus is known to have owned – Calendarium Romanum Magnum, by Johannes Stoeffler – match the DNA of a tooth and femur bone taken from the remains at Frombork. The book, along with a number of Copernicus’ other tomes, was taken to Sweden during the 17th century Polish-Swedish wars, and is now located at Uppsala University.

Jerzy Gasowski of the Pultusk School of Humanities in Poland was the first to find the remains in 2005, using radar to search underneath the floor of the cathedral where Copernicus was thought to have been entombed. A skull sent for forensic analysis generated the image above, but there was no DNA evidence to corroborate the find until now.

Source: BBC, Discovery

Dense Exoplanet Creates Classification Calamity

Jupiter and Corot-exo-3b are about the same size, but Corot-exo-3b is much, much more massive. Image Credit: ESA

[/caption]

Given all the fervor over the definition of Pluto (planet? dwarf planet? snowball?), let’s hope the debate over the discovery of a planet that lies in an equally hazy area of classification is a little calmer. The COROT satellite recently discovered an extrasolar planet named Corot-exo-3b. It’s quite a curiosity as far as exoplanets are concerned, and its characteristics – such as a density twice that of lead – may force astronomers to rethink the distinction between massive planets and low-mass brown dwarfs.

Corot-exo-3b is orbiting close to its star, and takes 4 days and 6 hours to complete one orbit. For comparison, Mercury orbits the Sun every 88 days. It’s also roughly the same size as Jupiter, but far more dense, totaling a whopping 21.6 times Jupiter’s mass. This makes classification of the object a bit tricky.

“COROT-exo-3b might turn out to be a rare object found by sheer luck. But it might just be a member of a new-found family of very massive planets that encircle stars more massive than our Sun. We’re now beginning to think that the more massive the star, the more massive the planet,” said Dr Francois Bouchy, from the Institut d’Astrophysique de Paris (IAP), a member of the team that discovered the object.

Because of its extreme density, Corot-exo-3b lies in the shady area of classification between planet and brown dwarf. Brown dwarfs are massive bodies (between about 13 and 80 times the mass of Jupiter) that don’t make the cut for fusing hydrogen in their cores – and thus don’t shine in optical wavelengths – yet are much more massive that what is normally classified as a planet. Brown dwarfs can fuse deuterium even at lower masses (above 13 Jupiter masses), and lithium in masses above 65 that of Jupiter.

Planets generally form out of a disk of dust and gas that surrounds the early star they orbit, and then are pulled in closer due to friction with the debris that lies in their orbit. The close orbit and very short orbital period of Corot-exo-3b was likely caused by this effect.

The COROT satellite initially discovered the planet by measuring the change in the brightness of the host star as the planet passes in front of it. As the planet moves in front of the star, it slightly darkens the visible light, and then the star brightens once again as the planet moves behind it. The bigger the planet, the more it will darken the light coming from the star. The pull of a planet as it moves around its star can also redshift or blueshift the light coming from the star, and this shift can give information as to the mass of the planet.

Follow-up observations of the planet were done by a collaboration of scientists from around the world, led by Dr. Magali Deleuil from the Laboratoire d’Astrophysique de Marseille (LAM). Their results will be published in the journal Astronomy and Astrophysics.

Author’s note: Due to technical errors in the original posting of this article, the original was removed from UT, but the link may still show up in your feed reader. Be assured that this corrected version is the real, much more accurate one.

Source: ESA