The Planet Mars

The Planet Mars. Image credit: NASA

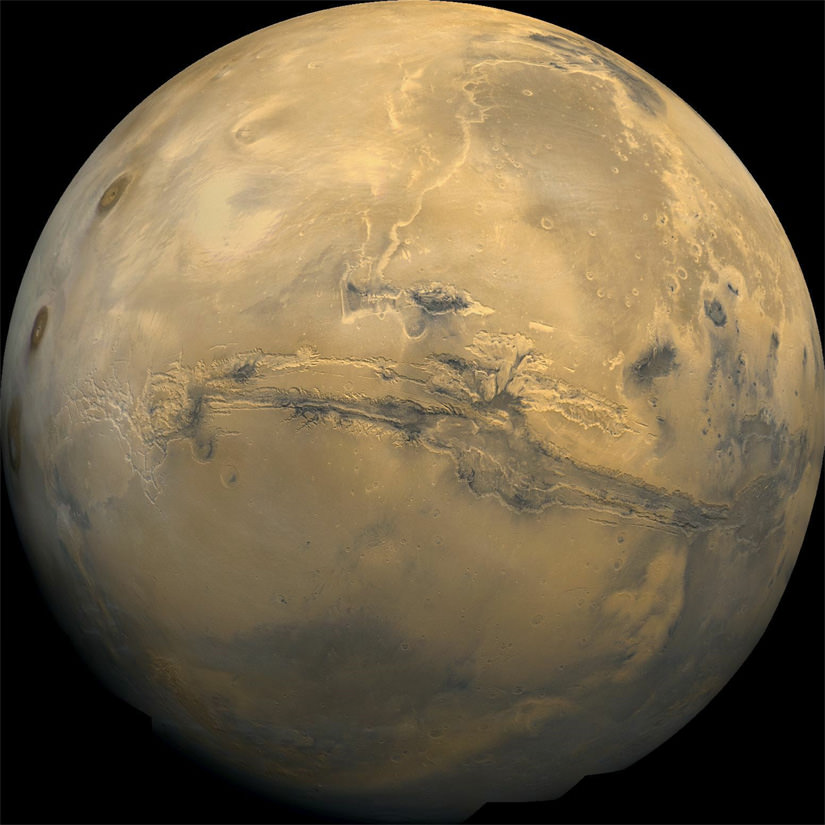
Mars, otherwise known as the “Red Planet”, is the fourth planet of our Solar System and the second smallest (after Mercury). Named after the Roman God of war, its nickname comes from its reddish appearance, which has to do with the amount of iron oxide prevalent on its surface. Every couple of years, when Mars is at opposition to Earth (i.e. when the planet is closest to us), it is most visible in the night sky.

Because of this, humans have been observing it for millennia, and its appearance in the heavens has played a large role in the mythology and astrological systems of many cultures. And in the modern era, it has been a veritable treasure trove of scientific discoveries, which have informed our understanding of our Solar System and its history.

Size, Mass and Orbit:

Mars has a radius of approximately 3,396 km at its equator, and 3,376 km at its polar regions – which is the equivalent of roughly 0.53 Earths. While it is roughly half the size of Earth, it’s mass – 6.4185 x 10²³ kg – is only 0.151 that of Earth’s. It’s axial tilt is very similar to Earth’s, being inclined 25.19° to its orbital plane (Earth’s axial tilt is just over 23°), which means Mars also experiences seasons.

At its greatest distance from the Sun (aphelion), Mars orbits at a distance of 1.666 AUs, or 249.2 million km. At perihelion, when it is closest to the Sun, it orbits at a distance of 1.3814 AUs, or 206.7 million km. At this distance, Mars takes 686.971 Earth days, the equivalent of 1.88 Earth years, to complete a rotation of the Sun. In Martian days (aka. Sols, which are equal to one day and 40 Earth minutes), a Martian year is 668.5991 Sols.

Composition and Surface Features:

With a mean density of 3.93 g/cm³, Mars is less dense than Earth, and has about 15% of Earth’s volume and 11% of Earth’s mass. The red-orange appearance of the Martian surface is caused by iron oxide, more commonly known as hematite (or rust). The presence of other minerals in the surface dust allow for other common surface colors, including golden, brown, tan, green, and others.

As a terrestrial planet, Mars is rich in minerals containing silicon and oxygen, metals, and other elements that typically make up rocky planets. The soil is slightly alkaline and contains elements such as magnesium, sodium, potassium, and chlorine. Experiments performed on soil samples also show that it has a basic pH of 7.7.

Although liquid water cannot exist on Mars’ surface, owing to its thin atmosphere, large concentrations of ice water exist within the polar ice caps – Planum Boreum and Planum Australe. In addition, a permafrost mantle stretches from the pole to latitudes of about 60°, meaning that water exists beneath much of the Martian surface in the form of ice water. Radar data and soil samples have confirmed the presence of shallow subsurface water at the middle latitudes as well.

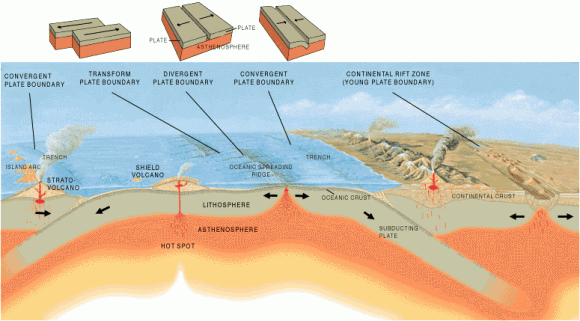
Like Earth, Mars is differentiated into a dense metallic core surrounded by a silicate mantle. This core is composed of iron sulfide, and thought to be twice as rich in lighter elements than Earth’s core. The average thickness of the crust is about 50 km (31 mi), with a maximum thickness of 125 km (78 mi). Relative to the sizes of the two planets, Earth’s crust (averaging 40 km or 25 mi) is only one third as thick.

Artist rendition of the formation of rocky bodies in the solar system - how they form and differentiate and evolve into terrestrial planets. Image credit: NASA/JPL-Caltech
Artist rendition of the formation of rocky bodies in the solar system – how they form and differentiate and evolve into terrestrial planets. Image credit: NASA/JPL-Caltech

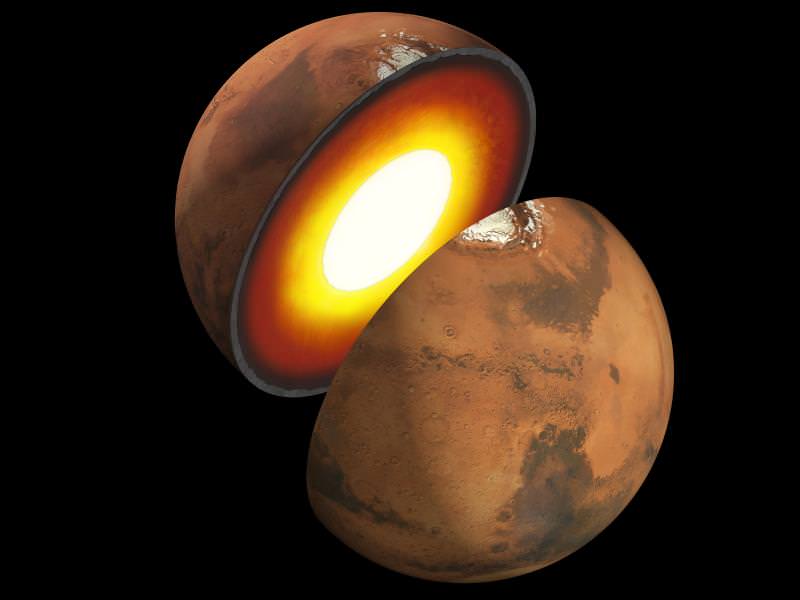
Current models of its interior imply that the core region measures between 1,700 – 1850 kilometers (1,056 – 1150 mi) in radius, consisting primarily of iron and nickel with about 16–17% sulfur. Due to its smaller size and mass, the force of gravity on the surface of Mars is only 37.6% of that on Earth. An object falling on Mars falls at 3.711 m/s², compared to 9.8 m/s² on Earth.

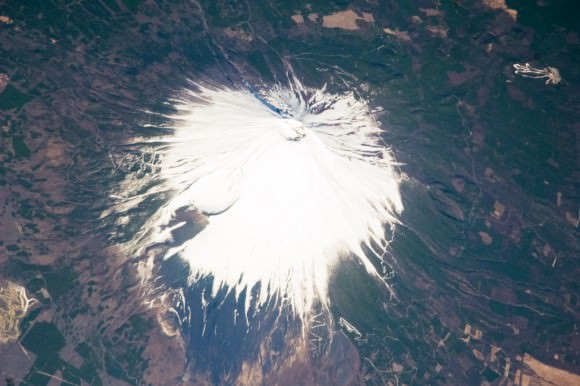
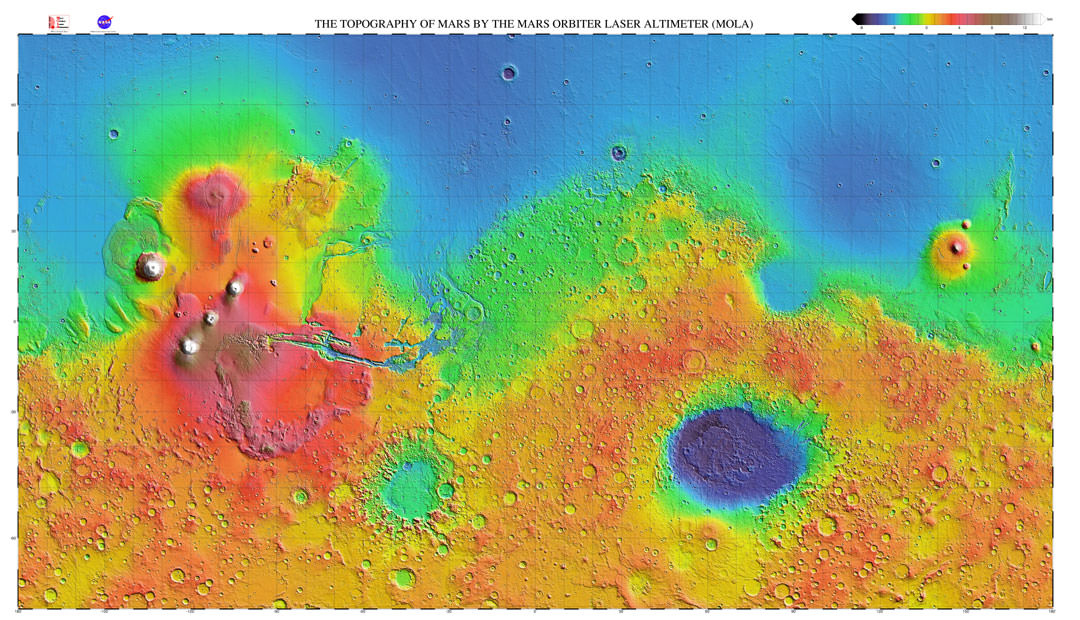
The surface of Mars is dry and dusty, with many similar geological features to Earth. It has mountain ranges and sandy plains, and even some of the largest sand dunes in the Solar System. It also has the largest mountain in the Solar System, the shield volcano Olympus Mons, and the longest, deepest chasm in the Solar System: Valles Marineris.

The surface of Mars has also been pounded by impact craters, many of which date back billions of years. These craters are so well preserved because of the slow rate of erosion that happens on Mars. Hellas Planitia, also called the Hellas impact basin, is the largest crater on Mars. Its circumference is approximately 2,300 kilometers, and it is nine kilometers deep.

Mars also has discernible gullies and channels on its surface, and many scientists believe that liquid water used to flow through them. By comparing them to similar features on Earth, it is believed these were were at least partially formed by water erosion.  Some of these channels are quite large, reaching 2,000 kilometers in length and 100 kilometers in width.

Mars’ Moons:

Mars has two small satellites, Phobos and Deimos. These moons were discovered in 1877 by the astronomer Asaph Hall and were named after mythological characters. In keeping with the tradition of deriving names from classical mythology, Phobos and Deimos are the sons of Ares – the Greek god of war that inspired the Roman god Mars. Phobos represents fear while Deimos stands for terror or dread.

Phobos and Deimos, photographed here by the Mars Reconnaissance Orbiter, are tiny, irregularly-shaped moons that are probably strays from the main asteroid belt. Credit: NASA - See more at: http://astrobob.areavoices.com/2013/07/05/rovers-capture-loony-moons-and-blue-sunsets-on-mars/#sthash.eMDpTVPT.dpuf
Phobos and Deimos, photographed here by the Mars Reconnaissance Orbiter, are tiny, irregularly-shaped moons that are probably strays from the main asteroid belt. Credit: NASA

Phobos measures about 22 km (14 mi) in diameter, and orbits Mars at a distance of 9234.42 km when it is at periapsis (closest to Mars) and 9517.58 km when it is at apoapsis (farthest). At this distance, Phobos is below synchronous altitude, which means that it takes only 7 hours to orbit Mars and is gradually getting closer to the planet. Scientists estimate that in 10 to 50 million years, Phobos could crash into Mars’ surface or break up into a ring structure around the planet.

Meanwhile, Deimos measures about 12 km (7.5 mi) and orbits the planet at a distance of 23455.5 km (periapsis) and 23470.9 km (apoapsis). It has a longer orbital period, taking 1.26 days to complete a full rotation around the planet. Mars may have additional moons that are smaller than 50- 100 meters (160 to 330 ft) in diameter, and a dust ring is predicted between Phobos and Deimos.

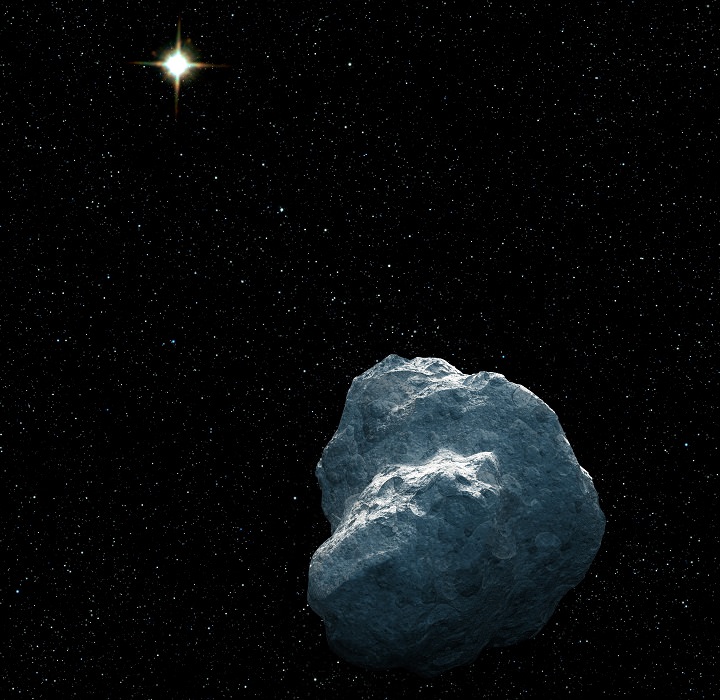
Scientists believe that these two satellites were once asteroids that were captured by the planet’s gravity. The low albedo and the carboncaceous chondrite composition of both moons – which is similar to asteroids – supports this theory, and Phobos’ unstable orbit would seem to suggest a recent capture. However, both moons have circular orbits near the equator, which is unusual for captured bodies.

Another possibility is that the two moons formed from accredit material from Mars early in its history. However, if this were true, their compositions would be similar to Mars itself, rather than similar to asteroids. A third possibility is that a body impacted the Martian surface, who’s material was ejected into space and re-accreted to form the two moons, similar to what is believed to have formed the Earth’s Moon.

Atmosphere and Climate:

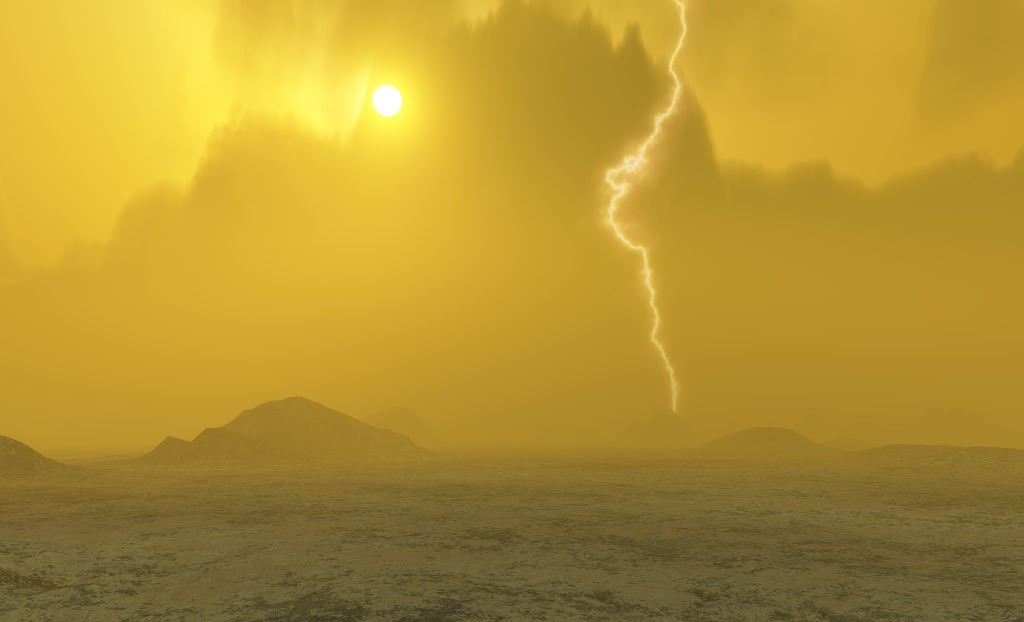
Planet Mars has a very thin atmosphere which is composed of 96% carbon dioxide, 1.93% argon and 1.89% nitrogen along with traces of oxygen and water. The atmosphere is quite dusty, containing particulates that measure 1.5 micrometers in diameter, which is what gives the Martian sky a tawny color when seen from the surface. Mars’ atmospheric pressure ranges from 0.4 – 0.87 kPa, which is equivalent to about 1% of Earth’s at sea level.

Because of its thin atmosphere, and its greater distance from the Sun, the surface temperature of Mars is much colder than what we experience here on Earth. The planet’s average temperature is -46 °C (-51 °F), with a low of -143 °C (-225.4 °F) during the winter at the poles, and a high of 35 °C (95 °F) during summer and midday at the equator.

The planet also experiences dust storms, which can turn into what resembles small tornadoes. Larger dust storms occur when the dust is blown into the atmosphere and heats up from the Sun. The warmer dust filled air rises and the winds get stronger, creating storms that can measure up to thousands of kilometers in width and last for months at a time. When they get this large, they can actually block most of the surface from view.

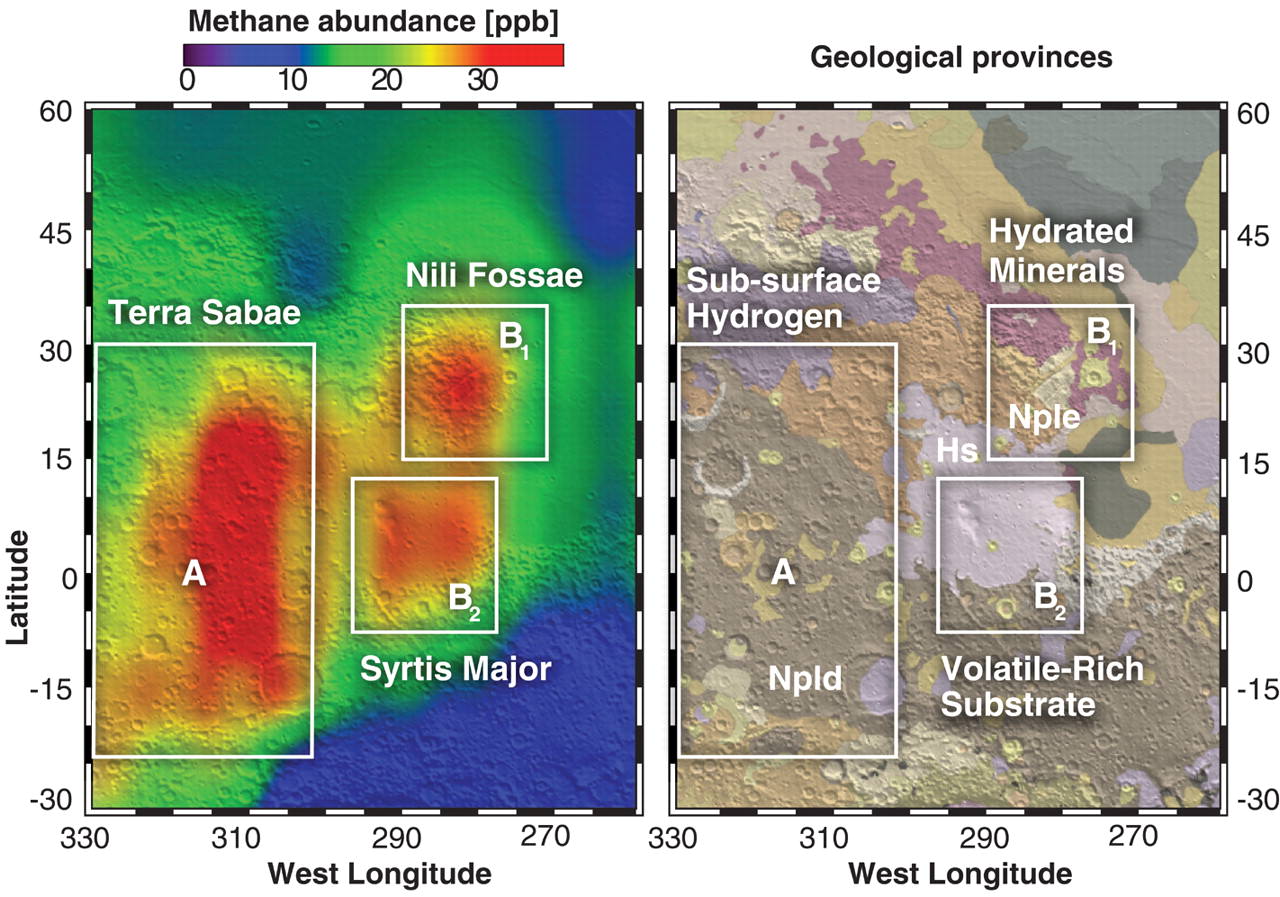
Trace amounts of methane have also been detected in the Martian atmosphere, with an estimated concentration of about 30 parts per billion (ppb). It occurs in extended plumes, and the profiles imply that the methane was released from specific regions – the first of which is located between Isidis and Utopia Planitia (30°N 260°W) and the second in Arabia Terra (0°N 310°W).

Mars, as it appears today, Credit: NASA
Artist’s concept of what Mars atmosphere appears like today. Credit: NASA

It is estimated that Mars must produce 270 tonnes of methane per year. Once released into the atmosphere, the methane can only exist for a limited period of time (0.6 – 4 years) before it is destroyed. Its presence despite this short lifetime indicates that an active source of the gas must be present.

Several possible sources have been suggested for the presence of this methane, ranging from volcanic activity, cometary impacts, and the presence of methanogenic microbial life forms beneath the surface. Methane could also be produced by a non-biological process called serpentinization involving water, carbon dioxide, and the mineral olivine, which is known to be common on Mars.

The Curiosity rover has made several measurements for methane since its deployment to the Martian surface in August of 2012. The first measurements, which were made using its Tunable Laser Spectrometer (TLS), indicated that there were less than 5 ppb at its landing site (Bradbury Landing). A subsequent measurement performed on September 13th detected no discernible traces.

On December 16th, 2014, NASA reported that the Curiosity rover had detected a “tenfold spike”, likely localized, in the amount of methane in the Martian atmosphere. Samples measurements taken between late 2013 and early 2014 showed an increase of 7 ppb; whereas before and after that, readings averaged around one-tenth that level.

Regions where methane appears notably localized in Northern Summer (A, B1, B2), andtheir relationship to mineralogical and geo-morphological domains. (A.) Observations of methane near the Syrtis Major volcanic district. (B.) Geologic map of Greeley and Guest (41) superimposed on the topographic shaded-relief from MOLA (42). The most ancient terrain (Npld, Nple) is Noachian in age (~3.6 - 4.5 billion years old, when Mars was wet), and is overlain by volcanic deposits from Syrtis Major of Hesperian (Hs) age (~3.1 - 3.6 billion yrs old). (Credit: Mumma, et al., 2009, Figure 3)
Regions where methane appears notably localized in Northern Summer and their relationship to mineralogical and geo-morphological domains. Credit: Mumma, et al., 2009.

Ammonia was also tentatively detected on Mars by the Mars Express satellite, but with a relatively short lifetime. It is not clear what produced it, but volcanic activity has been suggested as a possible source.

Historical Observations:

Earth astronomers have a long history of observing the “Red Planet”, both with the naked eye and with instrumentation. The first recorded mentions of Mars as a wandering object in the night sky were made by Ancient Egyptian astronomers, who by 1534 BCE were familiar with the planet’s “retrograde motion”. In essence, they deduced that the planet, though it appeared to be a bright star, moved differently than the other stars, and that it would occasionally slow down and reverse course before returning to its original course.

By the time of the Neo-Babylonian Empire (626 BCE – 539 BCE), astronomers were making regular records of the position of the planets, systematic observations of their behavior and even arithmetic methods for predicted the positions of the planets. For Mars, this included detailed accounts of its orbital period and its passage through the zodiac.

By classical antiquity, the Greeks were making additional observations on Mars’ behavior that helped them to understand its position in the Solar System. In the 4th century BCE, Aristotle noted that Mars disappeared behind the Moon during an occultation, which indicated it was farther away than the Moon.

Figure of the heavenly bodies - Illuminated illustration of the Ptolemaic geocentric conception of the Universe by Portuguese cosmographer and cartographer Bartolomeu Velho (?-1568). From his work Cosmographia, made in France, 1568 (Bibilotèque nationale de France, Paris).
Illustration of the Ptolemaic geocentric conception of the Universe by Portuguese cosmographer and cartographer Bartolomeu Velho from his work Cosmographia (1568). Credit: Bibilotèque nationale de France, Paris.

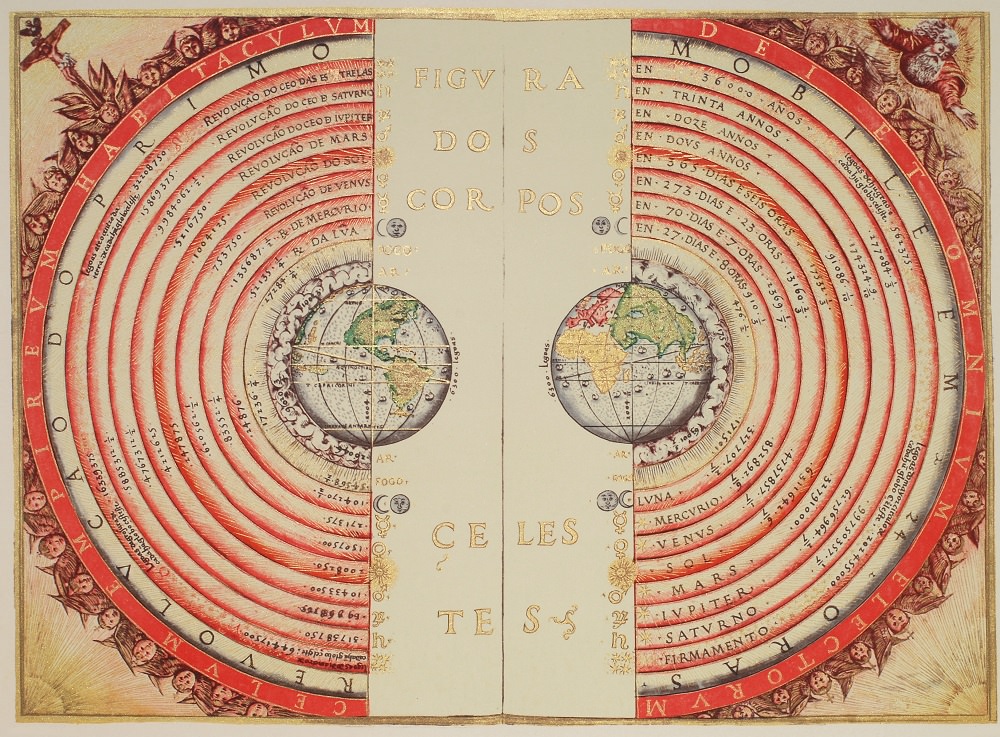
Ptolemy, a Greek-Egyptian astronomer of Alexandria (90 CE – ca. 168 CE), constructed a model of the universe in which he attempted to resolve the problems of the orbital motion of Mars and other bodies. In his multi-volume collection Almagest, he proposed that the motions of heavenly bodies were governed by “wheels within wheels”, which attempted to explain retrograde motion.  This became the authoritative treatise on Western astronomy for the next fourteen centuries.

Literature from ancient China confirms that Mars was known by Chinese astronomers by at least the fourth century BCE. In the fifth century CE, the Indian astronomical text Surya Siddhanta estimated the diameter of Mars. In the East Asian cultures, Mars is traditionally referred to as the “fire star”, based on the Five elements.

Modern Observations:

The Ptolemaic model of the Solar System remained canon for western astronomers until the Scientific Revolution (16th to 18th century CE). Thanks to Copernicus’ heliocentric model, and Galileo’s use of the telescope, Mars proper position relative to Earth and the Sun began to become known. The invention of the telescope also allowed astronomers to measure the diurnal parallax of Mars and determine its distance.

This was first performed by Giovanni Domenico Cassini in 1672, but his measurements were hampered by the low quality of his instruments. During the 17th century, Tycho Brahe also employed the diurnal parallax method, and his observations were measured later by Johannes Kepler. During this time, Dutch astronomer Christiaan Huygens also drew the first map of Mars which included terrain features.

Map of Mars, by Giovanni Schiaparelli (), showing the Martian "canals". Credit: Public Domain
Map of Mars by Giovanni Schiaparelli (1877) that shows the famous Martian “canals”. Credit: Wikipedia Commons

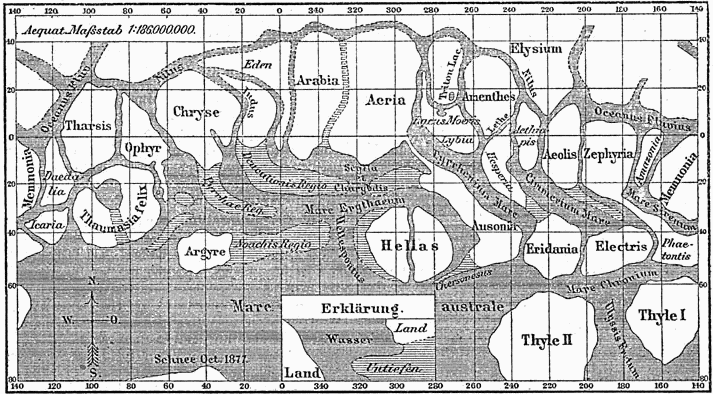
By the 19th century, the resolution of telescopes improved to the point that surface features on Mars could be identified. This led Italian astronomer Giovanni Schiaparelli to produce the first detailed map of Mars after viewing it at opposition on September 5th, 1877. These maps notably contained features he called canali – a series of long, straight lines on the surface of Mars – which he named after famous rivers on Earth. These were later revealed to be an optical illusion, but not before spawning a wave of interest in Mars’ “canals”.

In 1894, Percival Lowell – inspired by Schiaparelli’s map – founded an observatory which boasted two of the largest telescopes of the time – 30 and 45 cm (12 and 18 inch). Lowell published several books on Mars and life on the planet, which had a great influence on the public, and the canals were also observed by other astronomers, like Henri Joseph Perrotin and Louis Thollon of Nice.

Seasonal changes like the diminishing of the polar caps and the dark areas formed during Martian summer, in combination with the canals, led to speculation about life on Mars. The term “Martian” became synonymous with extra-terrestrial for quite some time, though telescopes never reached the resolution needed to provide any proof. Even in the 1960s, articles were published on Martian biology, putting aside explanations other than life for the seasonal changes on Mars.

Exploration of Mars:

With the advent of the space age, probes and landers began to be sent to Mars by the late 20th century. These have yielded a wealth of information on the geology, natural history, and even the habitability of the planet, and increased our knowledge of the planet immensely. And while modern missions to Mars have dispelled the notions of there being a Martian civilization, they have indicated that life may have existed there at one time.

Efforts to explore Mars began in earnest in the 1960s. Between 1960 and 1969, the Soviets launched nine unmanned spacecraft towards Mars, but all failed to reach the planet. In 1964, NASA began launching Mariner probes towards Mars. This began with Mariner 3 and Mariner 4, two unmanned probes that were designed to carry out the first flybys of Mars. The Mariner 3 mission failed during deployment, but Mariner 4 – which launched three weeks later – successfully made the 7½-month long voyage to Mars.

Mariner 4 captured the first close-up photographs of another planet (showing impact craters) and provided accurate data about the surface atmospheric pressure, and noted the absence of a Martian magnetic field and radiation belt. NASA continued the Mariner program with another pair of flyby probes – Mariner 6 and 7 – which reached the planet in 1969.

During the 1970s, the Soviets and the US competed to see who could place the first artificial satellite in orbit of Mars. The Soviet program (M-71) involved three spacecraft – Cosmos 419 (Mars 1971C), Mars 2 and Mars 3. The first, a heavy orbiter, failed during launch. The subsequent missions, Mars 2 and Mars 3, were combinations of an orbiter and a lander, and would be the first rovers to land on a body other than the Moon.

They were successfully launched in mid-May 1971 and reached Mars about seven months later. On November 27th, 1971, the lander of Mars 2 crash-landed due to an on-board computer malfunction and became the first man-made object to reach the surface of Mars. In December 2nd, 1971, the Mars 3 lander became the first spacecraft to achieve a soft landing, but its transmission was interrupted after 14.5 seconds.

Mariner 9 view of the Noctis Labyrinthus "labyrinth" at the western end of Valles Marineris. Credit: NASA
Mariner 9 view of the Noctis Labyrinthus “labyrinth” at the western end of Valles Marineris. Credit: NASA

Meanwhile, NASA continued with the Mariner program, and scheduled Mariner 8 and 9 for launch in 1971. Mariner 8 also suffered a technical failure during launch and crashed into the Atlantic Ocean. But the Mariner 9 mission managed to not only make it to Mars, but became the first spacecraft to successfully establish orbit around it. Along with Mars 2 and Mars 3, the mission coincided with a planet-wide dust storm. During this time, the Mariner 9 probe managed to rendezvous and take some photos of Phobos.

When the storm cleared sufficiently, Mariner 9 took photos that were the first to offer more detailed evidence that liquid water might have flowed on the surface at one time. Nix Olympica, which was one of only a few features that could be seen during the planetary duststorm, was also determined to be the highest mountain on any planet in the entire Solar System, leading to its reclassification as Olympus Mons.

In 1973, the Soviet Union sent four more probes to Mars: the Mars 4 and Mars 5 orbiters and the Mars 6 and Mars 7 fly-by/lander combinations. All missions except Mars 7 sent back data, with Mars 5 being most successful. Mars 5 transmitted 60 images before a loss of pressurization in the transmitter housing ended the mission.

By 1975, NASA launched Viking 1 and 2 to Mars, which consisted of two orbiters and two landers. The primary scientific objectives of the lander mission were to search for biosignatures and observe the meteorologic, seismic and magnetic properties of Mars. The results of the biological experiments on board the Viking landers were inconclusive, but a reanalysis of the Viking data published in 2012 suggested signs of microbial life on Mars.

Image from Mars taken by the Viking 2 lander. Credit: NASA

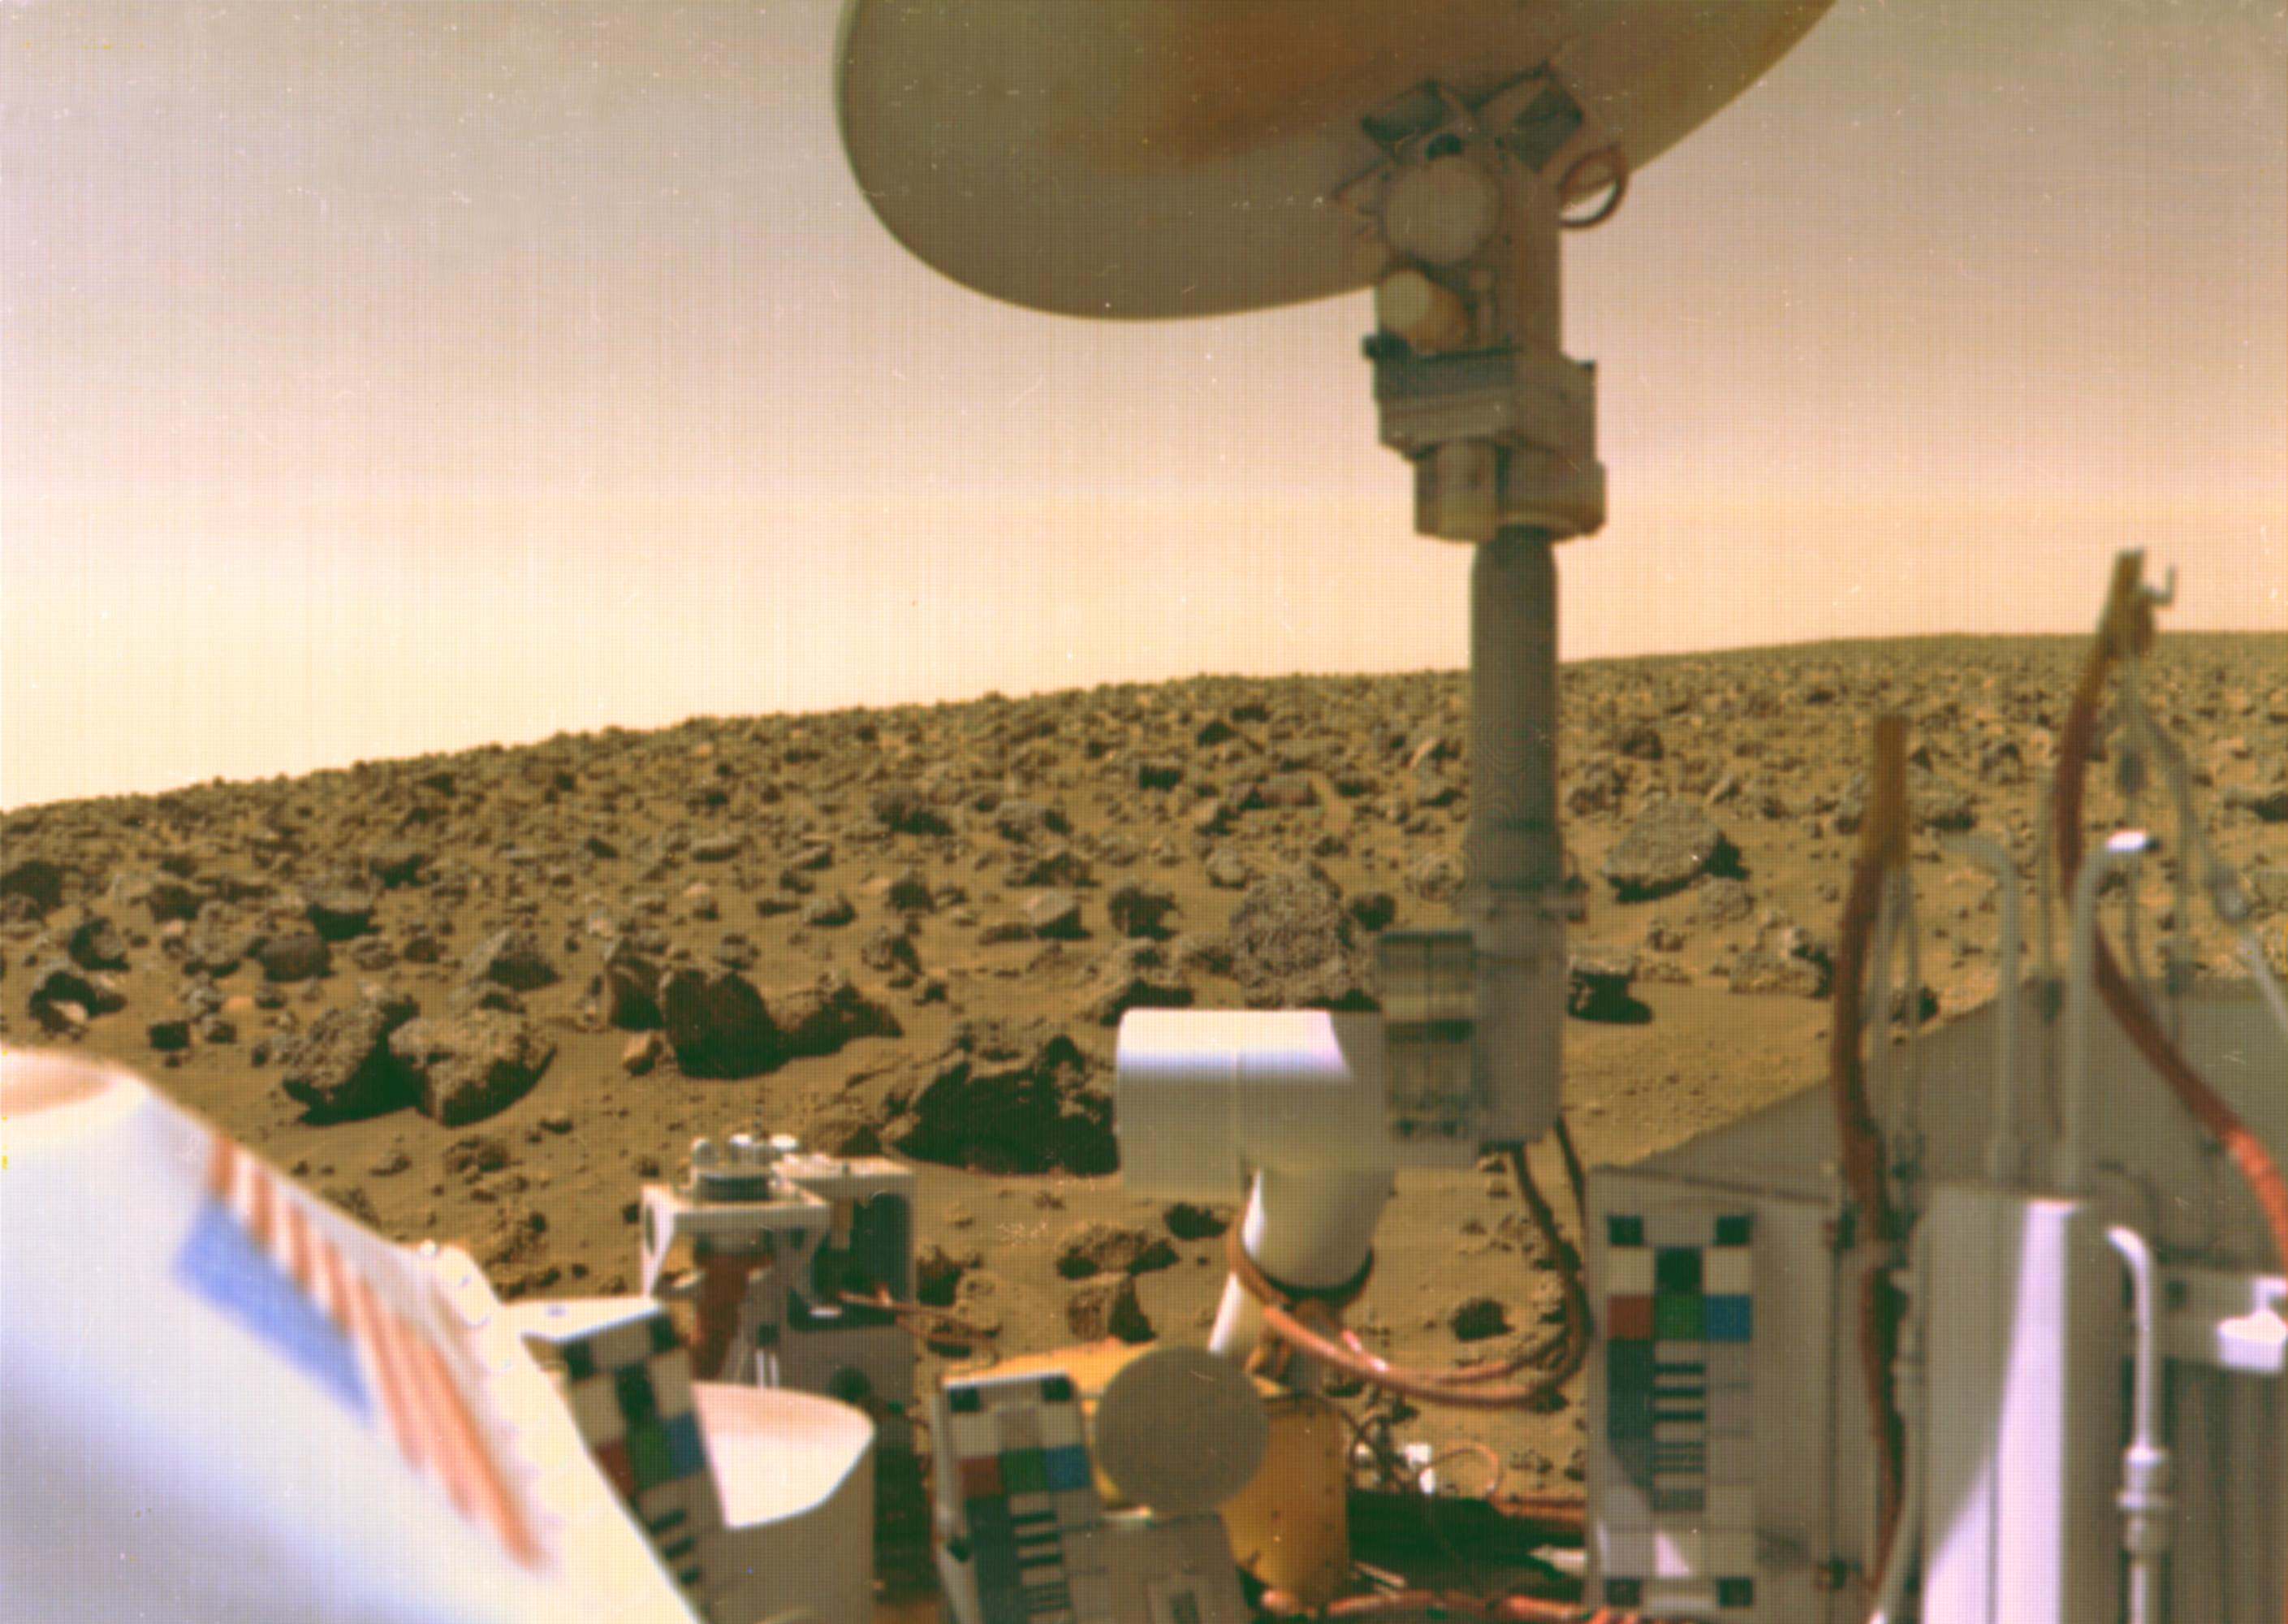
The Viking orbiters revealed further data that water once existed on Mars, indicating that large floods carved deep valleys, eroded grooves into bedrock, and traveled thousands of kilometers. In addition, areas of branched streams in the southern hemisphere, suggest that surface once experienced rainfall.

Mars was not explored again until the 1990’s, at which time, NASA commenced the Mars Pathfinder mission – which consisted of a spacecraft that landed a base station with a roving probe (Sojourner) on the surface. The mission landed on Mars on July 4th, 1997, and provided a proof-of-concept for various technologies that was would be used by later missions, such as an airbag landing system and automated obstacle avoidance.

This was followed by the Mars Global Surveyor (MGS), a mapping satellite that reached Mars on September 12th, 1997, and began its mission on March 1999. From a low-altitude, nearly polar orbit, it observed Mars over the course of one complete Martian year (nearly two Earth years) and studied the entire Martian surface, atmosphere, and interior, returning more data about the planet than all previous Mars missions combined.

Among key scientific findings, the MGS took pictures of gullies and debris flows that suggest there may be current sources of liquid water, similar to an aquifer, at or near the surface of the planet. Magnetometer readings showed that the planet’s magnetic field is not globally generated in the planet’s core, but is localized in particular areas of the crust.

The spacecraft’s laser altimeter also gave scientists their first 3-D views of Mars’ north polar ice cap. On November 5th, 2006, MGS lost contact with Earth, and all efforts by NASA to restore communication ceased by January 28th, 2007.

The North Polar Basin is the large blue low-lying area at the northern end of this topographical map of Mars. Its elliptical shape is partially obscured by volcanic eruptions (red, center left). Credit: NASA/JPL/USGS

In 2001, NASA’s Mars Odyssey orbiter arrived at Mars. Its mission was to use spectrometers and imagers to hunt for evidence of past or present water and volcanic activity on Mars. In 2002, it was announced that the probe had detected large amounts of hydrogen, indicating that there are vast deposits of water ice in the upper three meters of Mars’ soil within 60° latitude of the south pole.

On June 2, 2003, the European Space Agency (ESA) launched the Mars Express spacecraft, which consisted of the Mars Express Orbiter and the lander Beagle 2. The orbiter entered Martian orbit on December 25th, 2003, and Beagle 2 entered Mars’ atmosphere on the same day. Before the ESA lost contact with the probe, the Mars Express Orbiter confirmed the presence of water ice and carbon dioxide ice at the planet’s south pole, while NASA had previously confirmed their presence at the north pole of Mars.

In 2003, NASA also commenced the Mars Exploration Rover Mission (MER), an ongoing robotic space mission involving two rovers – Spirit and Opportunity – exploring the planet Mars. The mission’s scientific objective was to search for and characterize a wide range of rocks and soils that hold clues to past water activity on Mars.

The Mars Reconnaissance Orbiter (MRO) is a multipurpose spacecraft designed to conduct reconnaissance and exploration of Mars from orbit. The MRO launched on August 12th, 2005, and attained Martian orbit on March 10th, 2006. The MRO contains a host of scientific instruments designed to detect water, ice, and minerals on and below the surface.

Mosaic self-portrait of Curiosity at the John Klein outcrop on Feb. 3, 2013 (NASA/JPL-Caltech/MSSS)
Mosaic self-portrait of Curiosity at the John Klein outcrop on Feb. 3, 2013. Credit: NASA/JPL-Caltech/MSSS

Additionally, the MRO is paving the way for upcoming generations of spacecraft through daily monitoring of Martian weather and surface conditions, searching for future landing sites, and testing a new telecommunications system that will speed up communications between Earth and Mars.

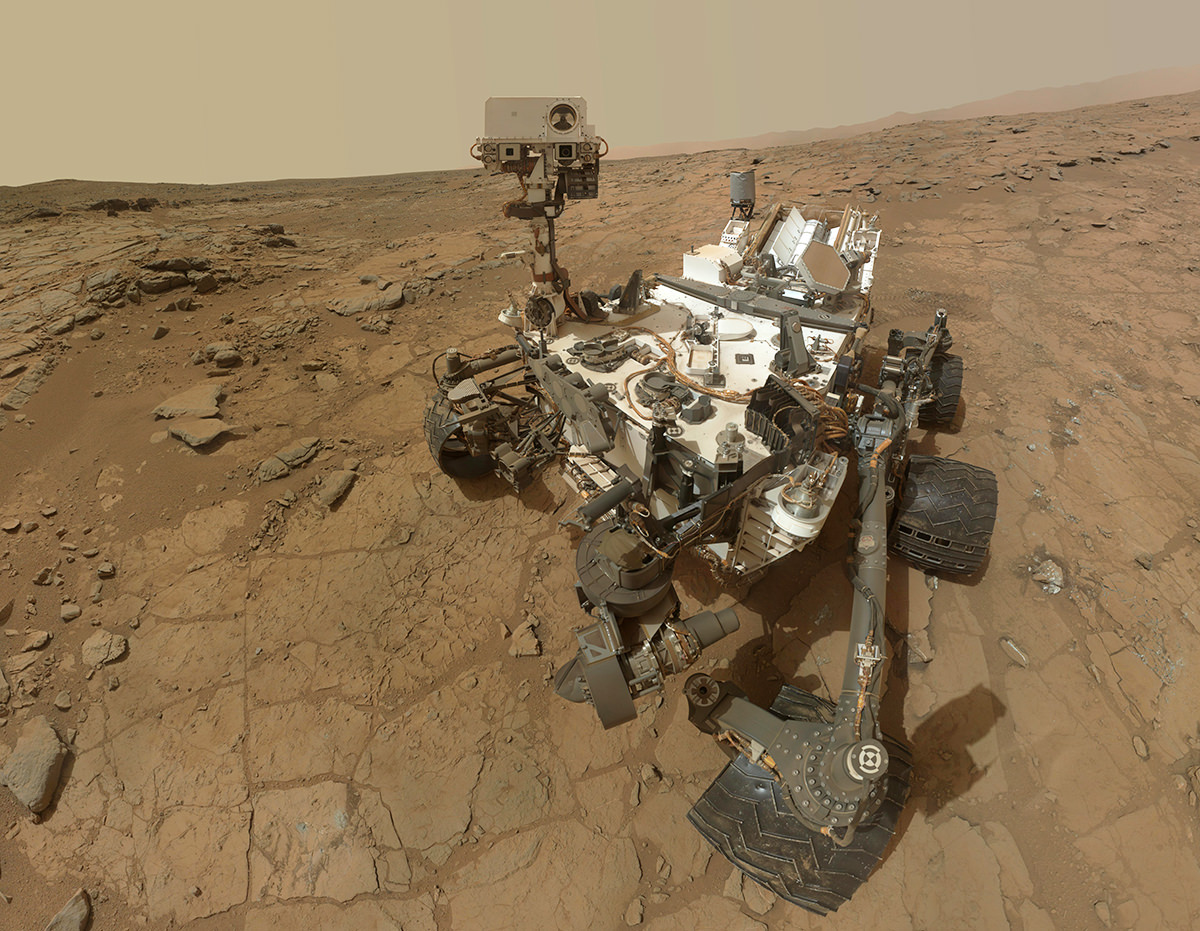
The NASA Mars Science Laboratory (MSL) mission and its Curiosity rover landed on Mars in the Gale Crater (at a landing site named “Bradbury Landing”) on August 6th, 2012. The rover carries instruments designed to look for past or present conditions relevant to the habitability of Mars, and has made numerous discoveries about atmospheric and surface conditions on Mars, as well as the detection of organic particles.

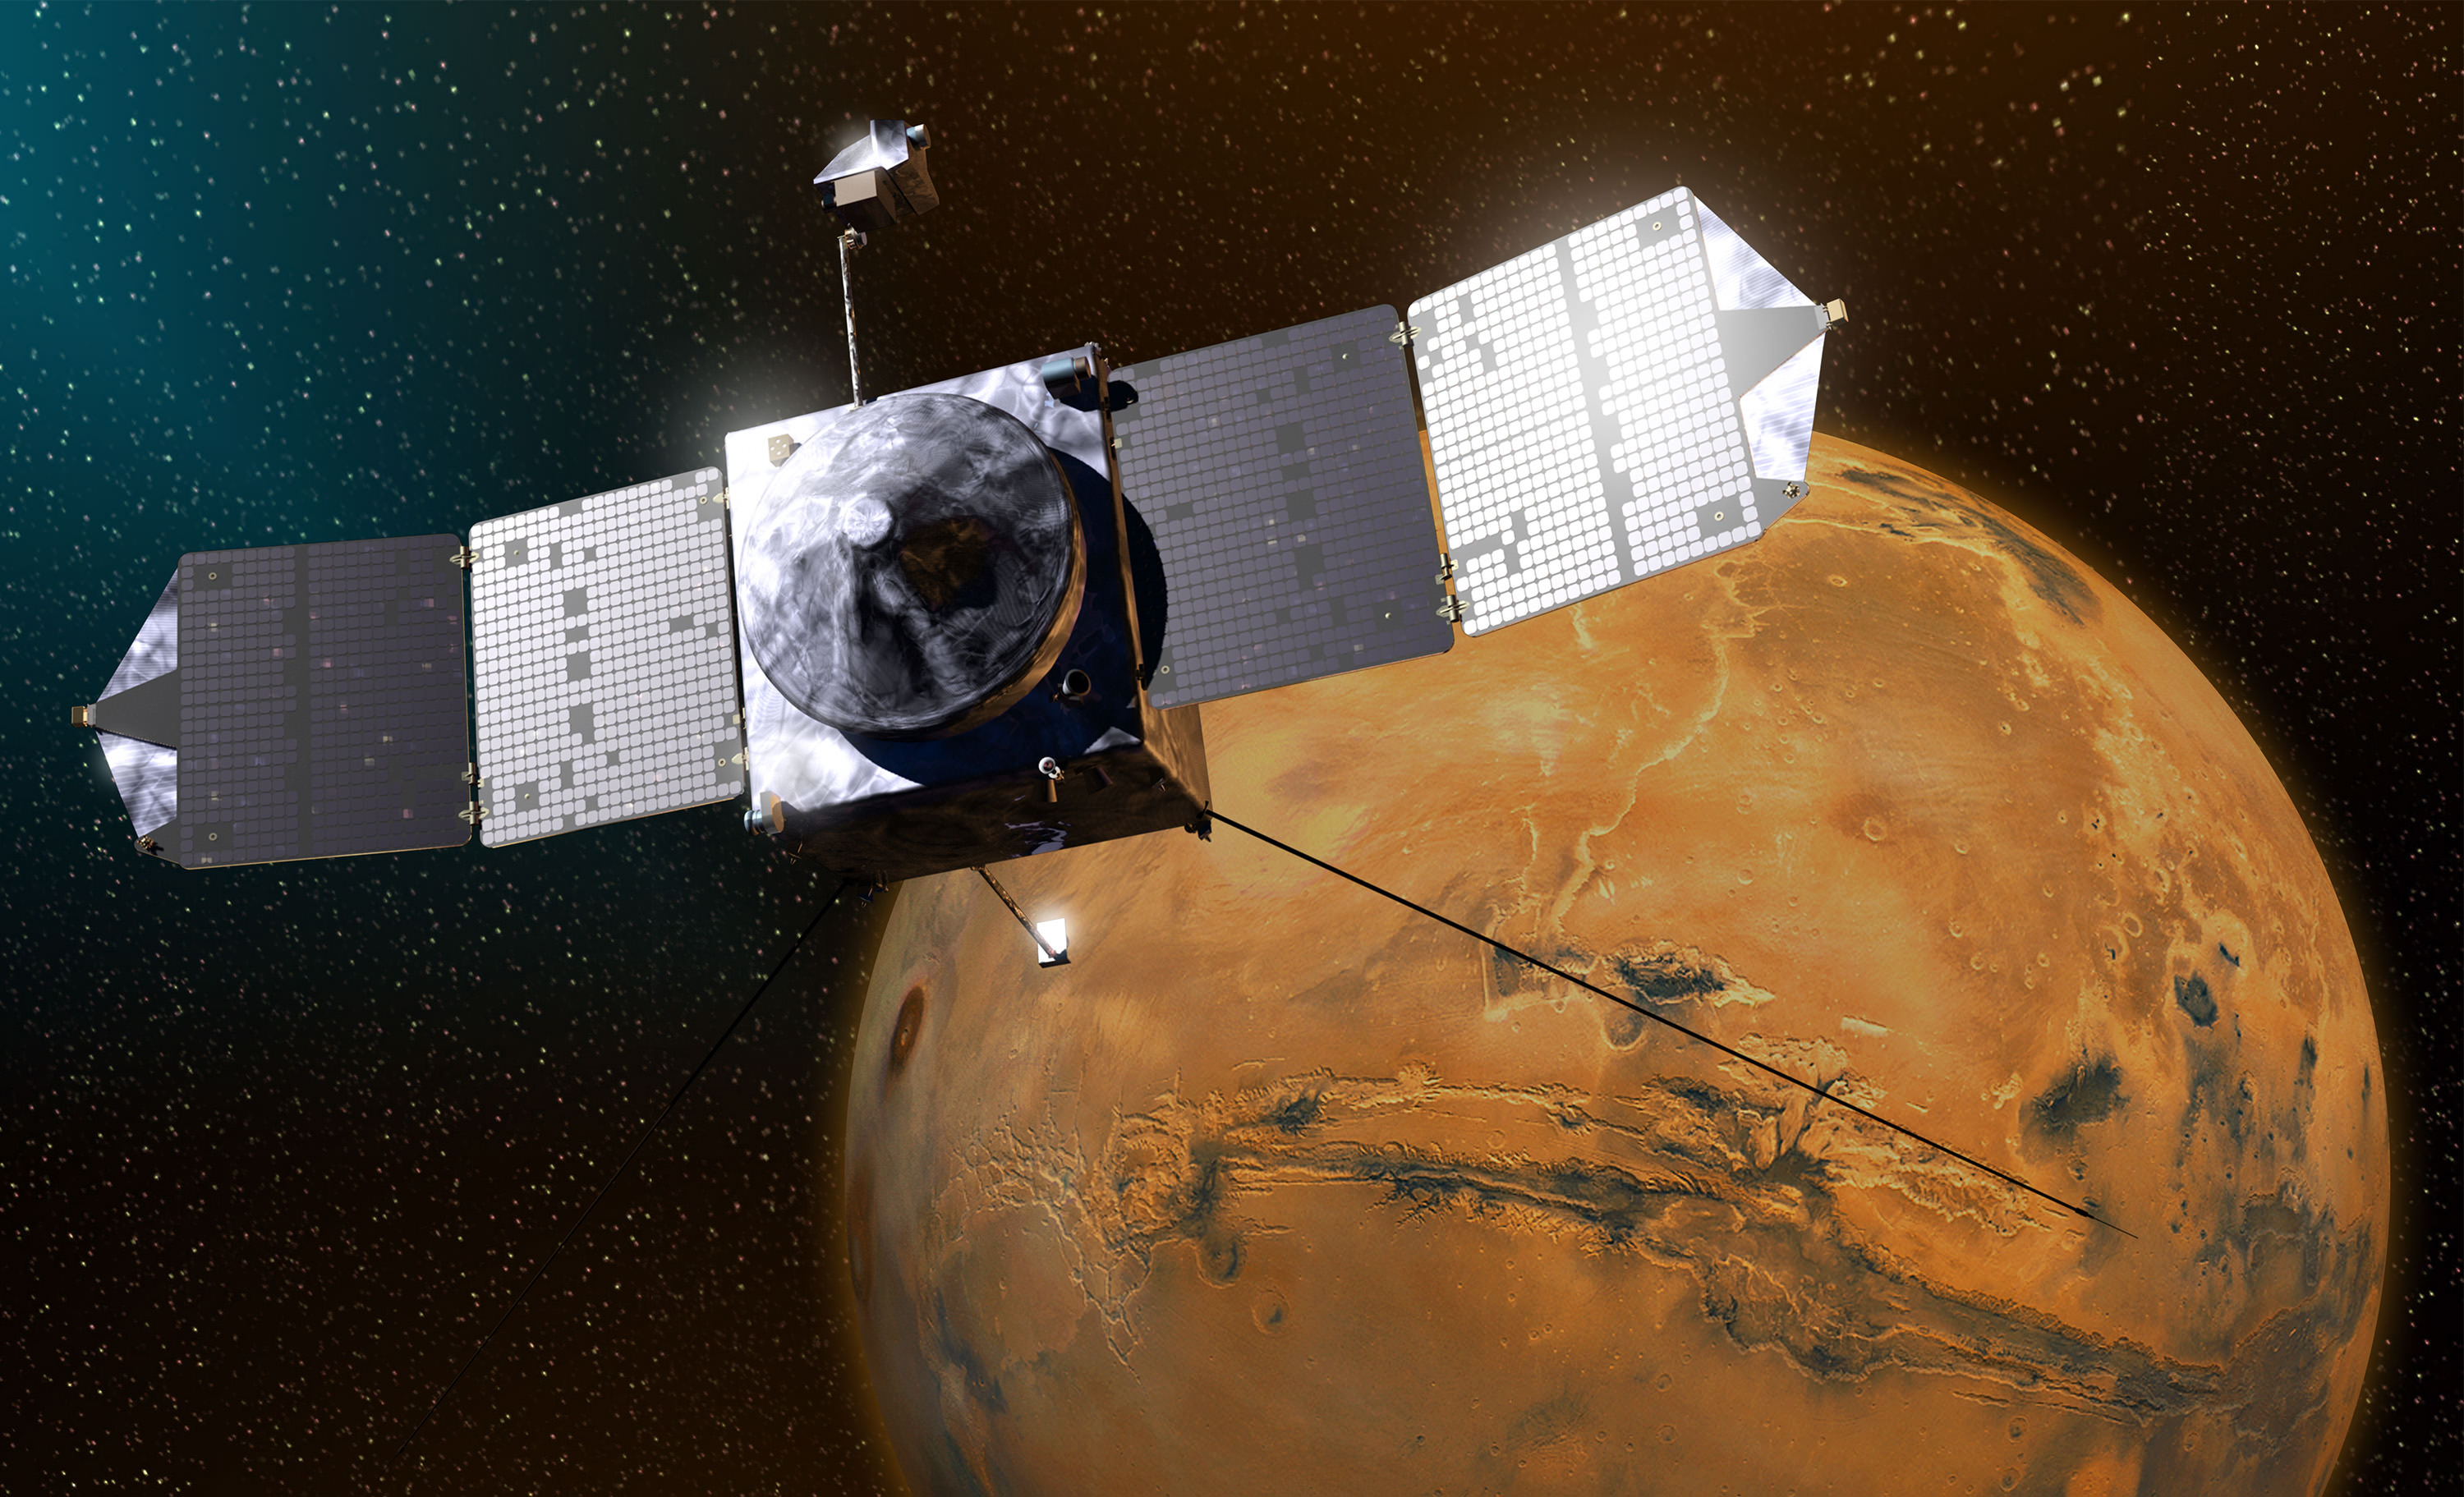
NASA’s Mars Atmosphere and Volatile EvolutioN Mission (MAVEN) orbiter was launched on November 18th, 2013, and reached Mars on September 22nd, 2014. The purpose of the mission is to study the atmosphere of Mars and also serve as a communications relay satellite for robotic landers and rovers on the surface.

Most recently, the Indian Space Research Organisation (ISRO) launched the Mars Orbiter Mission (MOM, also called Mangalyaan) on November 5th, 2013. The orbiter successfully reached Mars on September 24th, 2014, and was the first spacecraft to achieve orbit on the first try. A technology demonstrator, who’s secondary purpose is to study the Martian atmosphere, MOM is India’s first mission to Mars, and has made the ISRO the fourth space agency to reach the planet.

An artist's conception of MAVEN orbiting Mars. Image Credit: NASA / Goddard Space Flight Center
An artist’s conception of the MAVEN orbiter arriving at Mars. Credit: NASA/Goddard Space Flight Center

Future missions to Mars include NASA’s Interior Exploration using Seismic Investigations, Geodesy and Heat Transport (InSIGHT) lander. This mission, which is planned for launch in 2016, involves placing a stationary lander equipped with a seismometer and heat transfer probe on the surface of Mars. The probe will then deploy these instruments into the ground to study the planets interior and get a better understanding of its early geological evolution.

The ESA and Roscosmos are also collaborating on a large mission to search for biosignatures of Martian life, known as Exobiology on Mars (or ExoMars). Consisting of an orbiter that will be launched in 2016, and a lander that will be deployed to the surface by 2018, the purpose of this mission will be to map the sources of methane and other gases on Mars that would indicate the presence of life, past and present.

The United Arab Emirates also has a plan to send an orbiter to Mars by 2020. Known as Mars Hope, the robotic space probe will be deployed in orbit around Mars for the sake of studying its atmosphere and climate. This spacecraft will be the first to be deployed by an Arab state in orbit of another planet, and is expected to involve collaboration from the University of Colorado, the University of California, Berkeley and Arizona State University, as well the French space agency (CNES).
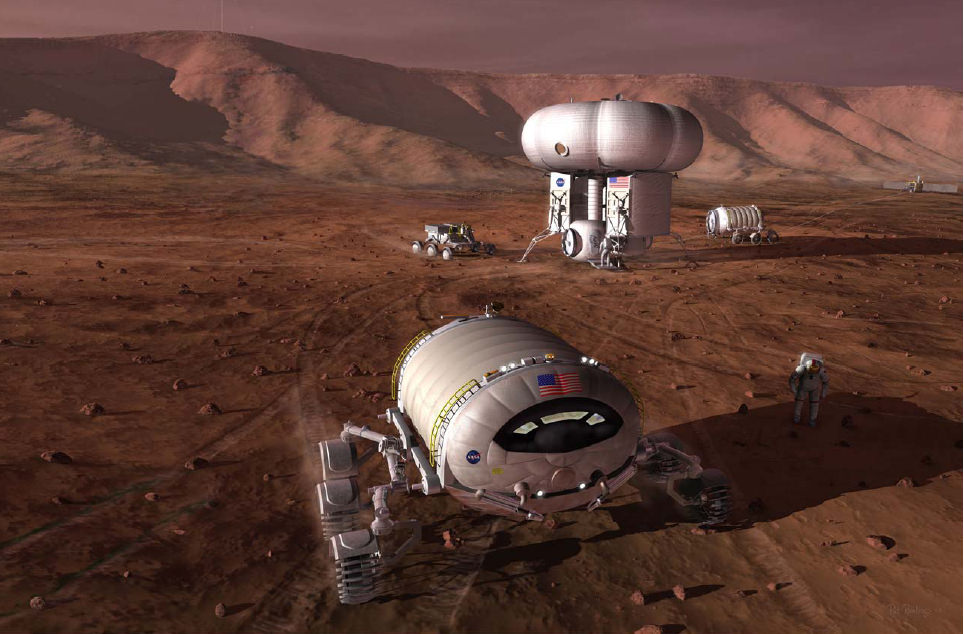
Crewed Missions:

Numerous federal space agencies and private companies have plans to send astronauts to Mars within the not-too-distant future. For instance, NASA has confirmed that it plans to conduct a manned mission to Mars by 2030. In 2004, human exploration of Mars was identified as a long-term goal in the Vision for Space Exploration – a public document released by the Bush administration.

Concept for NASA Design Reference Mission Architecture 5.0 (2009
Concept for NASA Design Reference Mission Architecture 5.0 (2009). Credit: NASA

In 2010, President Barack Obama announced his administration’s space policy, which included increasing NASA funding by $6 billion over five years and completing the design of a new heavy-lift launch vehicle by 2015. He also predicted a U.S.-crewed orbital Mars mission by the mid-2030s, preceded by an asteroid mission by 2025.

The ESA also has plans to land humans on Mars between 2030 and 2035. This will be preceded by successively larger probes, starting with the launch of the ExoMars probe and a planned joint NASA-ESA Mars sample return mission.

In Robert Zubrin (founder of the Mars Society) proposed a low-cost human mission to NASA known as Mars Direct, which he expanded on in his 1996 book The Case for Mars. According to Zubrin, the plan calls for a new class of heavy-lift rockets (similar to the Saturn V) to send human explorers and payloads to the Red Planet. A modified proposal, known as “Mars to Stay”, involves a possible one-way trip, where the astronauts would become Mars’ first colonists.

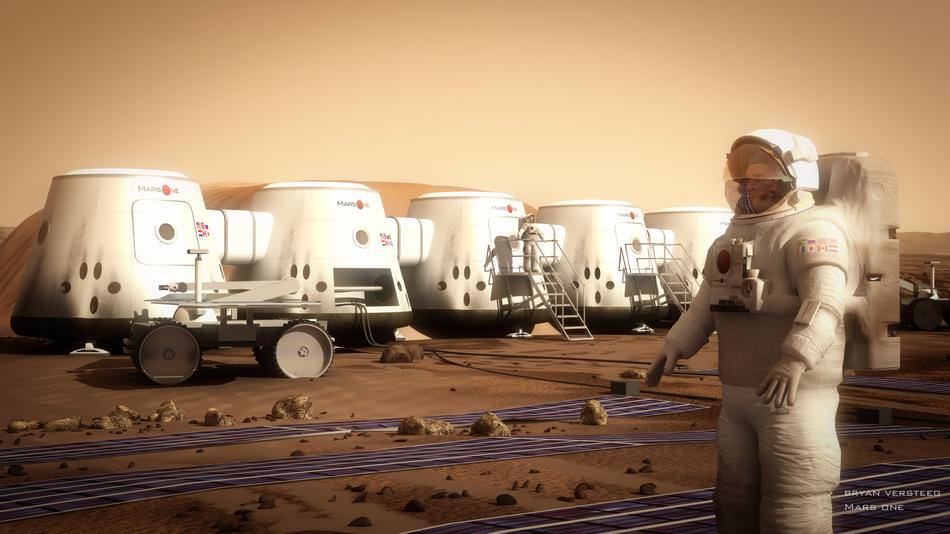
Similarly, MarsOne, a Netherlands-based non-profit organization, hopes to establish a permanent colony on the planet beginning in 2027. The original concept included launching a robotic lander and orbiter as early as 2016 to be followed by a human crew of four in 2022. Subsequent crews of four will be sent every few years, and funding is expected to be provided in part by a reality TV program that will document the journey.

Artist's concept of a Martian astronaut standing outside the Mars One habitat. Credit: Bryan Versteeg/Mars One
Artist’s concept of a Martian astronaut standing outside the Mars One habitat. Credit: Bryan Versteeg/Mars One

SpaceX and Tesla CEO Elon Musk has also announced plans to establish a colony on Mars. Intrinsic to this plan is the development of the Mars Colonial Transporter (MCT), a spaceflight system that would rely of reusable rocket engines, launch vehicles and space capsules to transport humans to Mars and return to Earth.

As of 2014, SpaceX has begun development of the large Raptor rocket engine for the Mars Colonial Transporter, and a successful test was announced in September of 2016. In January 2015, Musk said that he hoped to release details of the “completely new architecture” for the Mars transport system in late 2015.

In June 2016, Musk stated in the first unmanned flight of the MCT spacecraft would take place in 2022, followed by the first manned MCT Mars flight departing in 2024. In September 2016, during the 2016 International Astronautical Congress, Musk revealed further details of his plan, which included the design for an Interplanetary Transport System (ITS) – an upgraded version of the MCT.

Mars is the most studied planet in the Solar System after Earth. As of the penning of this article, there are 3 landers and rovers on the surface of Mars (Phoenix, Opportunity and Curiosity), and 5 functional spacecraft in orbit (Mars Odyssey, Mars Express, MRO, MOM, and MAVEN). And more spacecraft will be on their way soon.

These spacecraft have sent back incredibly detailed images of the surface of Mars, and helped discover that there was once liquid water in Mars’ ancient history. In addition, they have confirmed that Mars and Earth share many of the same characteristics – such as polar icecaps, seasonal variations, an atmosphere, and the presence of flowing water. They have also shown that organic life can and most likely did live on Mars at one time.

In short, humanity’s obsession with the Red Planet has not waned, and our efforts to explore its surface and understand its history are far from over. In the coming decades, we are likely to be sending additional robotic explorers, and human ones as well. And given time, the right scientific know-how, and whole lot of resources, Mars may even be suitable for habitation someday.

We have written many interesting articles about Mars here at Universe Today. Here’s How Strong Is The Gravity On Mars?, How Long Does It Take To Get To Mars?, How Long Is A Day On Mars?, Mars Compared To Earth, How Can We Live On Mars?

Astronomy Cast also has several good episodes on the subject – Episode 52: Mars, Episode 92: Missions to Mars – Part 1, and Episode 94: Humans to Mars, Part 1 – Scientists.

For more information, check out NASA’s Solar System Exploration page on Mars and NASA’s Journey to Mars.

The Dwarf Planet Pluto

Pluto was re-classified as a dwarf planet based on our growing understanding of its nature. Will Schlaufman's new study help us more accurately classify gas giants and brown dwarfs? NASA's New Horizons spacecraft captured this high-resolution enhanced color view of Pluto on July 14, 2015. Credit: NASA/JHUAPL/SwRI

After being officially discovered by Clyde Tombaugh in 1930, Pluto spent close to a century being thought of as the ninth planet of our Solar System. In 2006, it was reclassified as a “dwarf planet” due to the discovery of other Trans-Neptunian Objects (TNOs) of comparable size. However, that does not change its significance in our galaxy. In addition to being the largest TNO, it is the largest and second-most massive dwarf planet of our Solar System.

As a result, a great deal of time and study has been devoted to this former planet. And with the successful flyby of the New Horizons mission this month, we finally have a clear picture of what it looks like. As scientists pour over the voluminous amounts of data being sent back, our understanding of this world at the edge of our Solar System has grown by leaps and bounds.

Discovery:

The existence of Pluto was predicted before it was observed. In the 1840s, French mathematician Ubrain Le Verrier used Newtonian mechanics to predict the position of Neptune (which had not yet been discovered) based on the perturbation of Uranus. By the late 19th century, subsequent observations of Neptune led astronomers to believe that a planet was perturbing its orbit as well.

In 1906, Percival Lowell – an American mathematician and astronomer who founded the Lowell Observatory in Flagstaff, Arizona, in 1894 – initiated a project to locate “Planet X”, the possible ninth planet of the Solar System. Unfortunately, Lowell died in 1916 before a confirmed discovery was made. But unbeknownst to him, his surveys had captured two faint images of Pluto (March 19th and April 7th, 1915), which were not recognized for what they were.

The discovery photographs of Pluto, dated January 23rd and 29th , 1930. Credit: Lowell Observatory Archives

After Lowell’s death, the search did not resume until 1929, at which point the director of the Lowell Observatory (Vesto Melvin Slipher) entrusted the job of locating Planet X to Clyde Tombaugh. A 23 year-old astronomer from Kansas, Tombaugh spent the next year photographing sections of the night sky and then analyzing the photographs to determine if any objects had shifted position.

On February 18th, 1930, Tombaugh discovered a possible moving object on photographic plates taken in January of that year. After the observatory obtained further photographs to confirm the existence of the object, news of the discovery was telegraphed to the Harvard College Observatory on March 13th, 1930. The mysterious Planet X had finally been discovered.

Naming:

After the discovery was announced, the Lowell Observatory was flooded with suggestions for names. The name Pluto, based on the Roman god of the underworld, was proposed by Venetia Burney (1918–2009), a then eleven-year-old schoolgirl in Oxford, England. She suggested it in a conversation with her grandfather who passed the name on to astronomy professor Herbert Hall Turner, who cabled it to colleagues in the United States.

Pluto's surface as viewed from the Hubble Space Telescope in several pictures taken in 2002 and 2003. Though the telescope is a powerful tool, the dwarf planet is so small that it is difficult to resolve its surface. Astronomers noted a bright spot (180 degrees) with an unusual abundance of carbon monoxide frost. Credit: NASA
Pluto’s surface as viewed from the Hubble Space Telescope in several pictures taken in 2002 and 2003. Credit: NASA/Hubble

The object was officially named on March 24th, 1930, and it came down to a vote between three possibilities – Minerva, Cronus, and Pluto. Every member of the Lowell Observatory voted for Pluto, and the name was announced on May 1st, 1930. The choice was based on part on the fact that the first two letters of Pluto – P and L – corresponded to the initials of Percival Lowell.

The name quickly caught on with the general public. In 1930, Walt Disney was apparently inspired by it when he introduced a canine companion for Mickey Mouse named Pluto. In 1941, Glenn T. Seaborg named the newly created element plutonium after Pluto. This was in keeping with the tradition of naming elements after newly discovered planets – such as uranium, which was named after Uranus; and neptunium, which was named after Neptune.

Size, Mass and Orbit:

With a mass of 1.305±0.007 x 1o²² kg – which is the equivalent of 0.00218 Earths and 0.178 Moons – Pluto is the second most-massive dwarf planet and the tenth-most-massive known object directly orbiting the Sun. It has a surface area of 1.765×10⁷ km, and a volume of 6.97×10⁹ km3.

Map of Pluto, with (informal) names for some of the largest surface features. Credit: NASA/JHUAPL
Map of Pluto’s surface features, with (informal) names for some of the largest surface features. Credit: NASA/JHUAPL

Pluto has a moderately eccentric and inclined orbit, which ranges from 29.657 AU (4.4 billion km) at perihelion to 48.871 AU (7.3 billion km) at aphelion. This means that Pluto periodically comes closer to the Sun than Neptune, but a stable orbital resonance with Neptune prevents them from colliding.

Pluto has an orbital period of 247.68 Earth years, meaning it takes almost 250 years to complete a single orbit of the Sun. Meanwhile, its rotation period (a single day) is equal to 6.39 Earth days. Like Uranus, Pluto rotates on its side, with an axial tilt of 120° relative to its orbital plane, which results in extreme seasonal variations. At its solstices, one-fourth of its surface is in continuous daylight, whereas another fourth is in continuous darkness.

Composition and Atmosphere:

With a mean density of 1.87 g/cm3, Pluto’s composition is differentiated between an icy mantle and a rocky core. The surface is composed of more than 98% nitrogen ice, with traces of methane and carbon monoxide. The surface is very varied, with large differences in both brightness and color. A  notable feature is a large, pale area nicknamed the “Heart”.

The Theoretical structure of Pluto, consisting of 1. Frozen nitrogen 2. Water ice 3. Rock. Credit: NASA/Pat Rawlings
The theoretical structure of Pluto, consisting of 1. Frozen nitrogen 2. Water ice 3. Rock. Credit: NASA/Pat Rawlings

Scientists also suspect that Pluto’s internal structure is differentiated, with the rocky material having settled into a dense core surrounded by a mantle of water ice. The diameter of the core is believed to be approximately 1700 km, 70% of Pluto’s diameter. Thanks to the decay of radioactive elements, it is possible that Pluto contains a subsurface ocean layer that is 100 to 180 km thick at the core–mantle boundary.

Pluto has a thin atmosphere consisting of nitrogen (N2), methane (CH4), and carbon monoxide (CO), which are in equilibrium with their ices on Pluto’s surface. However, the planet is so cold that during part of its orbit, the atmosphere congeals and falls to the surface. The average surface temperature is 44 K (-229 °C), ranging from 33 K (-240 °C) at aphelion to 55 K (-218 °C) at perihelion.

Satellites:

Pluto has five known satellites. The largest, and closest in orbit to Pluto, is Charon. This moon was first identified in 1978 by astronomer James Christy using photographic plates from the United States Naval Observatory (USNO) in Washington, D.C. Beyond Charon lies the four other circumbinary moons – Styx, Nix, Kerberos, and Hydra, respectively.

Nix and Hydra were discovered simultaneously in 2005 by the Pluto Companion Search Team using the Hubble Space Telescope. The same team discovered Kerberos in 2011. The fifth and final satellite, Styx, was discovered by the New Horizons spacecraft in 2012 while capturing images of Pluto and Charon.

Artist's concept comparing the scale and brightness of the moons of Pluto. Credit: NASA/ESA/M. Showalter
Artist’s concept comparing the scale and brightness of the moons of Pluto. Credit: NASA/ESA/M. Showalter

Charon, Styx and Kerberos are all massive enough to have collapsed into a spheroid shape under their own gravity. Nix and Hydra, meanwhile, are oblong in shape. The Pluto-Charon system is unusual, since it is one of the few systems in the Solar System whose barycenter lies above the primary’s surface. In short, Pluto and Charon orbit each other, causing some scientists to claim that it is a “double-dwarf system” instead of a dwarf planet and an orbiting moon.

In addition, it is unusual in that each body is tidally locked to the other. Charon and Pluto always present the same face to each other; and from any position on either body, the other is always at the same position in the sky, or always obscured. This also means that the rotation period of each is equal to the time it takes the entire system to rotate around its common center of gravity.

In 2007, observations by the Gemini Observatory of patches of ammonia hydrates and water crystals on the surface of Charon suggested the presence of active cryo-geysers. This would seem indicate that Pluto does have a subsurface ocean that is warm in temperature, and that the core is geologically active. Pluto’s moons are believed to have been formed by a collision between Pluto and a similar-sized body early in the history of the Solar System. The collision released material that consolidated into the moons around Pluto.

Classification:

From 1992 onward, many bodies were discovered orbiting in the same area as Pluto, showing that Pluto is part of a population of objects called the Kuiper Belt. This placed its official status as a planet in question, with many asking whether Pluto should be considered separately or as part of its surrounding population – much as Ceres, Pallas, Juno and Vesta, which lost their planet status after the discovery of the Asteroid Belt.

On July 29h, 2005, the discovery of a new Trans-Neptunian Object (TNO), Eris, was announced, which was thought to be substantially larger than Pluto. Initially referred to the as the Solar System’s “tenth planet”, there was no consensus on whether or not Eris constituted the planet. What’s more, others in the astronomic community considered its discovery the strongest argument for reclassifying Pluto as a minor planet.

The debate came to a head on August 24th, 2006 with an IAU resolution that created an official definition for the term “planet”. According to the XXVI General Assembly of the International Astronomical Union, a planet must meet three criteria: it needs to be in orbit around the Sun, it needs to have enough gravity to pull itself into a spherical shape, and it needs to have cleared its orbit of other objects.

Pluto fails to meet the third condition, because its mass is only 0.07 times that of the mass of the other objects in its orbit. The IAU further decided that bodies that do not meet criterion 3 would be called dwarf planets. On September 13th, 2006, the IAU included Pluto, and Eris and its moon Dysnomia, in their Minor Planet Catalog.

The IAUs decision was met with mixed reactions, especially from within the scientific community. For instance, Alan Stern, the principal investigator with NASA’s New Horizons mission to Pluto, and Marc W. Buie – an astronomer with the Lowell Observatory – have both openly voiced dissatisfaction with the reclassification. Others, such as Mike Brown – the astronomer who discovered Eris – have voiced their support.

Our evolving understanding of Pluto, represented by images taken by Hubble in 2002-3 (left), and images taken by New Horizons in 2015 (right). Credit: theguardian.com

On August 14th – 16th, 2008, in what came to be known as “The Great Planet Debate“, researchers on both sides of the issue gathered at Johns Hopkins University Applied Physics Laboratory. Unfortunately, no scientific consensus was reached; but on June 11th 2008, the IAU announced in a press release that the term “plutoid” would henceforth be used to refer to Pluto and other similar objects.

Exploration:

Pluto presents significant challenges for spacecraft because of its small mass and great distance from Earth. In 1980, NASA began to contemplate sending the Voyager 1 spacecraft on a flyby of Pluto. However, the controllers opted instead for a close flyby of Saturn’s moon Titan, resulting in a trajectory incompatible with a Pluto flyby.

Voyager 2 never had a plausible trajectory for reaching Pluto, but it’s flyby Neptune and Triton in 1989 led scientists to once again begin contemplating a mission that would take a spacecraft to Pluto for the sake of studying the Kuiper Belt and Kuiper Belt Objects (KBOs). This led to the formation of the Pluto Kuiper Express mission proposal, and NASA instructing the JPL to being planning for a Pluto, Kuiper Belt flyby.

By 2000, the program had been scrapped due to apparent budget concerns. After much pressure had been brought to bear by the scientific community, a revised mission to Pluto, dubbed New Horizons, was finally granted funding from the US government in 2003. New Horizons was launched successfully on January 19th, 2006.

From September 21st-24th, 2006, New Horizons managed to capture its first images of Pluto while testing the LORRI instruments. These images, which were taken from a distance of approximately 4,200,000,000 km (2.6×10⁹ mi) or 28.07 AU and released on November 28th, confirmed the spacecraft’s ability to track distant targets.

Distant-encounter operations at Pluto began on January 4th, 2015. Between January 25th to 31st, the approaching probe took several images of Pluto, which were released by NASA on February 12th. These photos, which were taken at a distance of more than 203,000,000 km (126,000,000 mi) showed Pluto and its largest moon, Charon.

Pluto
Pluto and Charon, captured by the New Horizons spacecraft from January 25th to 31st. Credit: NASA

The New Horizons spacecraft made its closest approach to Pluto at 07:49:57 EDT (11:49:57 UTC) on July 14th, 2015, and then Charon at 08:03:50 EDT (12:03:50 UTC). Telemetries confirming a successful flyby and the health of the spacecraft reached Earth on 20:52:37 EDT (00:52:37 UTC).

During the flyby, the probe captured the clearest pictures of Pluto to date, and full analyses of the data obtained is expected to take years to process. The spacecraft is currently traveling at a speed of 14.52 km/s (9.02 mi/s) relative to the Sun and at 13.77 km/s (8.56 mi/s) relative to Pluto.

Though the New Horizons mission has shown us much about Pluto – and will continue to do so as scientists pour over all the data collected by the probe’s instruments – we still have much to learn about this distant and mysterious world. In time, and with more missions to the outer Solar System, we may eventually be able to unlock some of its deeper mysteries.

Artist's impression of the New Horizons spacecraft in orbit around Pluto (Charon is seen in the background). Credit: NASA/JPL
Artist’s impression of the New Horizons spacecraft in orbit around Pluto (Charon is seen in the background). Credit: NASA/JPL

Until then, we offer all information that is currently available on Pluto. We hope that you find what you are looking for in the links below and, as always, enjoy your research!

Characteristics of Pluto:

Movement and Location of Pluto:

Moons of Pluto:

History of Pluto:

Features of Pluto:

Other Pluto Articles:

New Horizons Mission to Pluto

Artist's impression of the New Horizons spacecraft in orbit around Pluto (Charon is seen in the background). Credit: NASA/JPL

Humans have been sending spacecraft to other planets, as well as asteroid and comets, for decades. But rarely have any of these ventured into the outer reaches of our Solar System. In fact, the last time a probe reached beyond the orbit of Saturn to explore the worlds of Neptune, Uranus, Pluto and beyond was with the Voyager 2 mission, which concluded back in 1989.

But with the New Horizons mission, humanity is once again peering into the outer Solar System and learning much about its planets, dwarf planets, planetoids, moons and assorted objects. And as of July 14th, 2015, it made its historic rendezvous with Pluto, a world that has continued to surprise and mystify astronomers since it was first discovered.

Background:

In 1980, after Voyager 1‘s flyby of Saturn, NASA scientists began to consider the possibility of using Saturn to slingshot the probe towards Pluto to conduct a flyby by 1986. This would not be the case, as NASA decided instead to conduct a flyby of Saturn’s moon of Titan – which they considered to be a more scientific objective – thus making a slingshot towards Pluto impossible.

Because no mission to Pluto was planned by any space agency at the time, it would be years before any missions to Pluto could be contemplated. However, after Voyager 2′s flyby of Neptune and Triton in 1989, scientists once again began contemplating a mission that would take a spacecraft to Pluto for the sake of studying the Kuiper Belt and Kuiper Belt Objects (KBOs).

Voyager 2. Credit: NASA
Artist’s impression of the Voyager spacecraft in flight. Credit: NASA/JPL

In May 1989, a group of scientists, including Alan Stern and Fran Bagenal, formed an alliance called the “Pluto Underground”. Committed to the idea of mounting an exploratory mission to Pluto and the Kuiper Belt, this group began lobbying NASA and the US government to make it this plan a reality. Combined with pressure from the scientific community at large, NASA began looking into mission concepts by 1990.

During the course of the late 1990s, a number of Trans-Neptunian Objects (TNOs) were discovered, confirming the existence of the Kuiper Belt and spurring interest in a mission to the region. This led NASA to instruct the JPL to re-purpose the mission as a Pluto and KBO flyby. However, the mission was scrapped by 2000, owing to budget constraints.

Backlash over the cancellation led NASA’s Science Mission Directorate to create the New Frontiers program which began accepting mission proposals. Stamatios “Tom” Krimigis, head of the Applied Physics Laboratory’s (APL) space division, came together with Alan Stern to form the New Horizons team. Their proposal was selected from a number of submissions, and officially selected for funding by the New Frontiers program in Nov. 2001.

Despite additional squabbles over funding with the Bush administration, renewed pressure from the scientific community allowed the New Horizons team managed to secure their funding by the summer of 2002. With a commitment of $650 million for the next fourteen years, Stern’s team was finally able to start building the spacecraft and its instruments.

Engineers working on the New Horizons spacecraft's Pluto Energetic Particle Spectrometer Science Investigation (PEPSSI) instrument. Credit: NASA
Engineers working on the New Horizons spacecraft’s Pluto Energetic Particle Spectrometer Science Investigation (PEPSSI) instrument. Credit: NASA

Mission Profile:

New Horizons was planned as a voyage to the only unexplored planet in the Solar System, and was originally slated for launch in January 2006 and arrival at Pluto in 2015. Alan Stern was selected as the mission’s principal investigator, and construction of the spacecraft was handled primarily by the Southwest Research Institute (SwRI) and the Johns Hopkins Applied Physics Laboratory, with various contractor facilities involved in the navigation of the spacecraft.

Meanwhile, the US Naval Observatory (USNO) Flagstaff Station – in conjunction with NASA and JPL – was responsible for performing navigational position data and related celestial frames. Coincidentally, the UNSO Flagstaff station was where the photographic plates that led to the discovery of Pluto’s moon Charon came from.

In addition to its compliment of scientific instruments (listed below), there are several cultural artifacts traveling aboard the spacecraft. These include a collection of 434,738 names stored on a compact disc, a piece of Scaled Composites’s SpaceShipOne, and a flag of the USA, along with other mementos. In addition, about 30 g (1 oz) of Clyde Tombaugh’s ashes are aboard the spacecraft, to commemorate his discovery of Pluto in 1930.

The New Horizons spacecraft takes off on Jan. 19, 2006 from the Kennedy Space Center for its planned close encounter with Pluto. Credit: NIKON/Scott Andrews/NASA

Instrumentation:

The New Horizons science payload consists of seven instruments. They are (in alphabetically order):

  • Alice: An ultraviolet imaging spectrometer responsible for analyzing composition and structure of Pluto’s atmosphere and looks for atmospheres around Charon and Kuiper Belt Objects (KBOs).
  • LORRI: (Long Range Reconnaissance Imager) a telescopic camera that obtains encounter data at long distances, maps Pluto’s farside and provides high resolution geologic data.
  • PEPSSI: (Pluto Energetic Particle Spectrometer Science Investigation) an energetic particle spectrometer which measures the composition and density of plasma (ions) escaping from Pluto’s atmosphere.
  • Ralph: A visible and infrared imager/spectrometer that provides color, composition and thermal maps.
  • REX: (Radio Science EXperiment) a device that measures atmospheric composition and temperature; passive radiometer.
  • SDC: (Student Dust Counter) built and operated by students, this instrument measures the space dust peppering New Horizons during its voyage across the solar system.
  • SWAP: (Solar Wind Around Pluto) a solar wind and plasma spectrometer that measures atmospheric “escape rate” and observes Pluto’s interaction with solar wind.

Instruments New Horizons will use to characterize Pluto are REX (atmospheric composition and temperature; PEPSSI (composition of plasma escaping Pluto's atmosphere); SWAP (solar wind); LORRI (close up camera for mapping, geological data); Star Dust Counter (student experiment measuring space dust during the voyage); Ralph (visible and IR imager/spectrometer for surface composition and thermal maps and Alice (composition of atmosphere and search for atmosphere around Charon). Credit: NASA/Johns Hopkins University Applied Physics Laboratory/Southwest Research Institute
The instruments New Horizons will use to characterize Pluto. Credit: NASA/Johns Hopkins University Applied Physics Laboratory/Southwest Research Institute

Launch:

Due to a series of weather-related delays, the New Horizons mission launched on January 19th, 2006, two days later than originally scheduled. The spacecraft took off from Cape Canaveral Air Force Station, Florida, at 15:00 EST (19:00 UTC) atop an Atlas V 551 rocket. This was the first launch of this particular rocket configuration, which has a third stage added to increase the heliocentric (escape) speed.

The spacecraft left Earth faster than any spacecraft to date, achieving a launch velocity of 16.5 km/s. It took only nine hours to reach the Moon’s orbit, passing lunar orbit before midnight (EST) on the same day it was launched. It has not, however, broken Voyager 1‘s record – which is currently traveling at 17.145 km/s (61,720 km/h, 38,350 mph) relative to the Sun – for being the fastest spacecraft to leave the Solar System.

Inner Solar System:

Between January and March, 2006, mission controllers guided the probe through a series of trajectory-correction maneuvers (TCMs). During the week of February 20th, 2006, controllers conducted in-flight tests on three of the major on board science instruments. On April 7th, the spacecraft passed the orbit of Mars, moving at roughly 21 km/s (76,000 km/h; 47,000 mph) away from the Sun.

At this point in its journey, the spacecraft had reached a distance of 243 million kilometers from the Sun, and approximately 93.4 million km from Earth. On June 13th, 2006, the New Horizons spacecraft passed the tiny asteroid 132524 APL at a distance of 101,867 km (63,297 mi) when it was closest.

Using the Ralph instrument, New Horizons was able to capture images of the asteroid, estimating to be 2.5 km (1.6 mi) in diameter. The spacecraft also successfully tracked the asteroid from June 10th-12th, 2006, allowing the mission team to test the spacecraft’s ability to track rapidly moving objects.

First images of Pluto in September 2006. Credit: NASA
First images of Pluto taken by New Horizons in September 2006. Credit: NASA

From September 21st-24th, New Horizons managed to capture its first images of Pluto while testing the LORRI instruments. These images, which were taken from a distance of approximately 4,200,000,000 km (2.6×10⁹ mi) or 28.07 AU and released on November 28th, confirmed the spacecraft’s ability to track distant targets.

Outer Solar System:

On September 4th, 2006, New Horizons took its first pictures of Jupiter at a distance of 291 million kilometers (181 million miles). The following January, it conducted more detailed surveys of the system, capturing an infrared image of the moon Callisto, and several black and white images of Jupiter itself.

By February 28th, 2007, at 23:17 EST (03:17, UTC) New Horizons made its closest approach to Europa, at a distance of 2,964,860 km (1,842,278 mi). At 01:53:40 EST (05:43:40 UTC), the spacecraft made its flyby of Jupiter, at a distance of 2.3 million km (1.4 million mi) and received a gravity assist.

The Jupiter flyby increased New Horizons‘ speed by 4 km/s (14,000 km/h; 9,000 mph), accelerating the probe to a velocity of 23 km/s (83,000 km/h; 51,000 mph) relative to the Sun and shortening its voyage to Pluto by three years.

The encounter with Jupiter not only provided NASA with the opportunity to photograph the planet using the latest equipment, it also served as a dress rehearsal for the spacecraft’s encounter with Pluto. As well as testing the imaging instruments, it also allowed the mission team to test the communications link and the spacecraft’s memory buffer.

Black and white image of Jupiter viewed by LORRI in January 2007
Black and white image of Jupiter viewed by LORRI in January 2007. Credit: NASA/John Hopkins University Applied Physics Laboratory/Southwest Research Institute

One of the main goals during the Jupiter encounter was observing its atmospheric conditions and analyzing the structure and composition of its clouds. Heat-induced lightning strikes in the polar regions and evidence of violent storm activity were both observed. In addition, the Little Red Spot,  was imaged from up close for the first time. The New Horizons spacecraft also took detailed images of Jupiter’s faint ring system. Traveling through Jupiter’s magnetosphere, the spacecraft also managed to collect valuable particle readings.

The flyby of the Jovian systems also gave scientists the opportunity to examine the structure and motion of Io’s famous lava plumes. New Horizons measured the plumes coming from the Tvashtar volcano, which reached an altitude of up to 330 km from the surface, while infrared signatures confirmed the presence of 36 more volcanoes on the moon.

Callisto’s surface was also analyzed with LEISA, revealing how lighting and viewing conditions affect infrared spectrum readings of its surface water ice. Data gathered on minor moons such as Amalthea also allowed NASA scientists to refine their orbit solutions.

After passing Jupiter, New Horizons spent most of its journey towards Pluto in hibernation mode. During this time, New Horizons crossed the orbit of Saturn (June 8, 2008) and Uranus on (March 18, 2011). In June 2014, the spacecraft emerged from hibernation and the team began conducting instrument calibrations and a course correction,. By August 24th, 2014, it crossed Neptune’s orbit on its way to Pluto.

Capturing Callisto
New Horizons Long Range Reconnaissance Imager (LORRI) captured these two images of Jupiter’s outermost large moon, Callisto, during its flyby in February 2007. Credit: NASA/JPL

Rendezvous with Pluto:

Distant-encounter operations at Pluto began on January 4th, 2015. Between January 25th to 31st, the approaching probe took several images of Pluto, which were released by NASA on February 12th. These photos, which were taken at a distance of more than 203,000,000 km (126,000,000 mi) showed Pluto and its largest moon, Charon.

Investigators compiled a series of images of the moons Nix and Hydra taken from January 27th through February 8th, 2015, beginning at a range of 201,000,000 km (125,000,000 mi), while Kerberos and Styx were captured by photos taken on April 25.

On July 4th, 2015, NASA lost contact with New Horizons after it experienced a software anomaly and went into safe mode. On the following day, NASA announced that they had determined it to be the result of a timing flaw in a command sequence. By July 6th, the glitch had been fixed and the probe had exited safe mode and began making its approach.

The New Horizons spacecraft made its closest approach to Pluto at 07:49:57 EDT (11:49:57 UTC) on July 14th, 2015, and then Charon at 08:03:50 EDT (12:03:50 UTC). Telemetries confirming a successful flyby and a healthy spacecraft reached Earth on 20:52:37 EDT (00:52:37 UTC).

During the flyby, the probe captured the clearest pictures of Pluto to date, and full analyses of the data obtained is expected to take years to process. The spacecraft is currently traveling at a speed of 14.52 km/s (9.02 mi/s) relative to the Sun and at 13.77 km/s (8.56 mi/s) relative to Pluto.

Full trajectory of New Horizons space probe (sideview). Credit: pluto.jhuapl.edu

Future Objectives:

With its flyby of Pluto now complete, the New Horizons probe is now on its way towards the Kuiper Belt. The goal here is to study one or two other Kuiper Belt Objects, provided suitable KBOs are close to New Horizons‘ flight path.

Three objects have since been selected as potential targets, which were provisionally designated PT1 (“potential target 1”), PT2 and PT3 by the New Horizons team. These have since been re-designated as 2014 MU69 (PT1), 2014 OS393 (PT2), and 2014 PN70 (PT3).

All of these objects have an estimated diameter of 30–55 km, are too small to be seen by ground telescopes, and are 43–44 AU from the Sun, which would put the encounters in the 2018–2019 period. All are members of the “cold” (low-inclination, low-eccentricity) classical Kuiper Belt, and thus very different from Pluto.

Even though it was launched far faster than any outward probe before it, New Horizons will never overtake either Voyager 1 or Voyager 2 as the most distant human-made object from Earth. But then again, it doesn’t need to, given that what it was sent out to study all lies closer to home.

What’s more, the probe has provided astronomers with extensive and updated data on many of planets and moons in our Solar System – not the least of which are the Jovian and Plutonian systems. And last, but certainly not least, New Horizons is the first spacecraft to have it made it out to such a distance since the Voyager program.

And so we say so long and good luck to New Horizons, not to mention thanks for providing us with the best images of Pluto anyone has ever seen! We can only hope she fares well as she makes its way into the Kuiper Belt and advances our knowledge of the outer Solar System even farther.

We have many interesting articles about the New Horizons spacecraft and Pluto here on Universe Today. For example, here are some Interesting Facts About PlutoHow Long Does it Take to Get to Pluto, Why Pluto is No Longer Considered a Planet, and Is There Life on Pluto?

For more information on the Kuiper Belt, check out What is The Kuiper Belt? and NASA’s Solar System Exploration entry on the Kuiper Belt and Oort Cloud.

Astronomy Cast also has some fascinating episodes on Pluto, including On Pluto’s Doorstep – Live Hangout with New Horizons Team

And be sure to check out the New Horizons mission homepage at NASA.

Charon: Pluto’s Largest Moon

Charon, Pluto's Largest Moon
Chasms, craters, and a dark north polar region are revealed in this image of Pluto’s largest moon Charon taken by New Horizons on July 11, 2015. The annotated version includes a diagram showing Charon’s north pole, equator, and central meridian, with the features highlighted. Credits: NASA/JHUAPL/SWRI

Beginning in 1978, astronomers began to discover that Pluto – the most distant known object from the Sun (at the time) – had its own moons. What had once been thought to be a solitary body occupying the outer edge of our Solar System suddenly appeared to have a system with a large moon Charon. And as time went on, a total of four moons would be discovered.

Of these, Charon is the largest and most easily observed, hence why it was discovered first. In addition to being the biggest of its peers, its also quite large in comparison to Pluto. As such, Charon has always had something of a unique relationship with its parent body, and stands apart as far as objects in the outer Solar System are concerned.

Continue reading “Charon: Pluto’s Largest Moon”

Pluto’s Moon Hydra

The Pluto system seen from the surface of Hydra. Credit: NASA

In 1930, Pluto was observed for the first time. For many decades, astronomers thought that the “ninth planet of the Solar System” was a solitary object. But by 1978, astronomers discovered that it also had a moon roughly half its size. This moon would come to be known as Charon, and it would be the first of many discoveries made within the Pluto’s system.

In fact, within the last decade, four additional satellites have been discovered in orbit of Pluto. Of these, the outermost to be observed is the moon now known as Hydra.

Discovery:
Hydra was first discovered in June 2005 by the Hubble Space Telescope‘s “Pluto Companion Search Team”, using images that were taken on May 15th and 18th of that year. At the time, the team was preparing for the launch of the New Horizons mission to Pluto, seeking to gain as much information as they could about any addition Plutonian moons.

By June, Hydra was again discovered. This time, it was independently observed by two members of the team, along with Nix –  another small Plutonian moon. The discoveries were announced on October 31st, 2005, and were provisionally given the designations of S/2005 P 1 and S/2005 P 2 (for Hydra and Nix, respectively).

This illustration shows the scale and comparative brightness of Pluto’s small satellites. The surface craters are for illustration only and are not real. Credits: NASA/ESA/A. Feild (STScI)
Artist’s illustration comparing the scale and comparative brightness of Pluto’s small satellites.
Credits: NASA/ESA/A. Feild (STScI)

Name:
By June 21st, 2006, the name Hydra was assigned by the IAU (along with the formal designation Pluto III). The name Hydra, which is derived from the nine-headed serpent of Greek mythology, was selected for two reasons. The letter H refers to the Hubble Telescope, which was used to make the discovery, while the nine-headed serpent referred to Pluto’s tenure as the ninth planet of the Solar System.

Size, Mass and Orbit:
Although its size has not been directly measured, calculations based on its brightness have indicated that Hydra’s diameter is between 40 and 160 kilometers (38 and 104 mi). Similar measurements estimate its mass to be in the vicinity of 4.2 x 10¹⁷ kg. Because of the uncertainty in these measurements, Hydra is either comparable in size to either the main moons of Saturn and Neptune, or the inner and irregular moons of Jupiter, Saturn and Uranus.

Hydra orbits Pluto at a distance of about 65,000 km with a very low eccentricity (0.0059) and an orbital inclination of about 0.24°. It orbits in the same plane as Charon and Nix and has an orbital period of 38.2 days.

Composition:
Little is known about Hydra’s composition, and its density and albedo are both currently unknown. However, it is believed that if its diameter is towards the lower end of its estimated range (40 km), then it must have a geometric albedo similar to Charons (35%).

Labeled image of Hydra released upon IAU name approval. Credit: NASA/ESA/Hubble

However, assuming it is at the higher end of that range, it would likely have a reflectivity of about 4%, like the darkest Kuiper belt objects. Like all outer bodies in the outer Solar System, and its host planet Pluto, it is possible that Hydra’s composition is differentiated into a rocky core and an icy mantle that contains nitrogen and methane in ice form.

At the time of its discovery, Hydra appeared to be brighter than Nix. Observations made with the Hubble Telescope in 2005–06, which specifically targeting the two moons, once again confirmed that Hydra is the brighter of the two. Hydra appears to be spectrally neutral like Charon and Nix (i.e. greyish), whereas Pluto is reddish.

Interesting Facts:
Hydra, not being massive enough to form a spheroid under its own gravity, is believed to be oblong in shape – the same holds true for Pluto’s moon of Nix. As with the rest of the Pluto system, Hydra was imaged by NASA’s New Horizons spacecraft in February of 2015. When New Horizons conducts its flyby at 7:49:57 a.m. EDT, July 14, 2015, it will provide the most detailed images of Hydra and the Pluto system to date.

We have several interesting articles on Pluto’s moon of Hydra. Here’s one on the First New Images of Pluto from New Horizons, and New Horizons Now Close Enough to See Pluto’s Smaller Moons.

For more information on the constellation of Hydra, click here. For more information on New Horizons mission to Hydra, click here.

Is There Life on Pluto?

An artist's illustration of Pluto. Credit: NASA/New Horizons

First discovered in 1930, Pluto was considered to be the ninth planet in our Solar System for many decades. And though its status has since been downgraded to that of a dwarf planet, thanks to the discovery of Eris in 2004, Pluto continues to fascinate and intrigue astronomers.

And with the New Horizons mission fast approaching the planet, astronomers are eagerly anticipating the return of photographs and data that will help them answer some burning questions they have about this celestial body – not the least of which is whether or not it supports life!

Surface Conditions:
To be fair, there is virtually no chance that Pluto has life living on its surface. For starters, it orbits our Sun at extreme distances, ranging from 29.657 AU (4,437,000,000 km) at perihelion to 48.871 AU (7,311,000,000 km) at aphelion. At this distance, surface temperatures can reach as low as 33 K (-240 °C or -400 °F).

Not only does water freeze solid at these temperatures, but other liquids and gases that are present on Pluto’s surface – such as methane (CH4), nitrogen gas (N²), and carbon monoxide (CO) – also freeze solid. These compounds have much lower freezing points than water, and so the chance of life surviving under these conditions is slim to nil.

An artist’s concept of frosty Pluto. Credit: ESO/ L. Calçada

And while Pluto has a thin atmosphere, it consists mainly of nitrogen gas, methane and carbon monoxide, which exist in equilibrium with their ices on the surface. At the same time, the surface pressure ranges from s from 6.5 to 24 ?bar (0.65 to 2.4 Pa), which is roughly one million to 100,000 times less than Earth’s atmospheric pressure.

This atmosphere also undergoes transitions as Pluto gets closer and farther away from the Sun. Basically, when Pluto is at perihelion, the atmosphere freezes solid; when it is at aphelion, the surface temperature increases, causing the ices to sublimate.

As such, there is simply no way life could survive on the surface of Pluto. Between the extreme cold, low atmospheric pressure, and constant changes in the atmosphere, no known organism could survive. However, that does not rule out the possibility of life being found inside the planet.

Interior:
Like many moons and smaller planetoids in the Outer Solar System, scientists believe that Pluto’s internal structure is differentiated, with rocky material having settled into a dense core surrounded by a mantle of ice. The diameter of the core is believed to be approximately 1700 km (accounting for 70% of Pluto’s diameter), whereas the ice layer is estimated to be 100 to 180 km thick at the core-mantle boundary.

The Theoretical structure of Pluto, consisting of 1. Frozen nitrogen 2. Water ice 3. Rock. Credit: NASA/Pat Rawlings

Because the decay of radioactive elements would eventually heat the ices enough for the rock to separate from them, it is possible Pluto has a liquid water ocean beneath its mantle. In 2011, planetary scientists Guillaume Robuchon and Francis Nimmo of the University of California at Santa Cruz modeled the thermal evolution of Pluto and studied the behavior of the shell to see how the surface would be affected by the presence of an ocean below.

What they determined was that the surface of Pluto would be covered by surface fractures that span the globe, owning to changes in the temperature, tensional stresses and compressional stresses of the liquid ocean below. Though no visual data exists to support the existence of such surface features, the New Horizons mission is scheduled to be providing photographic evidence of the surface shortly.

Future Possibilities:
Another possibility is that in time, conditions will change that might allow for life to exist on Pluto. While Pluto sits well beyond our Sun’s habitable zone, both the size of our Sun, and the reach of that zone, will be subject to change. In the distant future – roughly 5.4 billion years from now – our Sun will expand into a red giant, increasing the amount of energy it gives off for a period of several million of years.

Once the core hydrogen is exhausted in 5.4 billion years, the Sun will expand into a subgiant phase and slowly double in size over about half a billion years. As it expands in size, it will consume the inner planets (including the Earth), and the habitable zone will move to the outer Solar System. Even before it becomes a red giant, the luminosity of the Sun will have nearly doubled, and Earth will be hotter than Venus is today.

This is an artist's concept of a craggy piece of solar system debris that belongs to a class of bodies called trans-Neptunian objects (TNOs). Credit: NASA
This is an artist’s concept of a craggy piece of solar system debris that belongs to a class of bodies called trans-Neptunian objects (TNOs). Credit: NASA

It will then expand more rapidly over about half a billion years until it is over two hundred times larger than it is today, and a couple of thousand times more luminous. This then starts the red-giant-branch (RGB) phase which will last around a billion years, during which time the the Sun will lose around a third of its mass.

During that time, many objects in the Kuiper Belt will warm up significantly, which will include Pluto, Eris, and countless other Trans-Neptunian Objects (TNOs).

However, given the composition of these bodies, and the relatively short window in which they will be warmer and wetter, it is not likely that life will evolve from scratch. Instead, we would probably have to transport it there from Earth, assuming humanity is still living, and seed Pluto and other surviving bodies with vegetation and terrestrial organisms.

In short, the best answer to the question – is there life on Pluto? – is a resounding maybe. Another possible answer is maybe not, with the caveat that there may indeed be life there someday (i.e. us, if we’re still around). In the meantime, all we can do is wait for data to begin coming in from New Horizons, and scan it for the telltale signs that life is indeed there right now!

We have many interesting articles about Pluto here at Universe Today. For example, here are some Interesting Facts About Pluto, How Big is Pluto, and How Long Does it Take to Get to Pluto, and Why Pluto is No Longer Considered a Planet.

To learn more, go to NASA’s New Horizons mission home page. And be sure to check out these latest images of Pluto.

What is the Pacific “Ring of Fire”?

Sarychev volcano, (located in Russia's Kuril Islands, northeast of Japan) in an early stage of eruption on June 12, 2009. Credit: NASA

What if someone were to tell you that there’s a region in the world where roughly 90% of the world’s earthquakes occur. What if they were to tell you that this region is also home to over 75% of the world’s active and dormant volcanoes, and all but 3 of the world’s 25 largest eruptions in the last 11,700 years took place here.

Chances are, you’d think twice about buying real-estate there. But strangely enough, hundreds of millions of people live in this area, and some of the most densely-packed cities in the world have been built atop its shaky faults. We are talking about the Pacific Ring of Fire, a geologically and volcanically active region that stretches from one side of the Pacific to the other.

Definition:

Also known as the circum-Pacific belt, the “Ring of Fire” is a 40,000 km (25,000 mile) horseshoe-shaped basin that is associated with a nearly continuous series of oceanic trenches, volcanic arcs, and volcanic belts and/or plate movements. This ring accounts for 452 volcanoes (active and dormant), stretching from the southern tip of South America, up along the coast of North America, across the Bering Strait, down through Japan, and into New Zealand – with several active and dormant volcanoes in Antarctica closing the ring.

Tectonic Activity:

The Ring of Fire is the direct result of plate tectonics and the movement and collisions of lithospheric plates. These plates, which constitute the outer layer of the planet, are constantly in motion atop the mantle. Sometimes they collide, pull apart, or slide alongside each other; resulting in convergent boundaries, divergent boundaries, and transform boundaries.

The Pacific Ring of Fire, a string of volcanic regions extending from the South Pacific to South America. Credit: Public Domain

In the case of the former, subduction zones are often the result, where the heavier plate slips under the lighter plate – forming a deep trench. This subduction changes the dense mantle into buoyant magma, which rises through the crust to the Earth’s surface. Over millions of years, this rising magma creates a series of active volcanoes known as a volcanic arc.

These ocean trenches and volcanic arcs run parallel to one another. For instance, the Aleutian Islands in the U.S. state of Alaska run parallel to the Aleutian Trench. Both geographic features continue to form as the Pacific Plate subducts beneath the North American Plate. Meanwhile, the Andes Mountains of South America run parallel to the Peru-Chile Trench, created as the Nazca Plate subducts beneath the South American Plate.

In the case of divergent boundaries, these are formed when tectonic plates pull apart, forming rift valleys on the seafloor. When this happens, magma wells up in the rift as the old crust pulls itself in opposite directions, where it is cooled by seawater to form new crust. This upward movement and eventual cooling of this magma has created high ridges on the ocean floor over millions of years.

The East Pacific Rise is a site of major seafloor spreading in the Ring of Fire, located on the divergent boundary of the Pacific Plate and the Cocos Plate (west of Central America), the Nazca Plate (west of South America), and the Antarctic Plate. The largest known group of volcanoes on Earth is found underwater along the portion of the East Pacific Rise between the coasts of northern Chile and southern Peru.

Transform Plate Boundary
The different type of tectonic plate boundaries. Credit: oceanexplorer.noaa.gov

A transform boundary is formed when tectonic plates slide horizontally and parts get stuck at points of contact. Stress builds in these areas as the rest of the plates continue to move, which causes the rock to break or slip, suddenly lurching the plates forward and causing earthquakes. These areas of breakage or slippage are called faults, and the majority of Earth’s faults can be found along transform boundaries in the Ring of Fire.

The San Andreas Fault, stretching along the central west coast of North America, is one of the most active faults on the Ring of Fire. It lies on the transform boundary between the North American Plate, which is moving south, and the Pacific Plate, which is moving north. Measuring about 1,287 kilometers (800 miles) long and 16 kilometers (10 miles) deep, the fault cuts through the western part of the U.S. state of California.

Plate Boundaries:

The eastern section of the Ring of Fire is the result of the Nazca Plate and the Cocos Plate being subducted beneath the westward moving South American Plate. Meanwhile, the Cocos Plate is being subducted beneath the Caribbean Plate, in Central America. A portion of the Pacific Plate along with the small Juan de Fuca Plate are being subducted beneath the North American Plate.

Along the northern portion, the northwestward-moving Pacific plate is being subducted beneath the Aleutian Islands arc. Farther west, the Pacific plate is being subducted along the Kamchatka Peninsula arcs on south past Japan.

The Earth's Tectonic Plates. Credit: msnucleus.org
The Earth’s Tectonic Plates. Credit: msnucleus.org

The southern portion is more complex, with a number of smaller tectonic plates in collision with the Pacific plate from the Mariana Islands, the Philippines, Bougainville, Tonga, and New Zealand. This portion excludes Australia, since it lies in the center of its tectonic plate.

Indonesia lies between the Ring of Fire along the northeastern islands adjacent to and including New Guinea and the Alpide belt along the south and west from Sumatra, Java, Bali, Flores, and Timor. The famous and very active San Andreas Fault zone of California is a transform fault which offsets a portion of the East Pacific Rise under southwestern United States and Mexico.

Volcanic Activity:

Most of the active volcanoes on The Ring of Fire are found on its western edge, from the Kamchatka Peninsula in Russia, through the islands of Japan and Southeast Asia, to New Zealand. Mount Ruapehu in New Zealand is one of the more active volcanoes in the Ring of Fire, with yearly minor eruptions, and major eruptions occurring about every 50 years.

Krakatau, perhaps better known as Krakatoa, is an island volcano in Indonesia. Krakatoa erupts less often than Mount Ruapehu, but much more spectacularly. Beneath Krakatoa, the denser Australian Plate is being subducted beneath the Eurasian Plate. An infamous eruption in 1883 destroyed the entire island, sending volcanic gas, volcanic ash, and rocks as high as 80 kilometers (50 miles) in the air. A new island volcano, Anak Krakatau, has been forming with minor eruptions ever since.

Mount Fuji, Japan
Mount Fuji, Japan, as seen from the ISS. Credit: NASA

Mount Fuji, Japan’s tallest and most famous mountain, is an active volcano in the Ring of Fire. Mount Fuji last erupted in 1707, but recent earthquake activity in eastern Japan may have put the volcano in a “critical state.” Mount Fuji sits at a “triple junction,” where three tectonic plates (the Amur Plate, Okhotsk Plate, and Philippine Plate) interact.

The Ring of Fire’s eastern half also has a number of active volcanic areas, including the Aleutian Islands, the Cascade Mountains in the western U.S., the Trans-Mexican Volcanic Belt, and the Andes Mountains. Mount St. Helens, in the U.S. state of Washington, is an active volcano in the Cascade Mountains.

Below Mount St. Helens, both the Juan de Fuca and Pacific plates are being subducted beneath the North American Plate. Its historic 1980 eruption lasted 9 hours and covered 11 U.S. states with tons of volcanic ash. The eruption caused the deaths of 57 people, over a billion dollars in property damage, and reduced hundreds of square miles to wasteland.

Popocatépetl is one of the most active and dangerous volcanoes in the Ring of Fire, with 15 recorded eruptions since 1519.  The volcano lies on the Trans-Mexican Volcanic Belt, which is the result of the small Cocos Plate subducting beneath the North American Plate. Located close to the urban areas of Mexico City and Puebla, Popocatépetl poses a risk to the more than 20 million people that live close enough to be threatened by a destructive eruption.

Map of the Earth showing fault lines (blue) and zones of volcanic activity (red). Credit: zmescience.com
Map of the Earth showing the relation between fault lines (blue) and zones of volcanic activity (red). Credit: zmescience.com

Earthquakes:

Scientists have known for some time that the majority of the seismic activity occurs along plate boundaries. Hence why roughly 90% of the world’s earthquakes – which is estimated to be around 500,000 a year, one-fifth of which are detectable – occur around the Pacific Rim, where multiple plate boundaries exist.

As a result, earthquakes are a regular occurrence in places like Japan, Indonesia and New Zealand in Asia and the South Pacific; Alaska, British Columbia, California and Mexico in North America; and El Salvador, Guatemala, Peru and Chile in Central and South America. Where fault lines run beneath the ocean, larger earthquakes in these regions also trigger tsunamis.

The most well-known tsumanis to take place in the Ring of Fire include the 2004 Indian Ocean earthquake and tsunami. This was the most devastating tsunami of its kind in modern times, killing around 230,000 people and laying waste to communities throughout Indonesia, Thailand, and Southern Asia.

In 2010, an earthquake triggered a tsunami which caused 4334 confirmed deaths and devastating several coastal towns in south-central Chile, including the port at Talcahuano. The earthquake also generated a blackout that affected 93 percent of the Chilean population.

In 2011, an earthquake off the Pacific coast of Tohoku led to a tsunami that struck Japan and led to 5,891 deaths, 6,152 injuries, and 2,584 people to be declared missing across twenty prefectures. The tsunami also caused meltdowns at three reactors in the Fukushima Daiichi Nuclear Power Plant complex.

The Ring of Fire is a crucial region for many reasons. It serves as one of the main boundary regions for the tectonic plates of over half of the globe. It also affects the lives of millions if not billions of people who live in these regions. For many of the people who live in the Pacific Ring of Fire, the reality of a volcanic eruption or earthquake is commonplace and a challenge they have come to deal with over time.

At the same time, the volcanic activity has also provided many valuable resources, such as rich farmland and the possibility of tapping geothermal activity for heating and electricity. As always, nature gives with one hand and takes with the other!

If you have enjoyed this article there are several others on Universe Today that you will find interesting. Here is one called 10 Interesting Facts About Volcanoes. There is also a great article about plate tectonics.

You can also find some good resources online. There is a companion site for the PBS program Savage Earth that talks about the Ring of Fire. You can also check out the USGS site to see a detailed map of the Pacific Ring of Fire and more detailed information about plate tectonics.

You can also listen to Astronomy Cast. Episode 141 talks about volcanoes.

Why Can’t We See the Center of the Milky Way?

NGC 1300, a spiral, barred galaxy viewed nearly face-on by the Hubble Space Telescope. Credit: NASA/ESA/Hubble

For millennia, human beings have stared up at the night sky and stood in awe of the Milky Way. Today, stargazers and amateur astronomers continue in this tradition, knowing that what they are witnessing is in fact a collection of hundreds of millions of stars and dust clouds, not to mention billions of other worlds.

But one has to wonder, if we can see the glowing band of the Milky Way, why can’t we see what lies towards the center of our galaxy? Assuming we are looking in the right direction, shouldn’t we able to see that big, bright bulge of stars with the naked eye? You know the one I mean, it’s in all the pictures!

Unfortunately, in answering this question, a number of reality checks have to be made. When it is dark enough, and conditions are clear, the dusty ring of the Milky Way can certainly be discerned in the night sky. However, we can still only see about 6,000 light years into the disk with the naked eye, and relying on the visible spectrum. Here’s a rundown on why that is.

Size and Structure:

First of all, the sheer size of our galaxy is enough to boggle the mind. NASA estimates that the Milky Way is between 100,000 – 120,000 light-years in diameter – though some information suggests it may be as much as 150,000 – 180,000 light-years across. Since one light year is about 9.5 x 10¹²km, this makes the diameter of the Milky Way galaxy approximately 9.5 x 10¹⁷ – 1.14 x 10¹⁸ km in diameter.

To put that in layman’s terms, that 950 quadrillion (590 quadrillion miles) to 1.14 quintillion km (7oo septendecillion miles). The Milky Way is also estimated to contain 100–400 billion stars, (although that could be as high as one trillion), and may have as many as 100 billion planets.

At the center, measuring approx. 10,000 light-years in diameter, is the tightly-packed group of stars known as the “bulge”. At the very center of this bulge is an intense radio source, named Sagittarius A*, which is likely to be a supermassive black hole that contains 4.1 million times the mass of our Sun.

We, in our humble Solar System, are roughly 28,000 light years away from it. In short, this region is simply too far for us to see with the naked eye. However, there is more to it than just that…

Radio image of the night sky. Credit: Max Planck Institute for Radio Astronomy, generated by Glyn Haslam.

Low Surface Brightness:

In addition to being a spiral barred galaxy, the Milky Way is what is known as a Low Surface Brightness (LSB) galaxy –  a classification that refers to galaxies where their surface brightness is, when viewed from Earth, at least one magnitude lower than the ambient night sky. Essentially, this means that the sky needs to be darker than about 20.2 magnitude per square arcsecond in order for the Milky Way to be seen.

This makes the Milky Way difficult to see from any location on Earth where light pollution is common – such as urban or suburban locations – or when stray light from the Moon is a factor. But even when conditions are optimal, there still only so much we can see with the naked eye, for reasons that have much to do with everything that lies between us and the galactic core.

Dust and Gas:

Though it may not look like it to the casual observer, the Milky Way is full of dust and gas. This matter is known as as the interstellar medium, a disc that makes up a whopping 10-15% of the luminous/visible matter in our galaxy and fills the long spaces in between the stars. The thickness of the dust deflects visible light (as is explained here), leaving only infrared light to pass through the dust.

"This dazzling infrared image from NASA's Spitzer Space Telescope shows hundreds of thousands of stars crowded into the swirling core of our spiral Milky Way galaxy. In visible-light pictures, this region cannot be seen at all because dust lying between Earth and the galactic center blocks our view. Credit: NASA/JPL-Caltech
This dazzling infrared image from NASA’s Spitzer Space Telescope showing hundreds of thousands of stars crowded into the swirling core of our spiral Milky Way galaxy. Credit: NASA/JPL-Caltech

This makes infrared telescopes like the Spitzer Space Telescope extremely valuable tools in mapping and studying the galaxy, since it can peer through the dust and haze to give us extraordinarily clear views of what is going on at the heart of the galaxy and in star-forming regions. However, when looking in the visual spectrum, light from Earth, and the interference effect of dust and gas limit how far we can see.

Limited Instrumentation:

Astronomers have been staring up at the stars for thousands of years. However, it was only in comparatively recent times that they even knew what they were looking at. For instance, in his book Meteorologica, Aristotle (384–322 BC) wrote that the Greek philosophers Anaxagoras (ca. 500–428 BCE) and Democritus (460–370 BCE) had proposed that the Milky Way might consist of distant stars.

However, Aristotle himself believed the Milky Way was be caused by “the ignition of the fiery exhalation of some stars which were large, numerous and close together” and that these ignitions takes place in the upper part of the atmosphere. Like many of Aristotle’s theories, this would remain canon for western scholars until the 16th and 17th centuries, at which time, modern astronomy would begin to take root.

Meanwhile, in the Islamic world, many medieval scholars took a different view. For example, Persian astronomer Abu Rayhan al-Biruni (973–1048) proposed that the Milky Way is “a collection of countless fragments of the nature of nebulous stars”. Ibn Qayyim Al-Jawziyya (1292–1350) of Damascus similarly proposed that the Milky Way is “a myriad of tiny stars packed together in the sphere of the fixed stars” and that these stars are larger than planets.

Persian astronomer Nasir al-Din al-Tusi (1201–1274) also claimed in his book Tadhkira that: “The Milky Way, i.e. the Galaxy, is made up of a very large number of small, tightly clustered stars, which, on account of their concentration and smallness, seem to be cloudy patches. Because of this, it was likened to milk in color.”

Despite these theoretical breakthroughs, it was not until 1610, when Galileo Galilei turned his telescope towards the heavens, that proof existed to back up these claims. With the help of telescopes, astronomers realized for the first time that there were many, many more stars in the sky than the ones we can see, and that all of the ones that we can see are a part of the Milky Way.

Over a century later, William Herschel created the first theoretical diagram of what the Milky Way (1785) looked like. In it, he described the shape of the Milky Way as a large, cloud-like collection of stars, and claimed the Solar System was close to the center. Though erroneous, this was the first attempt at hypothesizing what our cosmic backyard looked like.

It was not until the 20th century that astronomers were able to get an accurate picture of what our Galaxy actually looks like. This began with astronomer Harlow Shapely measuring the distributions and locations of globular star clusters. From this, he determined that the center of the Milky Way was 28,000 light years from Earth, and that the center was a bulge, rather than a flat area.

This annotated artist's conception illustrates our current understanding of the structure of the Milky Way galaxy. Image Credit: NASA
This annotated artist’s conception illustrates our current understanding of the structure of the Milky Way galaxy. Image Credit: NASA

In 1923, astronomer Edwin Hubble used the largest telescope of his day at the Mt. Wilson Observatory near Pasadena, Calif., to observe galaxies beyond our own. By observing what spiral galaxies look like throughout the universe, astronomers and scientists were able to get an idea of what our own looks like.

Since that time, the ability to observe our galaxy through multiple wavelengths (i.e. radio waves, infrared, x-rays, gamma-rays) and not just the visible spectrum has helped us to get an even better picture. In addition, the development of space telescopes – such as Hubble, Spitzer, WISE, and Kepler – have been instrumental in allowing us to make observations that are not subject to interference from our atmosphere or meteorological conditions.

But despite our best efforts, we are still limited by a combination of perspective, size, and visibility barriers. So far, all pictures that depict our galaxy are either artist’s renditions or pictures of other spiral galaxies. Until quite recently in our history, it was very difficult for scientists to gauge what the Milky Way looks like, mainly because we’re embedded inside it.

To get an actual view of the Milky Way Galaxy, several things would need to happen. First, we would need a camera that worked in space that had a wide field of view (aka. Hubble, Spitzer, etc). Then we’d need to fly that camera to a spot that’s roughly 100,000 light years above the Milky Way and point it back at Earth. With our current propulsion technology, that would take 2.2 billion years to accomplish.

Milky Way in infrared. Image credit: COBE

Fortunately, as noted already, astronomers have a few additional wavelengths they can use to see into the galaxy, and these are making much more of the galaxy visible. In addition to seeing more stars and more star clusters, we’re able to see more of the center of our Galaxy as well, which includes the supermassive black hole that has been theorized as existing there.

For some time, astronomers have had name for the region of sky that is obscured by the Milky Way – the “Zone of Avoidance“. Back in the days when astronomers could only make visual observations, the Zone of Avoidance took up about 20% of the night sky. But by observing in other wavelengths, like infrared, x-ray, gamma rays, and especially radio waves, astronomers can see all but about 10% of the sky. What’s on the other side of that 10% is mostly a mystery.

In short, progress is being made. But until such time that we can send a ship beyond our Galaxy that can take snapshots and beam them back to us, all within the space of our own lifetimes, we’ll be dependent on what we can observe from the inside.

We have many interesting articles on the Milky Way here at Universe Today. For example, here’s What is the Milky Way? And here’s an article on why it’s called The Milky Way, how big it is, why it rotates, and what the closest galaxy is to it.

And here are 10 Facts About the Milky Way. And be sure to check out our Guide to Space section on the Milky Way.

And be to sure to check out Universe Today’s interview with Dr. Andrea Ghez, Professor of Astronomy at UCLA, talking about what is at the center of our Galaxy.

What Causes Lightning?

A lightning storm striking down in a rural area. Credit: noaanews.noaa.gov

Thunder and lightning. When it comes to the forces of nature, few other things have inspired as much fear, reverence, or fascination – not to mention legends, mythos, and religious representations. As with all things in the natural world, what was originally seen as a act by the Gods (or other supernatural causes) has since come to be recognized as a natural phenomena.

But despite all that human beings have learned over the centuries, a degree of mystery remains when it comes to lightning. Experiments have been conducted since the time of Benjamin Franklin; however, we are still heavily reliant on theories as to how lighting behaves.

Description:
By definition, lightning is a sudden electrostatic discharge during an electrical storm. This discharge allows charged regions in the atmosphere to temporarily equalize themselves, when they strike an object on the ground. Although lightning is always accompanied by the sound of thunder, distant lightning may be seen but be too far away for the thunder to be heard.

Types:
Lightning can take one of three forms, which are defined by what is at the “end” of the branch channel (i.e. lightning bolt). For example, there is intra-cloud lighting (IC), which takes place between electrically charged regions of a cloud; cloud-to-cloud (CC) lighting, where it occurs between one functional thundercloud and another; and cloud-to-ground (CG) lightning, which primarily originates in the thundercloud and terminates on an Earth surface (but may also occur in the reverse direction).

Multiple paths of cloud-to-cloud lightning, Swifts Creek, Australia.. Credit: fir0002/flagstaffotos.com.au

Intra-cloud lightning most commonly occurs between the upper (or “anvil”) portion and lower reaches of a given thunderstorm. In such instances, the observer may see only a flash of light without hearing any thunder. The term “heat-lightning” is often applied here, due to the association between locally experienced warmth and the distant lightning flashes.

In the case of cloud-to-cloud lightning, the charge typically originates from beneath or within the anvil and scrambles through the upper cloud layers of a thunderstorm, normally generating a lightning bolt with multiple branches.

Cloud-to-ground (CG) is the best known type of lightning, though it is the third-most common – accounting for approximately 25% cases worldwide. In this case, the lightning takes the form of a discharge between a thundercloud and the ground, and is usually negative in polarity and initiated by a stepped branch moving down from the cloud.

CG lightning is the best known because, unlike other forms of lightning, it terminates on a physical object (most often the Earth), and therefore lends itself to being measured by instruments. In addition, it poses the greatest threat to life and property, so understanding its behavior is seen as a necessity.

 Frequency of lightning strikes throughout the world, based on data from NASA. Credit: Wikipedia/Citynoise
Frequency of lightning strikes throughout the world, based on data from NASA. Credit: Wikipedia/Citynoise

Properties:
Lighting originates when wind updrafts and downdrafts take place in the atmosphere, creating a charging mechanism that separates electric charges in clouds – leaving negative charges at the bottom and positive charges at the top. As the charge at the bottom of the cloud keeps growing, the potential difference between cloud and ground, which is positively charged, grows as well.

When a breakdown at the bottom of the cloud creates a pocket of positive charge, an electrostatic discharge channel forms and begins traveling downwards in steps tens of meters in length. In the case of IC or CC lightning, this channel is then drawn to other pockets of positive charges regions. In the case of CG strikes, the stepped leader is attracted to the positively charged ground.

Many factors affect the frequency, distribution, strength and physical properties of a “typical” lightning flash in a particular region of the world. These include ground elevation, latitude, prevailing wind currents, relative humidity, proximity to warm and cold bodies of water, etc. To a certain degree, the ratio between IC, CC and CG lightning may also vary by season in middle latitudes.

About 70% of lightning occurs over land in the tropics where atmospheric convection is the greatest. This occurs from both the mixture of warmer and colder air masses, as well as differences in moisture concentrations, and it generally happens at the boundaries between them. In the tropics, where the freezing level is generally higher in the atmosphere, only 10% of lightning flashes are CG. At the latitude of Norway (around 60° North latitude), where the freezing elevation is lower, 50% of lightning is CG.

Lightning strikes captured from space above Rome in 2012. Credit: ESA/NASA/André Kuipers
A series of lightning strikes imaged by the Nightpod camera aboard the ISS above Rome in 2012. Credit: ESA/NASA/André Kuipers

Effects:
In general, lightning has three measurable effects on the surrounding environment. First, there is the direct effect of a lightning strike itself, in which structural damage or even physical harm can result. When lighting strikes a tree, it vaporizes sap, which can result in the trunk exploding or a large branches snapping off and falling to the ground.

When lightning strikes sand, soil surrounding the plasma channel may melt, forming tubular structures called fulgurites. Buildings or tall structures hit by lightning may be damaged as the lightning seeks unintended paths to ground. And though roughly 90% of people struck by lightning survive, humans or animals struck by lightning may suffer severe injury due to internal organ and nervous system damage.

Thunder is also a direct result of electrostatic discharge. Because the plasma channel superheats the air in its immediate vicinity, the gaseous molecules undergo a rapid increase in pressure and thus expand outward from the lightning creating an audible shock wave (aka. thunder). Since the sound waves propagate not from a single source, but along the length of the lightning’s path, the origin’s varying distances can generate a rolling or rumbling effect.

High-energy radiation also results from a lightning strike. These include x-rays and gamma rays, which have been confirmed through observations using electric field and X-ray detectors, and space-based telescopes.

A fulgerite formed in sand y Credit: blogs.discovermagazine.com
A fulgerite formed in sandy patch as a result of a lightning strike. Credit: blogs.discovermagazine.com

Studies:
The first systematic and scientific study of lightning was performed by Benjamin Franklin during the second half of the 18th century. Prior to this, scientists had discerned how electricity could be separated into positive and negative charges and stored. They had also noted a connection between sparks produced in a laboratory and lightning.

Franklin theorized that clouds are electrically charged, from which it followed that lightning itself was electrical. Initially, he proposed testing this theory by placing iron rod next to a grounded wire, which would be held in place nearby by an insulated wax candle. If the clouds were electrically charged as he expected, then sparks would jump between the iron rod and the grounded wire.

In 1750, he published a proposal whereby a kite would be flown in a storm to attract lightning. In 1752, Thomas Francois D’Alibard successfully conducted the experiment in France, but used a 12 meter (40 foot) iron rod instead of a kite to generate sparks. By the summer of 1752, Franklin is believed to have conducted the experiment himself during a large storm that descended on Philadelphia.

For his upgraded version of the experiment, Franking attacked a key to the kite, which was connected via a damp string to an insulating silk ribbon wrapped around the knuckles of Franklin’s hand. Franklin’s body, meanwhile, provided the conducting path for the electrical currents to the ground. In addition to showing that thunderstorms contain electricity, Franklin was able to infer that the lower part of the thunderstorm was generally negatively charged as well.

An artistic rendition of Franklin's kite experiment painted by Benjamin West. Credit: Public Domain
An artistic rendition of Franklin’s kite experiment painted by Benjamin West. Credit: Public Domain

Little significant progress was made in understanding the properties of lightning until the late 19th century when photography and spectroscopic tools became available for lightning research. Time-resolved photography was used by many scientists during this period to identify individual lightning strokes that make up a lightning discharge to the ground.

Lightning research in modern times dates from the work of C.T.R. Wilson (1869 – 1959) who was the first to use electric field measurements to estimate the structure of thunderstorm charges involved in lightning discharges. Wilson also won the Nobel Prize for the invention of the Cloud Chamber, a particle detector used to discern the presence of ionized radiation.

By the 1960’s, interest grew thanks to the intense competition brought on by the Space Age. With spacecraft and satellites being sent into orbit, there were fears that lightning could post a threat to aerospace vehicles and the solid state electronics used in their computers and instrumentation. In addition, improved measurement and observational capabilities were made possible thanks to improvements in space-based technologies.

In addition to ground-based lightning detection, several instruments aboard satellites have been constructed to observe lightning distribution. These include the Optical Transient Detector (OTD), aboard the OrbView-1 satellite launched on April 3rd, 1995, and the subsequent Lightning Imaging Sensor (LIS) aboard TRMM, which was launched on November 28th, 1997.

The Colima Volcano (Volcán de Colima) pictured on March 29, 2015 with lightning. Credit and copyright: César Cantú.

Volcanic Lightning:
Volcanic activity can produce lightning-friendly conditions in multiple ways. For instance, the powerful ejection of enormous amounts of material and gases into the atmosphere creates a dense plume of highly charged particles, which establishes the perfect conditions for lightning. In addition, the ash density and constant motion within the plume continually produces electrostatic ionization. This in turn results in frequent and powerful flashes as the plume tries to neutralize itself.

This type of thunderstorm is often referred to as a “dirty thunderstorm” due to the high solid material (ash) content.  There have been several recorded instances of volcanic lightning taking place throughout history. For example, during the eruption of Vesuvius in 79 CE, Pliny the Younger noted several powerful and frequent flashes taking place around the volcanic plume.

Extraterrestrial Lightning:
Lightning has been observed within the atmospheres of other planets in our Solar System, such as Venus, Jupiter and Saturn. In the case of Venus, the first indications that lightning may be present in the upper atmosphere were observed by the Soviet Venera and U.S. Pioneer missions in the 1970s and 1980s. Radio pulses recorded by the Venus Express spacecraft (in April 2006) were confirmed as originating from lightning on Venus.

Artist concept of Venus' surface. Credit: NASA)
Artist concept of a lightning stormVenus. Credit: NASA)

Thunderstoms that are similar to those on Earth have been observed on Jupiter. They are believed to be the result of moist convection with Jupiter’s troposphere, where convective plumes bring wet air up from the depths to the upper parts of the atmosphere, where it then condenses into clouds of about 1000 km in size.

The imaging of the night-side hemisphere of Jupiter by the Galileo in the 1990 and by the Cassini spacecraft in December of 2000 revealed that storms are always associated with lightning on Jupiter. While lighting strikes are on average a few times more powerful than those on Earth, they are apparently less frequent. A few flashes have been detected in polar regions, making Jupiter the second known planet after Earth to exhibit polar lightning.

Lighting has also been observed on Saturn. The first instance occurred in 2010 when the Cassini space probe detected flashes on the night-side of the planet, which happened to coincide with the detection of powerful electrostatic discharges. In 2012, images taken by the Cassini probe in 2011 showed how the massive storm that wrapped the northern hemisphere was also generating powerful flashes of lightning.

Once thought to be the “hammer of the Gods”, lightning has since come to be understood as a natural phenomena, and one that exists on other terrestrial worlds and even gas giants. As we come to learn more about how lighting behaves here on Earth, that knowledge could go a long way in helping us to understand weather systems on other worlds as well.

We have written many articles about lightning here at Universe Today. Here’s an article about NASA’s biggest lightning protection system. And here’s an interesting article about the possible connection between solar wind and lightning.

If you’d like more info on lightning, check out the National Oceanic & Atmospheric Administration (NOAA) Homepage. And here’s a link to NASA’s Earth Observatory.

We also have an episode of Astronomy Cast, titled Episode 51: Earth.

Newest Planet: Is it Pluto, Eris or Extrasolar?

Eris, the newest planet?

With astronomers discovering new planets and other celestial objects all the time, you may be wondering what the newest planet to be discovered is. Well, that depends on your frame of reference. If we are talking about our Solar System, then the answer used to be Pluto, which was discovered by the American astronomer Clyde William Tombaugh in 1930.

Unfortunately, Pluto lost its status as a planet in 2006 when it was reclassified as a dwarf planet. Since then, another contender has emerged for the title of “newest planet in the Solar System” – a celestial body that goes by the name of Eris – while beyond our Solar System, thousands of new planets are being discovered.

But then, the newest planet might be the most recently discovered extrasolar planet. And these are being discovered all the time.

Continue reading “Newest Planet: Is it Pluto, Eris or Extrasolar?”