Matt Williams is a space journalist and science communicator for Universe Today and Interesting Engineering. He's also a science fiction author, podcaster (Stories from Space), and Taekwon-Do instructor who lives on Vancouver Island with his wife and family.
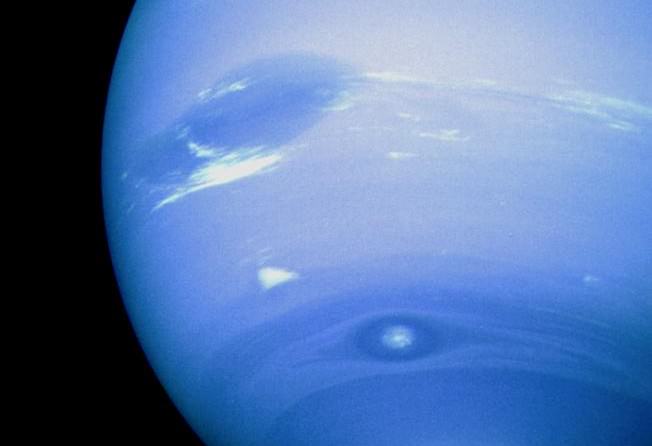
Reconstruction of Voyager 2 images showing the Great Black spot (top left), Scooter (middle), and the Small Black Spot (lower right). Credit: NASA/JPL
Our Solar System is a fascinating place. Between its eight planets and many dwarf planets, there are some serious differences in terms of orbit, composition, and temperature. Whereas conditions within the inner Solar System, where planets are terrestrial in nature, can get pretty hot, planets that orbit beyond the Frost Line – where it is cold enough that volatiles (i.e. water, ammonia, methane, CO and CO²) condense into solids – can get mighty cold!
It is in this environment that we find Neptune, the Solar System’s most distance (and hence most cold) planet. While this gas/ice giant has no “surface” to speak of, Earth-based research and flybys have been conducted that have managed to obtain accurate measurements of the temperature in the planet’s upper atmosphere. All told, the planet experiences temperatures that range from approximately 55 K (-218 °C; -360 °F) to 72 K (-200 °C; -328 °F), making it the coldest planet in the Solar System.
Orbital Characteristics:
Of all the planets in the Solar System, Neptune orbits the Sun at the greatest average distance. With a very minor eccentricity (0.0086), it orbits the Sun at an semi-major axis of approximately 30.11 AU (4,504,450,000,000 km), ranging from 29.81 AU (4.459 x 10⁹ km) at perihelion and 30.33 AU (4.537 x 10⁹ km) at aphelion.
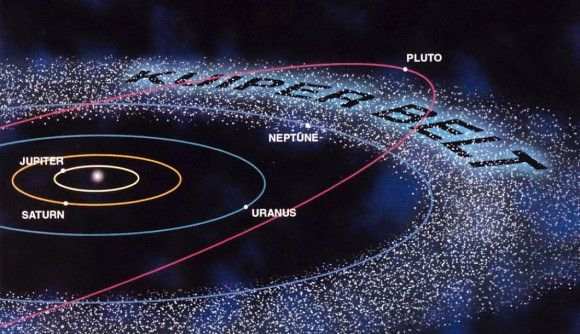
Neptune and the icy-asteroid-rich Kuiper Belt that lies beyond its orbit. Credit: NASA
Neptune takes 16 hours 6 minutes and 36 seconds (0.6713 days) to complete a single sidereal rotation, and 164.8 Earth years to complete a single orbit around the Sun. This means that a single day lasts 67% as long on Neptune, whereas a year is the equivalent of approximately 60,190 Earth days (or 89,666 Neptunian days).
Because Neptune’s axial tilt (28.32°) is similar to that of Earth (~23°) and Mars (~25°), the planet experiences similar seasonal changes. Combined with its long orbital period, this means that the seasons last for forty Earth years. In addition, the planets axial tilt also leads to variations in the length of its day, as well as variations in temperature between the northern and southern hemispheres (see below).
“Surface” Temperature:
Due to their composition, determining a surface temperature on gas or ice giants (compared to terrestrial planets or moons) is technically impossible. As a result, astronomers have relied on measurements obtained at altitudes where the atmospheric pressure is equal to 1 bar (or 100 kilo Pascals), the equivalent of air pressure here on Earth at sea level.
Color-contrasted photo showing Neptune’s atmospheric features. Credit: Erich Karkoschka
It is here on Neptune, just below the upper level clouds, that pressures reach between 1 and 5 bars (100 – 500 kPa). It is also at this level that temperatures reach their recorded high of 72 K (-201.15 °C; -330 °F). At this temperature, conditions are suitable for methane to condense, and clouds of ammonia and hydrogen sulfide are thought to form (which is what gives Neptune its characteristically dark cyan coloring).
But as with all gas and ice giants, temperatures vary on Neptune due to depth and pressure. In short, the deeper one goes into Neptune, the hotter it becomes. At its core, Neptune reaches temperatures of up to 7273 K (7000 °C; 12632 °F), which is comparable to the surface of the Sun. The huge temperature differences between Neptune’s center and its surface create huge wind storms, which can reach as high as 2,100 km/hour, making them the fastest in the Solar System.
Temperature Anomalies and Variations:
Whereas Neptune averages the coldest temperatures in the Solar System, a strange anomaly is the planet’s south pole. Here, it is 10 degrees K warmer than the rest of planet. This “hot spot” occurs because Neptune’s south pole is currently exposed to the Sun. As Neptune continues its journey around the Sun, the position of the poles will reverse. Then the northern pole will become the warmer one, and the south pole will cool down.
Neptune’s more varied weather when compared to Uranus is due in part to its higher internal heating, which is particularly perplexing for scientists. Despite the fact that Neptune is located over 50% further from the Sun than Uranus, and receives only 40% its amount of sunlight, the two planets’ surface temperatures are roughly equal.
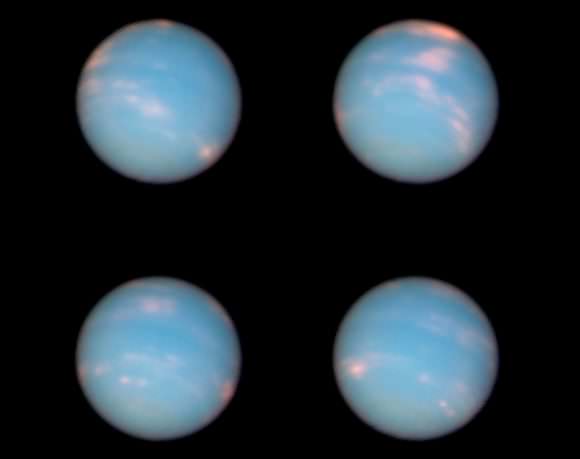
Four images of Neptune taken a few hours apart by the Hubble Space Telescope on June 25-26, 2011. Credit: NASA, ESA and the Hubble Heritage Team (STScI/AURA)
Deeper inside the layers of gas, the temperature rises steadily. This is consistent with Uranus, but oddly enough, the discrepancy is larger. Uranus only radiates 1.1 times as much energy as it receives from the Sun, whereas Neptune radiates about 2.61 times as much. Neptune is the farthest planet from the Sun, yet its internal energy is sufficient to drive the fastest planetary winds seen in the Solar System. The mechanism for this remains unknown.
And while temperatures on Pluto have been recorded as reaching lower – down to 33 K (-240 °C; -400 °F) – Pluto’s status as a dwarf planet mean that it is no longer in the same class as the others. As such, Neptune remains the coldest planet of the eight.
Few forces in nature are are impressive or frightening as a volcanic eruption. In an instant, from within the rumbling depths of the Earth, hot lava, steam, and even chunks of hot rock are spewed into the air, covering vast distances with fire and ash. And thanks to the efforts of geologists and Earth scientists over the course of many centuries, we have to come to understand a great deal about them.
However, when it comes to the nomenclature of volcanoes, a point of confusion often arises. Again and again, one of the most common questions about volcanoes is, what is the difference between lava and magma? They are both molten rock, and are both associated with volcanism. So why the separate names? As it turns out, it all comes down to location.
Earth’s Composition:
As anyone with a basic knowledge of geology will tell you, the insides of the Earth are very hot. As a terrestrial planet, its interior is differentiated between a molten, metal core, and a mantle and crust composed primarily of silicate rock. Life as we know it, consisting of all vegetation and land animals, live on the cool crust, whereas sea life inhabits the oceans that cover a large extent of this same crust.
The Earth’s layers, showing the Inner and Outer Core, the Mantle, and Crust. Credit: discovermagazine.com
However, the deeper one goes into the planet, both pressures and temperatures increase considerably. All told, Earth’s mantle extends to a depth of about 2,890 km, and is composed of silicate rocks that are rich in iron and magnesium relative to the overlying crust. Although solid, the high temperatures within the mantle cause pockets of molten rock to form.
This silicate material is less dense than the surrounding rock, and is therefore sufficiently ductile that it can flow on very long timescales. Over time, it will also reach the surface as geological forces push it upwards. This happens as a result of tectonic activity.
Basically, the cool, rigid crust is broken into pieces called tectonic plates. These plates are rigid segments that move in relation to one another at one of three types of plate boundaries. These are known as convergent boundaries, at which two plates come together; divergent boundaries, at which two plates are pulled apart; and transform boundaries, in which two plates slide past one another laterally.
Interactions between these plates are what is what is volcanic activity (best exemplified by the “Pacific Ring of Fire“) as well as mountain-building. As the tectonic plates migrate across the planet, the ocean floor is subducted – the leading edge of one plate pushing under another. At the same time, mantle material will push up at divergent boundaries, forcing molten rock to the surface.
The Earth’s Tectonic Plates. Credit: msnucleus.org
Magma:
As already noted, both lava and magma are what results from rock superheated to the point where it becomes viscous and molten. But again, the location is the key. When this molten rock is still located within the Earth, it is known as magma. The name is derived from Greek, which translate to “thick unguent” (a word used to describe a viscous substance used for ointments or lubrication).
It is composed of molten or semi-molten rock, volatiles, solids (and sometimes crystals) that are found beneath the surface of the Earth. This vicious rock usually collects in a magma chamber beneath a volcano, or solidify underground to form an intrusion. Where it forms beneath a volcano, it can then be injected into cracks in rocks or issue out of volcanoes in eruptions. The temperature of magma ranges between 600 °C and 1600 °C.
Magma is also known to exist on other terrestrial planets in the Solar System (i.e. Mercury, Venus and Mars) as well as certain moons (Earth’s Moon and Jupiter’s moon Io). In addition to stable lava tubes being observed on Mercury, the Moon and Mars, powerful volcanoes have been observed on Io that are capable of sending lava jets 500 km (300 miles) into space.
Igneous rock (aka. “fire rock”) is formed from cooled and solidified lava. Credit: geologyclass.org
Lava:
When magma reaches the surface and erupts from a volcano, it officially becomes lava. There are actually different kinds of lava depending on its thickness or viscosity. Whereas the thinnest lava can flow downhill for many kilometers (thus creating a gentle slope), thicker lavas will pile up around a volcanic vent and hardly flow at all. The thickest lava doesn’t even flow, and just plugs up the throat of a volcano, which in some cases cause violent explosions.
The term lava is usually used instead of lava flow. This describes a moving outpouring of lava, which occurs when a non-explosive effusive eruption takes place. Once a flow has stopped moving, the lava solidifies to form igneous rock. Although lava can be up to 100,000 times more viscous than water, lava can flow over great distances before cooling and solidifying.
The word “lava” comes from Italian, and is probably derived from the Latin word labes which means “a fall” or “slide”. The first use in connection with a volcanic event was apparently in a short written account by Franscesco Serao, who observed the eruption of Mount Vesuvius between May 14th and June 4th, 1737. Serao described “a flow of fiery lava” as an analogy to the flow of water and mud down the flanks of the volcano following heavy rain.
Such is the difference between magma and lava. It seems that in geology, as in real estate, its all about location!
When it comes to the other planets that make up our Solar System, some pretty stark differences become apparent. In addition to being different in terms of their sizes, composition and atmospheres from Earth, they also differ considerably in terms of their orbits. Whereas those closest to the Sun have rapid transits, and therefore comparatively short years, those farther away can take many Earth to complete a single orbit.
This is certainly the case when it comes to Jupiter, the Solar System largest and most massive planet. Given its considerable distance from the Sun, Jupiter spends the equivalent of almost twelve Earth years completing a single circuit of our Sun. Orbiting at this distance is part of what allows Jupiter to maintain its gaseous nature, and led to its formation and peculiar composition.
Orbit and Resonance:
Jupiter orbits the Sun at an average distance (semi-major axis) of 778,299,000 km (5.2 AU), ranging from 740,550,000 km (4.95 AU) at perihelion and 816,040,000 km (5.455 AU) at aphelion. At this distance, Jupiter takes 11.8618 Earth years to complete a single orbit of the Sun. In other words, a single Jovian year lasts the equivalent of 4,332.59 Earth days.
However, Jupiter’s rotation is the fastest of all the Solar System’s planets, completing a rotation on its axis in slightly less than ten hours (9 hours, 55 minutes and 30 seconds to be exact. Therefore, a single Jovian year lasts 10,475.8 Jovian solar days. This orbital period is two-fifths that of Saturn, which means that the two largest planets in our Solar System form a 5:2 orbital resonance.
Seasonal Changes:
With an axial tilt of just 3.13 degrees, Jupiter also has one of the least inclined orbits of any planet in the Solar System. Only Mercury and Venus have more vertical axes, with a tilt of 0.03° and 2.64° respectively. As a result, Jupiter does not experience seasonal changes the way the other planets do – particularly Earth (23.44°), Mars (25.19°) and Saturn (26.73°).
As a result, temperatures do not vary considerably between the northern or southern hemispheres during the course of its orbit. Measurements taken from the top of Jupiter’s clouds (which is considered to be the surface) indicate that surface temperatures vary between 165 K and 112 K (-108 °C and -161 °C). However, temperatures vary considerably due to depth, increasing drastically as one ventures closer to the core.
Formation:
Jupiter’s composition and position in the Solar System are interrelated. According to Nebular Theory, the Sun and all the planets of our Solar System began as a giant cloud of molecular gas and dust (called a solar nebula). Then, about 4.57 billion years ago, something happened that caused the cloud to collapse, which could have been the result of anything from a passing star to shock waves from a supernova.
Young stars have a disk of gas and dust around them called a protoplanetary disk. Out of this disk planets are formed, and the presence of water ice in the disc affects where different types of planets form. Credit: NASA/JPL-Caltech
From this collapse, pockets of dust and gas began to collect into denser regions. As the denser regions pulled in more and more matter, conservation of momentum caused them to begin rotating, while increasing pressure caused them to heat up. Since temperatures across this protoplanetary disk were not uniform, this caused different materials to condense at different temperatures, leading to different types of planets forming.
The dividing line for the different planets in our solar system is known as the “Frost Line”, a point in the Solar System beyond which volatiles (such as water, ammonia, methane, carbon dioxide and carbon monoxide) are able to exist in a frozen state. As a result, planets like Jupiter, which are located beyond the Frost Line, condensed out of denser materials first (like silicate rock and minerals), then were able to accumulate gases in a liquid state.
In addition to ensuring that Jupiter was able to become the massive gas giant it is today, its distance from the Sun is also what makes its orbital period much longer than that of Earth’s.
At a closest average distance of 41 million km (25,476,219 mi), Venus is the closest planet to Earth. Credit: NASA/JPL/Magellan
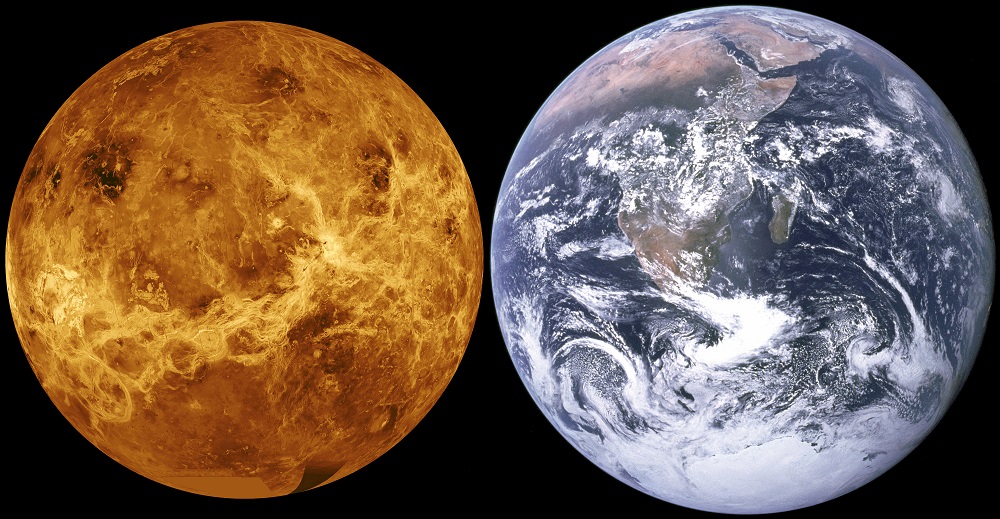
A common question when looking at the Solar System and Earth’s place in the grand scheme of it is “which planet is closest to Earth?” Aside from satisfying a person’s general curiosity, this question is also of great importance when it comes to space exploration. And as humanity contemplates mounting manned missions to neighboring planets, it also becomes one of immense practicality.
If, someday, we hope to explore, settle, and colonize other worlds, which would make for the shortest trip? Invariable, the answer is Venus. Often referred to as “Earth’s Twin“, Venus has many similarities to Earth. It is a terrestrial planet, it orbits within the Sun’s habitable zone, and it has an atmosphere that is believed to have once been like Earth’s. Combined with its proximity to us, its little wonder we consider it our twin.
Venus’ Orbit:
Venus orbits the Sun at an average distance (semi-major axis) of 108,208,000 km (0.723 AUs), ranging between 107,477,000 km (0.718 AU) at perihelion and 108,939,000 km (0.728 AU) at aphelion. This makes Venus’ orbit the least eccentric of all the planets in the Solar System. In fact, with an eccentricity of less than 0.01, its orbit is almost circular.
Earth and Venus’ orbit compared. Credit: Sky and Telescope
When Venus lies between Earth and the Sun, it experiences what is known as an inferior conjunction. It is at this point that it makes its closest approach to Earth (and that of any planet) with an average distance of 41 million km (25,476,219 mi). On average, Venus achieves an inferior conjunction with Earth every 584 days.
And because of the decreasing eccentricity of Earth’s orbit, the minimum distances will become greater over the next tens of thousands of years. So not only is it Earth’s closest neighbor (when it makes its closest approach), but it will continue to get cozier with us as time goes on!
Venus vs. Mars:
As Earth’s other neighbor, Mars also has a “close” relationship with Earth. Orbiting our Sun at an average distance of 227,939,200 km (1.52 AU), Mars’ highly eccentric orbit (0.0934) takes it from a distance of 206,700,000 km (1.38 AU) at perihelion to 249,200,000 km (1.666 AU) at aphelion. This makes its orbit one of the more eccentric in our Solar System, second only to Mercury
For Earth and Mars to be at their closest, both planets needs to be on the same side of the Sun, Mars needs to be at its closest distance from the Sun (perihelion), and Earth needs to be at its farthest (aphelion). This is known as opposition, a time when Mars appears as one of the brightest objects in the sky (as a red star), rivaling that of Venus or Jupiter.
The eccentricity in Mars’ orbit means that it is . Credit: NASA
But even at this point, the distance between Mars and Earth ranges considerably. The closest approach to take place occurred back in 2003, when Earth and Mars were only 56 million km (3,4796,787 mi) apart. And this was the closest they’d been in 50,000 years. The next closest approach will take place on July 27th, 2018, when Earth and Mars will be at a distance of 57.6 million km (35.8 mi) from each other.
It has also been estimated that the closest theoretical approach would take place at a distance of 54.6 million km (33.9 million mi). However, no such approach has been documented in all of recorded history. One would be forced to wonder then why so much of humanity’s exploration efforts (past, present and future) are aimed at Mars. But when one considers just how horrible Venus’ environment is in comparison, the answer becomes clear.
Exploration Efforts:
The study and exploration of Venus has been difficult over the years, owing to the combination of its dense atmosphere and harsh surface environment. Its surface has been imaged only in recent history, thanks to the development of radar imaging. However, many robotic spacecraft and even a few landers have made the journey and discovered much about Earth’s closest neighbor.
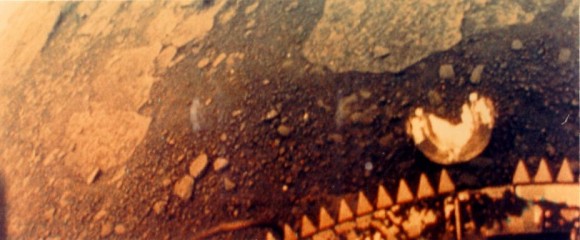
The first attempts were made by the Soviets in the 1960s through the Venera Program. Whereas the first mission (Venera-1) failed due to loss of contact, the second (Venera-3) became the first man-made object to enter the atmosphere and strike the surface of another planet (on March 1st, 1966). This was followed by the Venera-4 spacecraft, which launched on June 12th, 1967, and reached the planet roughly four months later (on October 18th).
The first color pictures taken of the surface of Venus by the Venera-13 space probe. Credit: NASA
NASA conducted similar missions under the Mariner program. The Mariner 2 mission, which launched on December 14th, 1962, became the first successful interplanetary mission and passed within 34,833 km (21,644 mi) of Venus’ surface. Between the late 60s and mid 70s, NASA conducted several more flybys using Mariner probes – such as the Mariner 5 mission on Oct. 19th, 1967 and the Mariner 10mission on Feb. 5th, 1974.
The Soviets launched six more Venera probes between the late 60s and 1975, and four additional missions between the late 70s and early 80s. Venera-5, Venera-6, and Venera-7 all entered Venus’ atmosphere and returned critical data to Earth. Venera 11 and Venera 12 detected Venusian electrical storms; and Venera 13 andVenera 14 landed on the planet and took the first color photographs of the surface. The program came to a close in October 1983, when Venera 15 and Venera 16 were placed in orbit to conduct mapping of the Venusian terrain with synthetic aperture radar.
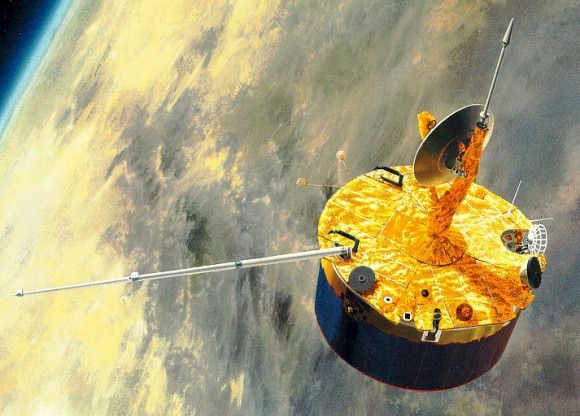
By the late seventies, NASA commenced the Pioneer Venus Project, which consisted of two separate missions. The first was the Pioneer Venus Orbiter, which inserted into an elliptical orbit around Venus (Dec. 4th, 1978) to study its atmosphere and map the surface. The second, the Pioneer Venus Multiprobe, released four probes which entered the atmosphere on Dec. 9th, 1978, returning data on its composition, winds and heat fluxes.
Artist’s impression of NASA’s Pioneer Venus Orbiter in orbit around Venus. Credit: NASA
In 1985, the Soviets participated in a collaborative venture with several European states to launch the Vega Program. This two-spacecraft initiative was intended to take advantage of the appearance of Halley’s Comet in the inner Solar System, and combine a mission to it with a flyby of Venus. While en route to Halley on June 11th and 15th, the two Vega spacecraft dropped Venera-style probes into Venus’ atmosphere to map its weather.
NASA’s Magellan spacecraft was launched on May 4th, 1989, with a mission to map the surface of Venus with radar. In the course of its four and a half year mission, Magellan provided the most high-resolution images to date of the planet, was able to map 98% of the surface and 95% of its gravity field. In 1994, at the end of its mission, Magellan was sent to its destruction into the atmosphere of Venus to quantify its density.
Venus was observed by the Galileo and Cassini spacecraft during flybys on their respective missions to the outer planets, but Magellan was the last dedicated mission to Venus for over a decade. It was not until October of 2006 and June of 2007 that the MESSENGER probe would conduct a flyby of Venus (and collect data) in order to slow its trajectory for an eventual orbital insertion of Mercury.
The Venus Express, a probe designed and built by the European Space Agency, successfully assumed polar orbit around Venus on April 11th, 2006. This probe conducted a detailed study of the Venusian atmosphere and clouds, and discovered an ozone layer and a swirling double-vortex at the south pole before concluding its mission in December of 2014. Since December 7th, 2015, Japan’s Akatsuki has been in a highly elliptical Venusian orbit.
Because of its hostile surface and atmospheric conditions, Venus has proven to be a tough nut to crack, despite its proximity to Earth. In spite of that, NASA, Roscosmos, and India’s ISRO all have plans for sending additional missions to Venus in the coming years to learn more about our twin planet. And as the century progresses, and if certain people get their way, we may even attempt to send human colonists there!
Light moves at different wavelengths, represented here by the different colors seen in a prism. Credit: NASA and ESA
Ever since Democritus – a Greek philosopher who lived between the 5th and 4th century’s BCE – argued that all of existence was made up of tiny indivisible atoms, scientists have been speculating as to the true nature of light. Whereas scientists ventured back and forth between the notion that light was a particle or a wave until the modern era, the 20th century led to breakthroughs that showed us that it behaves as both.
These included the discovery of the electron, the development of quantum theory, and Einstein’s Theory of Relativity. However, there remains many unanswered questions about light, many of which arise from its dual nature. For instance, how is it that light can be apparently without mass, but still behave as a particle? And how can it behave like a wave and pass through a vacuum, when all other waves require a medium to propagate?
Theory of Light to the 19th Century:
During the Scientific Revolution, scientists began moving away from Aristotelian scientific theories that had been seen as accepted canon for centuries. This included rejecting Aristotle’s theory of light, which viewed it as being a disturbance in the air (one of his four “elements” that composed matter), and embracing the more mechanistic view that light was composed of indivisible atoms.
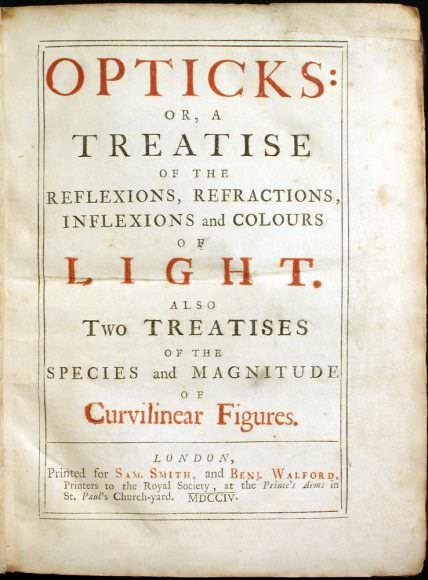
In many ways, this theory had been previewed by atomists of Classical Antiquity – such as Democritus and Lucretius – both of whom viewed light as a unit of matter given off by the sun. By the 17th century, several scientists emerged who accepted this view, stating that light was made up of discrete particles (or “corpuscles”). This included Pierre Gassendi, a contemporary of René Descartes, Thomas Hobbes, Robert Boyle, and most famously, Sir Isaac Newton.
The first edition of Newton’s Opticks: or, a treatise of the reflexions, refractions, inflexions and colours of light (1704). Credit: Public Domain.
Newton’s corpuscular theory was an elaboration of his view of reality as an interaction of material points through forces. This theory would remain the accepted scientific view for more than 100 years, the principles of which were explained in his 1704 treatise “Opticks, or, a Treatise of the Reflections, Refractions, Inflections, and Colours of Light“. According to Newton, the principles of light could be summed as follows:
Every source of light emits large numbers of tiny particles known as corpuscles in a medium surrounding the source.
These corpuscles are perfectly elastic, rigid, and weightless.
This represented a challenge to “wave theory”, which had been advocated by 17th century Dutch astronomer Christiaan Huygens. . These theories were first communicated in 1678 to the Paris Academy of Sciences and were published in 1690 in his “Traité de la lumière“ (“Treatise on Light“). In it, he argued a revised version of Descartes views, in which the speed of light is infinite and propagated by means of spherical waves emitted along the wave front.
Double-Slit Experiment:
By the early 19th century, scientists began to break with corpuscular theory. This was due in part to the fact that corpuscular theory failed to adequately explain the diffraction, interference and polarization of light, but was also because of various experiments that seemed to confirm the still-competing view that light behaved as a wave.
The most famous of these was arguably the Double-Slit Experiment, which was originally conducted by English polymath Thomas Young in 1801 (though Sir Isaac Newton is believed to have conducted something similar in his own time). In Young’s version of the experiment, he used a slip of paper with slits cut into it, and then pointed a light source at them to measure how light passed through it.
According to classical (i.e. Newtonian) particle theory, the results of the experiment should have corresponded to the slits, the impacts on the screen appearing in two vertical lines. Instead, the results showed that the coherent beams of light were interfering, creating a pattern of bright and dark bands on the screen. This contradicted classical particle theory, in which particles do not interfere with each other, but merely collide.
The only possible explanation for this pattern of interference was that the light beams were in fact behaving as waves. Thus, this experiment dispelled the notion that light consisted of corpuscles and played a vital part in the acceptance of the wave theory of light. However subsequent research, involving the discovery of the electron and electromagnetic radiation, would lead to scientists considering yet again that light behaved as a particle too, thus giving rise to wave-particle duality theory.
Electromagnetism and Special Relativity:
Prior to the 19th and 20th centuries, the speed of light had already been determined. The first recorded measurements were performed by Danish astronomer Ole Rømer, who demonstrated in 1676 using light measurements from Jupiter’s moon Io to show that light travels at a finite speed (rather than instantaneously).
Prof. Albert Einstein delivering the 11th Josiah Willard Gibbs lecture at the meeting of the American Association for the Advancement of Science on Dec. 28th, 1934. Credit: AP Photo
By the late 19th century, James Clerk Maxwell proposed that light was an electromagnetic wave, and devised several equations (known as Maxwell’s equations) to describe how electric and magnetic fields are generated and altered by each other and by charges and currents. By conducting measurements of different types of radiation (magnetic fields, ultraviolet and infrared radiation), he was able to calculate the speed of light in a vacuum (represented as c).
In 1905, Albert Einstein published “On the Electrodynamics of Moving Bodies”, in which he advanced one of his most famous theories and overturned centuries of accepted notions and orthodoxies. In his paper, he postulated that the speed of light was the same in all inertial reference frames, regardless of the motion of the light source or the position of the observer.
Exploring the consequences of this theory is what led him to propose his theory of Special Relativity, which reconciled Maxwell’s equations for electricity and magnetism with the laws of mechanics, simplified the mathematical calculations, and accorded with the directly observed speed of light and accounted for the observed aberrations. It also demonstrated that the speed of light had relevance outside the context of light and electromagnetism.
For one, it introduced the idea that major changes occur when things move close the speed of light, including the time-space frame of a moving body appearing to slow down and contract in the direction of motion when measured in the frame of the observer. After centuries of increasingly precise measurements, the speed of light was determined to be 299,792,458 m/s in 1975.
Einstein and the Photon:
In 1905, Einstein also helped to resolve a great deal of confusion surrounding the behavior of electromagnetic radiation when he proposed that electrons are emitted from atoms when they absorb energy from light. Known as the photoelectric effect, Einstein based his idea on Planck’s earlier work with “black bodies” – materials that absorb electromagnetic energy instead of reflecting it (i.e. white bodies).
At the time, Einstein’s photoelectric effect was attempt to explain the “black body problem”, in which a black body emits electromagnetic radiation due to the object’s heat. This was a persistent problem in the world of physics, arising from the discovery of the electron, which had only happened eight years previous (thanks to British physicists led by J.J. Thompson and experiments using cathode ray tubes).
At the time, scientists still believed that electromagnetic energy behaved as a wave, and were therefore hoping to be able to explain it in terms of classical physics. Einstein’s explanation represented a break with this, asserting that electromagnetic radiation behaved in ways that were consistent with a particle – a quantized form of light which he named “photons”. For this discovery, Einstein was awarded the Nobel Prize in 1921.
Wave-Particle Duality:
Subsequent theories on the behavior of light would further refine this idea, which included French physicist Louis-Victor de Broglie calculating the wavelength at which light functioned. This was followed by Heisenberg’s “uncertainty principle” (which stated that measuring the position of a photon accurately would disturb measurements of it momentum and vice versa), and Schrödinger’s paradox that claimed that all particles have a “wave function”.
In accordance with quantum mechanical explanation, Schrodinger proposed that all the information about a particle (in this case, a photon) is encoded in its wave function, a complex-valued function roughly analogous to the amplitude of a wave at each point in space. At some location, the measurement of the wave function will randomly “collapse”, or rather “decohere”, to a sharply peaked function. This was illustrated in Schrödinger famous paradox involving a closed box, a cat, and a vial of poison (known as the “Schrödinger Cat” paradox).
Artist’s impression of two photons travelling at different wavelengths, resulting in different- colored light. Credit: NASA/Sonoma State University/Aurore Simonnet
According to his theory, wave function also evolves according to a differential equation (aka. the Schrödinger equation). For particles with mass, this equation has solutions; but for particles with no mass, no solution existed. Further experiments involving the Double-Slit Experiment confirmed the dual nature of photons. where measuring devices were incorporated to observe the photons as they passed through the slits.
When this was done, the photons appeared in the form of particles and their impacts on the screen corresponded to the slits – tiny particle-sized spots distributed in straight vertical lines. By placing an observation device in place, the wave function of the photons collapsed and the light behaved as classical particles once more. As predicted by Schrödinger, this could only be resolved by claiming that light has a wave function, and that observing it causes the range of behavioral possibilities to collapse to the point where its behavior becomes predictable.
The development of Quantum Field Theory (QFT) was devised in the following decades to resolve much of the ambiguity around wave-particle duality. And in time, this theory was shown to apply to other particles and fundamental forces of interaction (such as weak and strong nuclear forces). Today, photons are part of the Standard Model of particle physics, where they are classified as boson – a class of subatomic particles that are force carriers and have no mass.
So how does light travel? Basically, traveling at incredible speeds (299 792 458 m/s) and at different wavelengths, depending on its energy. It also behaves as both a wave and a particle, able to propagate through mediums (like air and water) as well as space. It has no mass, but can still be absorbed, reflected, or refracted if it comes in contact with a medium. And in the end, the only thing that can truly divert it, or arrest it, is gravity (i.e. a black hole).
What we have learned about light and electromagnetism has been intrinsic to the revolution which took place in physics in the early 20th century, a revolution that we have been grappling with ever since. Thanks to the efforts of scientists like Maxwell, Planck, Einstein, Heisenberg and Schrodinger, we have learned much, but still have much to learn.
For instance, its interaction with gravity (along with weak and strong nuclear forces) remains a mystery. Unlocking this, and thus discovering a Theory of Everything (ToE) is something astronomers and physicists look forward to. Someday, we just might have it all figured out!
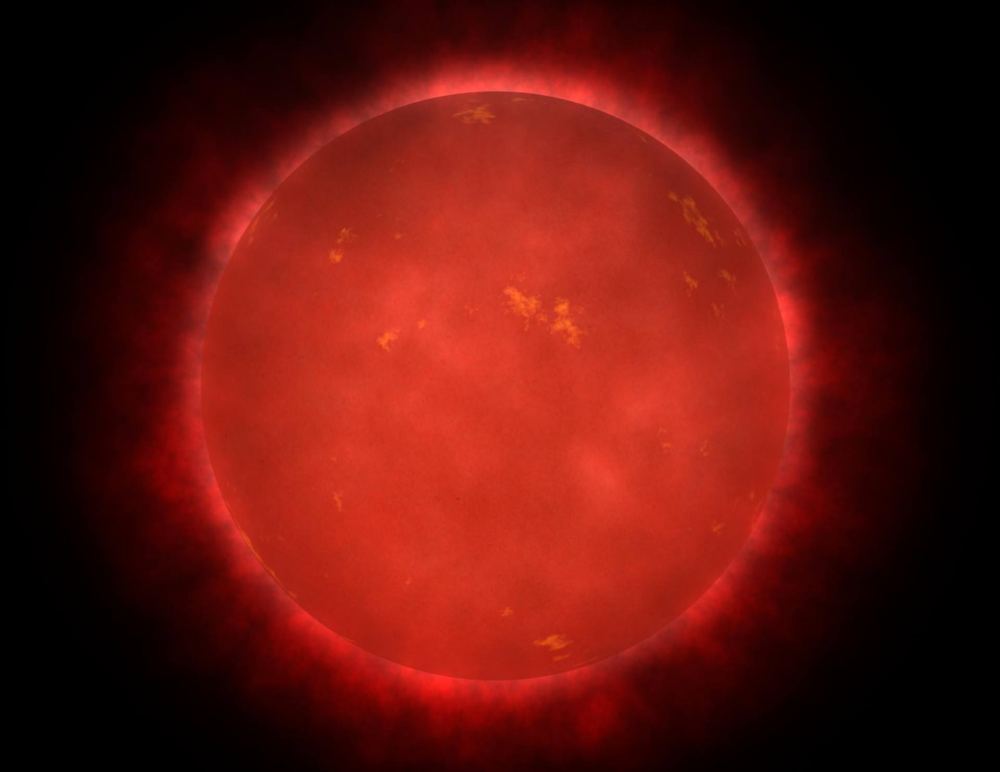
Artist's impression of a red giant star. If the star is in a binary pair, what happens to its sibling? Credit:NASA/ Walt Feimer
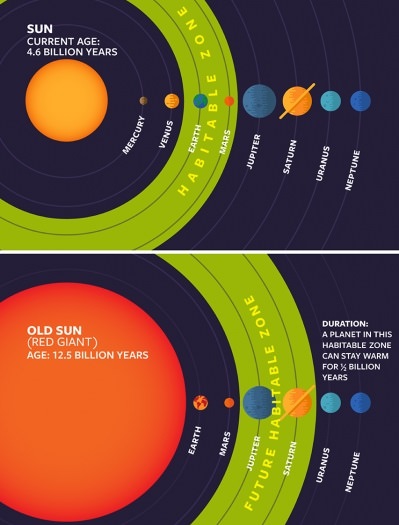
It is an well-known fact that all stars have a lifespan. This begins with their formation, then continues through their Main Sequence phase (which constitutes the majority of their life) before ending in death. In most cases, stars will swell up to several hundred times their normal size as they exit the Main Sequence phase of their life, during which time they will likely consume any planets that orbit closely to them.
However, for planets that orbit the star at greater distances (beyond the system’s “Frost Line“, essentially), conditions might actually become warm enough for them to support life. And according to new research which comes from the Carl Sagan Institute at Cornell University, this situation could last for some star systems into the billions of years, giving rise to entirely new forms of extra-terrestrial life!
In approximately 5.4 billion years from now, our Sun will exit its Main Sequence phase. Having exhausted the hydrogen fuel in its core, the inert helium ash that has built up there will become unstable and collapse under its own weight. This will cause the core to heat up and get denser, which in turn will cause the Sun to grow in size and enter what is known as the Red Giant-Branch (RGB) phase of its evolution.
The life cycle of a Sun-like star, from its birth on the left side of the frame to its evolution into a red giant on the right after billions of years. Credit: ESO/M. Kornmesser
This period will begin with our Sun becoming a subgiant, in which it will slowly double in size over the course of about half a billion years. It will then spend the next half a billion years expanding more rapidly, until it is 200 times its current size and several thousands times more luminous. It will then officially be a red giant star, eventually expanding to the point where it reaches beyond Mars’ orbit.
As we explored in a previous article, planet Earth will not survive our Sun becoming a Red Giant – nor will Mercury, Venus or Mars. But beyond the “Frost Line”, where it is cold enough that volatile compounds – such as water, ammonia, methane, carbon dioxide and carbon monoxide – remain in a frozen state, the remain gas giants, ice giants, and dwarf planets will survive. Not only that, but a massive thaw will set in.
In short, when the star expands, its “habitable zone” will likely do the same, encompassing the orbits of Jupiter and Saturn. When this happens, formerly uninhabitable places – like the Jovian and Cronian moons – could suddenly become inhabitable. The same holds true for many other stars in the Universe, all of which are fated to become Red Giants as they near the end of their lifespans.
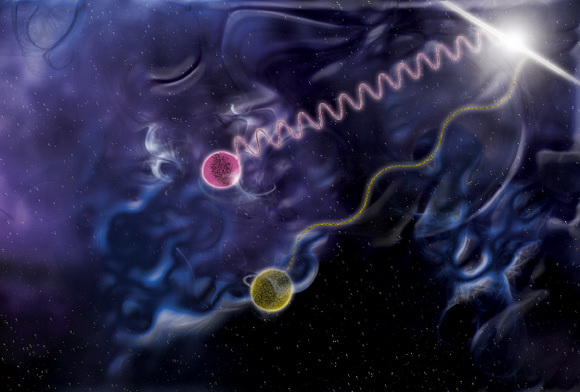
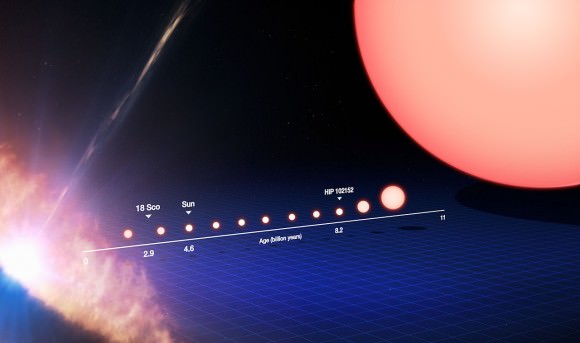
However, when our Sun reaches its Red Giant Branch phase, it is only expected to have 120 million years of active life left. This is not quite enough time for new lifeforms to emerge, evolve and become truly complex (i.e. like humans and other species of mammals). But according to a recent research study that appeared in The Astrophysical Journal – titled “Habitable Zone of Post-Main Sequence Stars” – some planets may be able to remain habitable around other red giant stars in our Universe for much longer – up to 9 billion years or more in some cases!
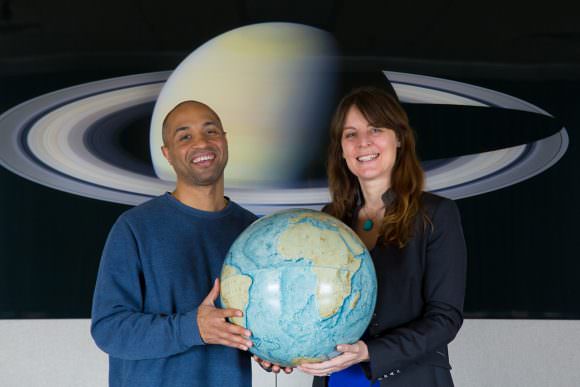
Ramses Ramirez (left) and Lisa Kaltenegger are on the hunt for other places in the universe where life can thrive. Credit: Chris Kitchen/University Photo
To put that in perspective, nine billion years is close to twice the current age of Earth. So assuming that the worlds in question also have the right mix of elements, they will have ample time to give rise to new and complex forms of life. The study’s co-author, Professor Lisa Kaltennegeris, is also the director of the Carl Sagan Institute. As such, she is no stranger to searching for life in other parts of the Universe. As she explained to Universe Today via email:
“We found that planets – depending on how big their Sun is (the smaller the star, the longer the planet can stay habitable) – can stay nice and warm for up to 9 Billion years. That makes an old star an interesting place to look for life. It could have started sub-surface (e.g. in a frozen ocean) and then when the ice melts, the gases that life breaths in and out can escape into the atmosphere – what allows astronomers to pick them up as signatures of life. Or for the smallest stars, the time a formerly frozen planet can be nice and warm is up to 9 billion years. Thus life could potentially even get started in that time.”
Using existing models of stars and their evolution – i.e. one-dimensional radiative-convective climate and stellar evolutionary models – for their study, Kaltenegger and Ramirez were able to calculate the distances of the habitable zones (HZ) around a series of post-Main Sequence (post-MS) stars. Ramses M. Ramirez – a research associate at the Carl Sagan Institute and the lead author of the paper – explained the research process to Universe Today via email:
“We used stellar evolutionary models that tell us how stellar quantities, mainly the brightness, radius, and temperature all change with time as the star ages through the red giant phase. We also used a climate model to then compute how much energy each star is outputting at the boundaries of the habitable zone. Knowing this and the stellar brightness mentioned above, we can compute the distances to these habitable zone boundaries.”
After several billions years, yellow suns (like ours) become Red Giants, expanding to several hundred times their normal size. Credit: Wendy Kenigsburg
At the same time, they considered how this kind of stellar evolution could effect the atmosphere of the star’s planets. As a star expands, it loses mass and ejects it outward in the form of solar wind. For planets that orbit close to a star, or those that have low surface gravity, they may find some or all of their atmospheres blasted away. On the other hand, planets with sufficient mass (or positioned at a safe distance) could maintain most of their atmospheres.
“The stellar winds from this mass loss erodes planetary atmospheres, which we also compute as a function of time,” said Ramirez. “As the star loses mass, the solar system conserves angular momentum by moving outwards. So, we also take into account how the orbits move out with time.” By using models that incorporated the rate of stellar and atmospheric loss during the Red Giant Branch (RGB) and Asymptotic Giant Branch (AGB) phases of star, they were able to determine how this would play out for planets that ranged in size from super-Moons to super-Earths.
What they found was that a planet can stay in a post-HS HZ for eons or more, depending on how hot the star is, and figuring for metallicities that are similar to our Sun’s. As Ramirez explained:
“The main result is that the maximum time that a planet can remain in this red giant habitable zone of hot stars is 200 million years. For our coolest star (M1), the maximum time a planet can stay within this red giant habitable zone is 9 billion years. Those results assume metallicity levels similar to those of our Sun. A star with a higher percentage of metals takes longer to fuse the non-metals (H, He..etc) and so these maximum times can increase some more, up to about a factor of two.”
Could Europa’s cracked, icy surface thaw and give rise to a new habitable world when our Sun becomes a Red Giant in a few billion years? Credit: NASA/JPL-Caltech/SETI Institute
Within the context of our Solar System, this could mean that in a few billion years, worlds like Europa and Enceladus (which are already suspected of having life beneath their icy surfaces) might get a shot at becoming full-fledged habitable worlds. As Ramirez summarized beautifully:
“This means that the post-main-sequence is another potentially interesting phase of stellar evolution from a habitability standpoint. Long after the inner system of planets have been turned into sizzling wastelands by the expanding, growing red giant star, there could be potentially habitable abodes farther away from the chaos. If they are frozen worlds, like Europa, the ice would melt, potentially unveiling any preexisting life. Such pre-existing life may be detectable by future missions/telescopes looking for atmospheric biosignatures.”
But perhaps the most exciting take-away from their research study was their conclusion that planets orbiting within their star’s post-MS habitable zones would be doing so at distances that would make them detectable using direct imaging techniques. So not only are the odds of finding life around older stars better than previously thought, we should have no trouble in spotting them using current exoplanet-hunting techniques!
It is also worth noting that Kaltenegger and Dr. Ramirez have submitted a second paper for publication, in which they provide a list of 23 red giant stars within 100 light-years of Earth. Knowing that these stars, all of which are in our stellar neighborhood, could have life-sustaining worlds within their habitable zones should provide additional opportunities for planet hunters in the coming years.
And be sure to check out this video from Cornellcast, where Prof. Kaltenegger shares what inspires her scientific curiosity and how Cornell’s scientists are working to find proof of extra-terrestrial life.
Here on Earth, we tend to take air resistance (aka. “drag”) for granted. We just assume that when we throw a ball, launch an aircraft, deorbit a spacecraft, or fire a bullet from a gun, that the act of it traveling through our atmosphere will naturally slow it down. But what is the reason for this? Just how is air able to slow an object down, whether it is in free-fall or in flight?
Because of our reliance on air travel, our enthusiasm for space exploration, and our love of sports and making things airborne (including ourselves), understanding air resistance is key to understanding physics, and an integral part of many scientific disciplines. As part of the subdiscipline known as fluid dynamics, it applies to fields of aerodynamics, hydrodynamics, astrophysics, and nuclear physics (to name a few).
Definition:
By definition, air resistance describes the forces that are in opposition to the relative motion of an object as it passes through the air. These drag forces act opposite to the oncoming flow velocity, thus slowing the object down. Unlike other resistance forces, drag depends directly on velocity, since it is the component of the net aerodynamic force acting opposite to the direction of the movement.
Another way to put it would be to say that air resistance is the result of collisions of the object’s leading surface with air molecules. It can therefore be said that the two most common factors that have a direct effect upon the amount of air resistance are the speed of the object and the cross-sectional area of the object. Ergo, both increased speeds and cross-sectional areas will result in an increased amount of air resistance.
Picture showing a bullet and the air flowing around it, giving visual representation to air resistance. Credits: Andrew Davidhazy/Rochester Institute of Technology
In terms of aerodynamics and flight, drag refers to both the forces acting opposite of thrust, as well as the forces working perpendicular to it (i.e. lift). In astrodynamics, atmospheric drag is both a positive and a negative force depending on the situation. It is both a drain on fuel and efficiency during lift-off and a fuel savings when a spacecraft is returning to Earth from orbit.
Calculating Air Resistance:
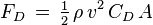
Air resistance is usually calculated using the “drag equation”, which determines the force experienced by an object moving through a fluid or gas at relatively large velocity. This can be expressed mathematically as:
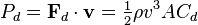
In this equation, FD represents the drag force, p is the density of the fluid, v is the speed of the object relative to sound, A is the cross-section area, and CD is the the drag coefficient. The result is what is called “quadratic drag”. Once this is determined, calculating the amount of power needed to overcome the drag involves a similar process, which can be expressed mathematically as:
Here, Pd is the power needed to overcome the force of drag, Fd is the drag force, v is the velocity, p is the density of the fluid, v is the speed of the object relative to sound, A is the cross-section area, and Cd is the the drag coefficient. As it shows, power needs are the cube of the velocity, so if it takes 10 horsepower to go 80 kph, it will take 80 horsepower to go 160 kph. In short, a doubling of speed requires an application of eight times the amount of power.
An F-22 Raptor reaching a velocity high enough to achieve a sonic boom. Credit: strangesounds.org
Types of Air Resistance:
There are three main types of drag in aerodynamics – Lift Induced, Parasitic, and Wave. Each affects an objects ability to stay aloft as well as the power and fuel needed to keep it there. Lift induced (or just induced) drag occurs as the result of the creation of lift on a three-dimensional lifting body (wing or fuselage). It has two primary components: vortex drag and lift-induced viscous drag.
The vortices derive from the turbulent mixing of air of varying pressure on the upper and lower surfaces of the body. These are needed to create lift. As the lift increases, so does the lift-induced drag. For an aircraft this means that as the angle of attack and the lift coefficient increase to the point of stall, so does the lift-induced drag.
By contrast, parasitic drag is caused by moving a solid object through a fluid. This type of drag is made up of multiple components, which includes “form drag” and “skin friction drag”. In aviation, induced drag tends to be greater at lower speeds because a high angle of attack is required to maintain lift, so as speed increases this drag becomes much less, but parasitic drag increases because the fluid is flowing faster around protruding objects increasing friction. The combined overall drag curve is minimal at some airspeeds and will be at or close to its optimal efficiency.
Space Shuttle Columbia launching on its maiden voyage on April 12th, 1981. Credit: NASA
Wave drag (compressibility drag) is created by the presence of a body moving at high speed through a compressible fluid. In aerodynamics, wave drag consists of multiple components depending on the speed regime of the flight. In transonic flight – at speeds of Mach 0.5 or greater, but still less than Mach 1.0 (aka. speed of sound) – wave drag is the result of local supersonic flow.
Supersonic flow occurs on bodies traveling well below the speed of sound, as the local speed of air on a body increases when it accelerates over the body. In short, aircraft flying at transonic speeds often incur wave drag as a result. This increases as the speed of the aircraft nears the sound barrier of Mach 1.0, before becoming a supersonic object.
In supersonic flight, wave drag is the result of oblique shockwaves formed at the leading and trailing edges of the body. In highly supersonic flows bow waves will form instead. At supersonic speeds, wave drag is commonly separated into two components, supersonic lift-dependent wave drag and supersonic volume-dependent wave drag.
Understanding the role air frictions plays with flight, knowing its mechanics, and knowing the kinds of power needed to overcome it, are all crucial when it comes to aerospace and space exploration. Knowing all this will also be critical when it comes time to explore other planets in our Solar System, and in other star systems altogether!
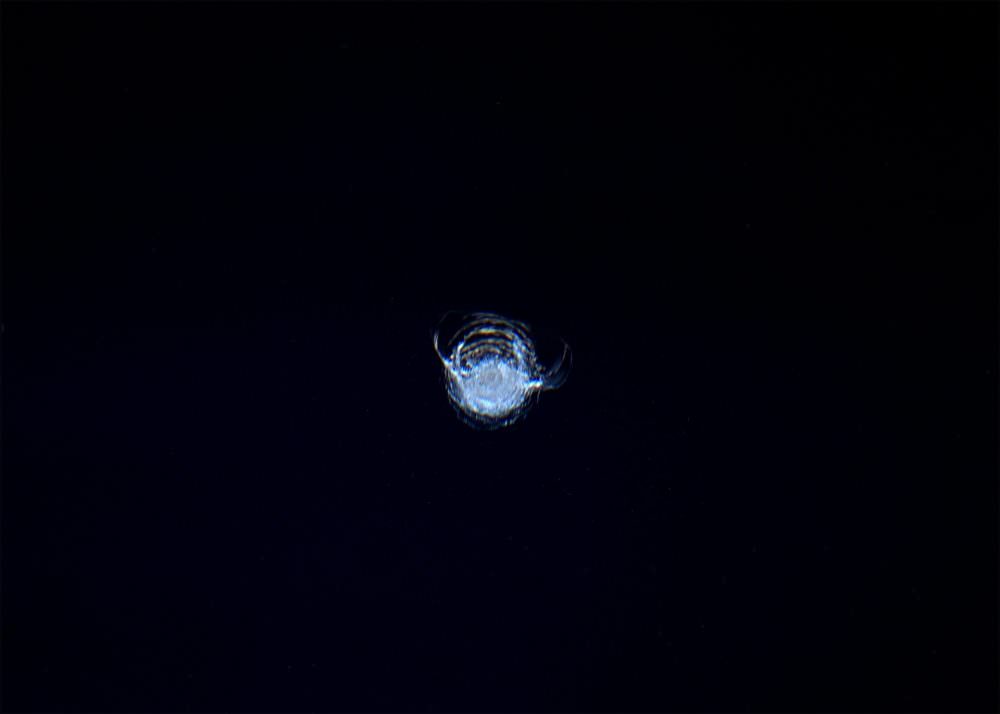
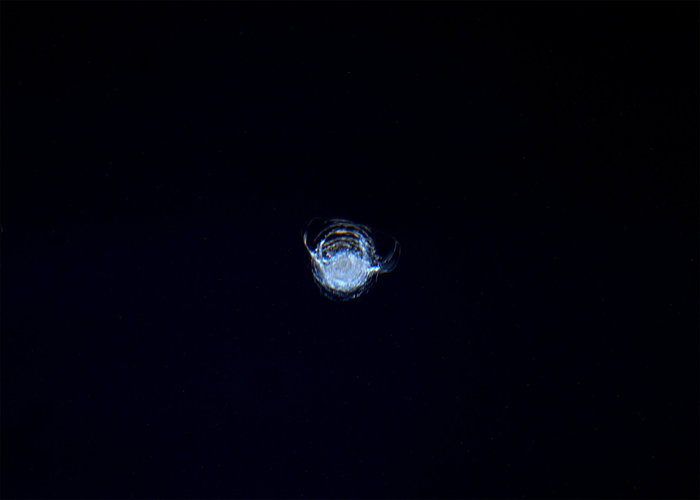
The chip in the ISS' Cupola window, photographed by astronaut Tim Peake. Credit: ESA/NASA/Tim Peake
It is known as the Cupola, an observation and work area that was installed aboard the International Space Station in 2010. In addition to giving the crew ample visibility to support the control of the Station’s robotic arms, it is also the best seat in the house when it comes to viewing Earth, celestial objects and visiting vehicles. Little wonder then why sp many breathtaking pictures have been taken from inside it over the years.
So you can imagine how frustrating it must be for the crew when a tiny artificial object (aka. space debris) collides with the Cupola’s windows and causes it to chip. And thanks to astronaut Tim Peake and a recent photo he chose to share with the world, people here on Earth are able to see just how this looks from the receiving end for the first time.
An international team of researchers have produced the largest 3-D map of the universe to date, which validates Einstein's theory of General Relativity. Credit: NAOJ/CFHT/ SDSS
On June 30th, 1905, Albert Einstein started a revolution with the publication of theory of Special Relativity. This theory, among other things, stated that the speed of light in a vacuum is the same for all observers, regardless of the source. In 1915, he followed this up with the publication of his theory of General Relativity, which asserted that gravity has a warping effect on space-time. For over a century, these theories have been an essential tool in astrophysics, explaining the behavior of the Universe on the large scale.
However, since the 1990s, astronomers have been aware of the fact that the Universe is expanding at an accelerated rate. In an effort to explain the mechanics behind this, suggestions have ranged from the possible existence of an invisible energy (i.e. Dark Energy) to the possibility that Einstein’s field equations of General Relativity could be breaking down. But thanks to the recent work of an international research team, it is now known that Einstein had it right all along.
The X-37B Orbital Test Vehicle taxiing on the flightline on March 30th, 2010, at the Astrotech facility in Titusville, Florida. Credit: USAF
For years now, the program to develop the X-37B spacecraft has been shrouded in secrecy. Originally intended as part of a NASA project to develop a reusable unmanned spacecraft, this Boeing-designed spaceplane was taken over by the Department of Defense in 2004. And while it has been successfully tested on multiple occasions, there remain some unanswered questions as to its intended purpose and what has been taking place during these flights.
This, predictably, has lead to all kinds of rumors and speculation, with some suggesting that it could be a spy plane while others think that it is intended to deliver space-based weapons. It’s latest mission – which was dubbed OTV-4 (Orbital Test Vehicle-4) – has been especially clandestine. And after nearly a year in orbit, it remains unclear what the X37B has been doing up there all this time.


