If you could see a black hole with your own eyeballs, what would you see?
Here on the Guide to Space production team: We love everything about Black Holes.
We like how they’re terrifying and completely conflict with our day to day experience of how stuff should work. We like how they completely mess you up before absolutely tearing you pieces, and we like how they ruin time and space and everything nearby.
We like them so much, we even enjoy giving them cute nick names like “Kevin”.
So I’m now going to show you images and animations of black holes.
Should you find this either too exciting or terrifying and need a breather I suggest you pause the video and walk around the block and try not to think about how absolutely terrifying these things are.
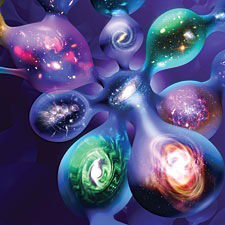
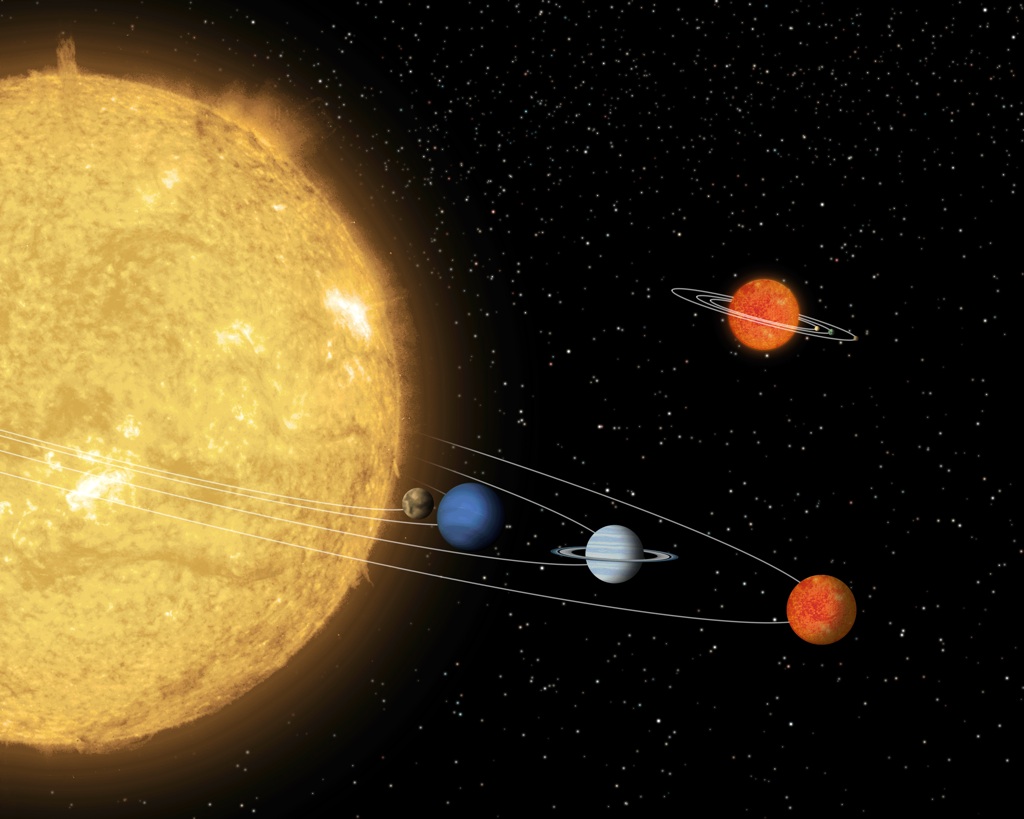
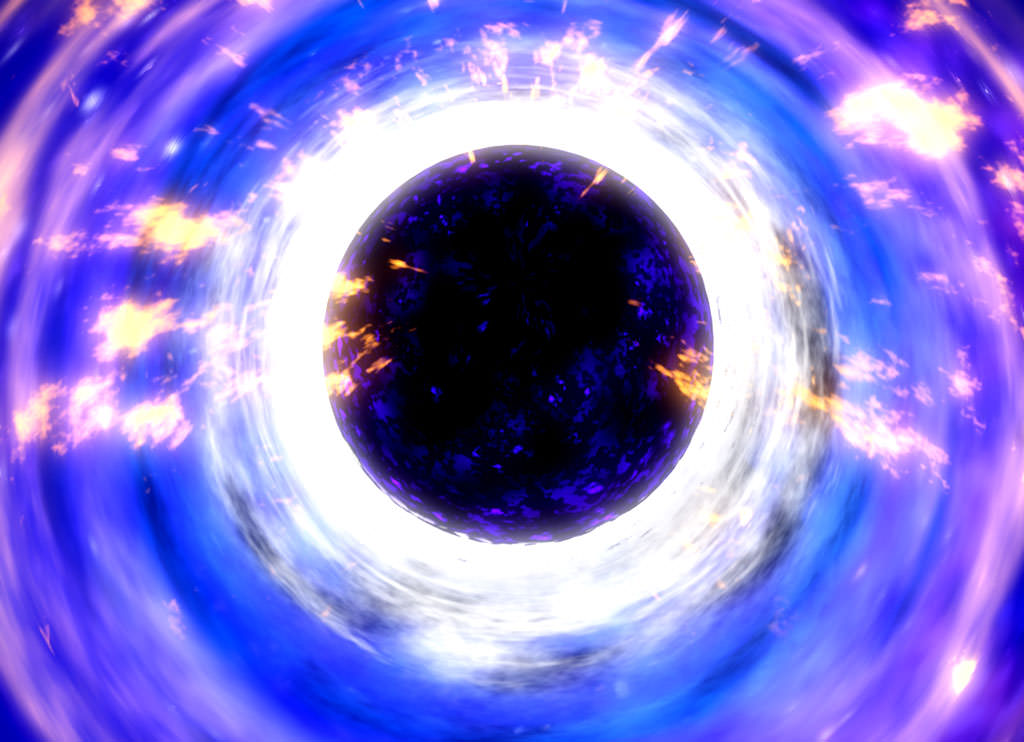
Those are just the artist’s illustrations, who’ve no doubt been awe inspired in the same way the rest of us have… but those people have never ACTUALLY seen one. Have they?
Is that what a black hole would really look like? Or are these just pictures of lasercorns?
I’ve got good news!
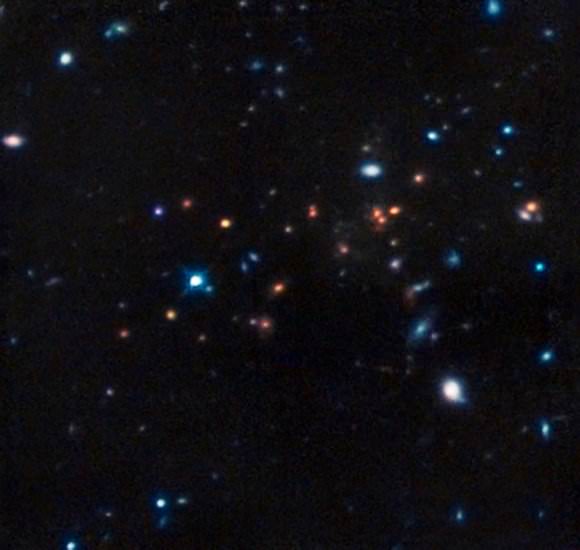
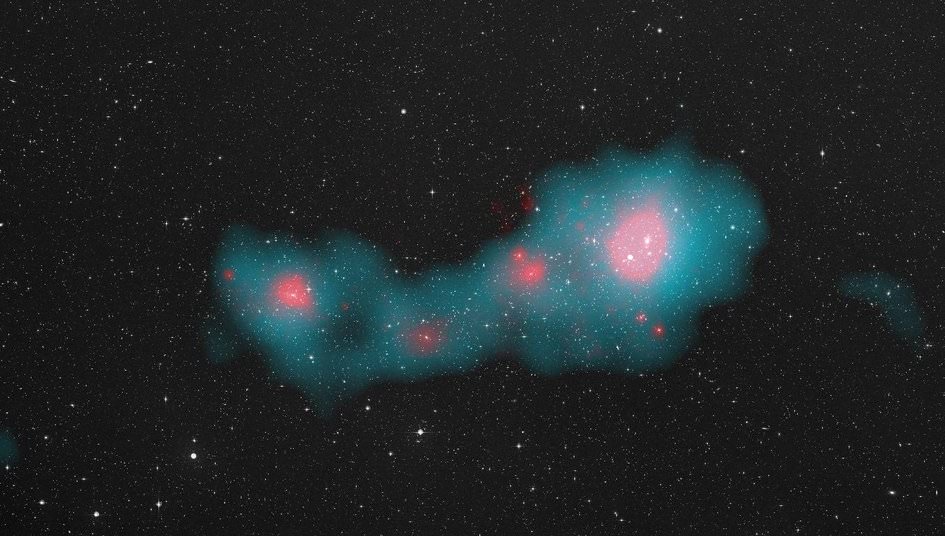
Here’s a picture of a real black hole. Can’t see much? That’s because it’s more than 25,000 light years away. It’s got 4 million times the mass of the Sun, and it’s still a tiny dot.
So, how do we know it’s there? The answer is awful. Even if we can’t see them directly, they make such a giant mess of things in their neighborhood we can still figure out where they are.
For an actively feeding black hole, we see a disk of material surrounding it.
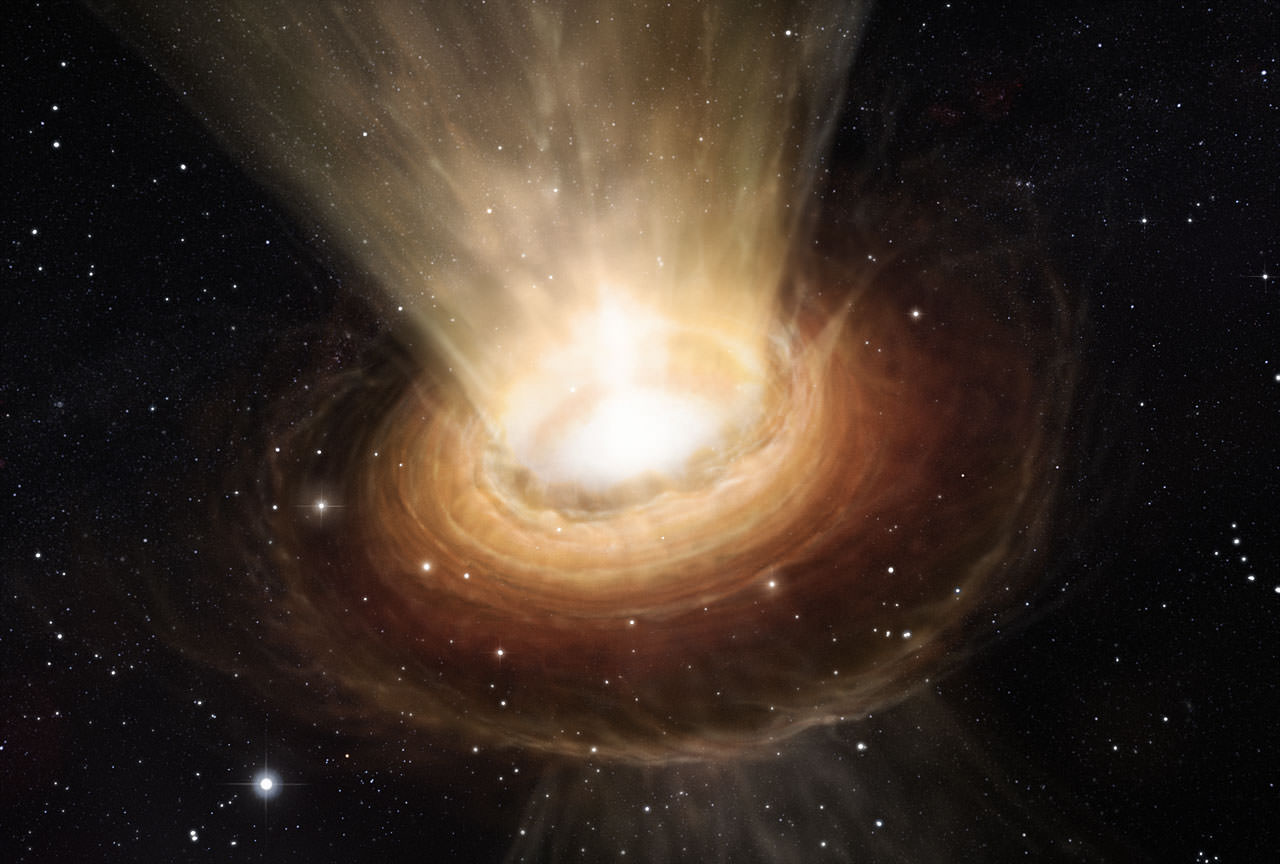
Quasars are the jets emanating from active black holes, and we see them billions of light-years away. As you get closer, this area would get brighter until it was like you were close to millions of stars. The radiation would be overwhelming. Closer and closer, there would be region of total darkness, that’s the black hole itself.
For non-active or “sleepy time” black holes, we’d only see the distortion of light around them as light is bent by gravity. As you got closer and closer, there’d be less light coming from the area around the black hole. No photons can be reflected by it. You’d then pass a region called the photon sphere, where light is orbiting the black hole. You’d see the whole Universe as a swirling jumble of mixed up photons.
Next the event horizon, where light can’t escape. You could look out into the Universe and see the distorted light coming from everywhere, but the singularity itself would still be dark. Is it a single point, or a sphere? Astronomers don’t know yet.
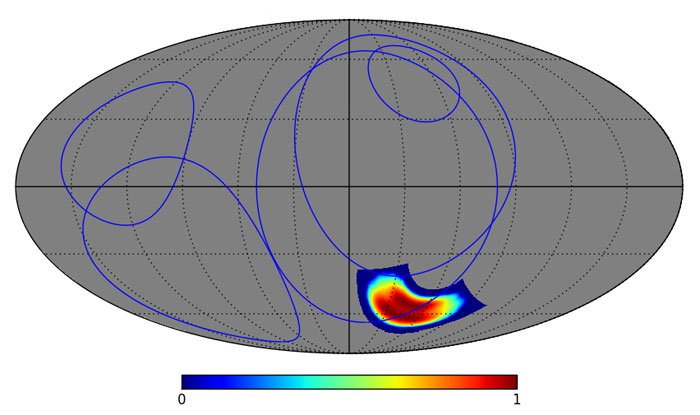
A new telescope is in the works called the Event Horizon Telescope. It would combine the light from a worldwide constellation of radio telescopes. They’re hoping to actually image the event horizon of a black hole, and could have their first images within 5 years. Hopefully it’ll never get loaded onto a ship with Sam Neill.
Here’s hoping we’re just a few years away from knowing what black holes look like directly. But once seen, they can never be unseen. What do you think it’ll look like? tell us in the comments below!
And if you like what you see, come check out our Patreon page and find out how you can get these videos early while helping us bring you more great content!