In-situ Resource Utilization (ISRU) is our best bet for “living off the land” for a future Martian base, but tracking down those resources is no easy task. As of now, we have two options - send a rover to a specific location to scout it, or monitor it from orbit. Since rovers are expensive, and there are an absolute ton of sites that we would eventually want to scout, doing so from orbit would seem a better option. But monitoring for temperature, one of the most important orbital scans we can do, is notoriously blurry - based in part on the fact that most of the main instruments used to collect data on it are a few decades old. Now, a paper from researchers at Curtin University in Australia presented at the International Astronautical Congress meeting last September uses a fancy AI-like algorithm to improve that thermal resolution, and, as a result, provided a much better map to some of the most important resources we’ll be looking for.
That data was looking at a physical property known as thermal inertia (TI). Basically, it’s a material’s resistance to external temperature changes. For example, after the Sun sets on Mars, fine dust and loose sand will lose their heat rapidly, showing up as dark spots on an infrared map. On the other hand, bedrock and large boulders hold onto the heat from the Sun for much longer, glowing brightly on infrared images for much longer.
By mapping these hot and cold sites, scientists can figure out plenty of physical properties about the surface - most notably its grain size and rock abundance. But other features, such as the presence of water ice, or the safety of landing sites for rovers or large geotechnical construction equipment, can also be gleaned from these images - if they are sharp enough.
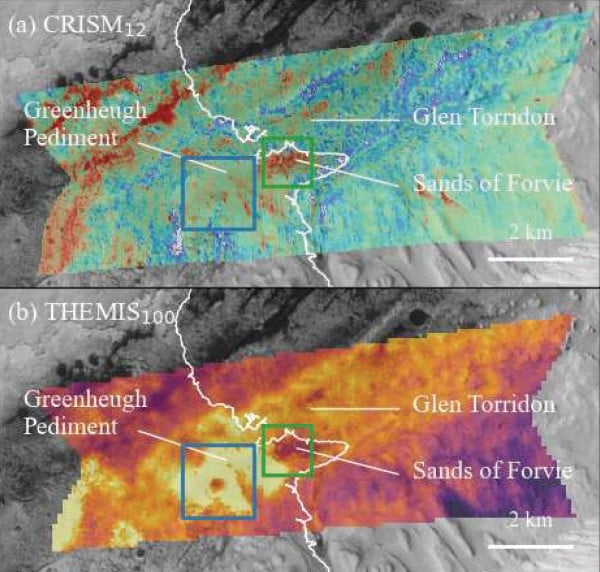
Fraser discusses the pros/cons of going back to the Moon or to Mars as the next step of our exploration journey.The problem was, up until recently, they haven’t been. Our main instrument for measuring TI so far has been THEMIS, an infrared imager attached to Mars Odyssey, which was launched back in 2001. Its resolution is not anywhere near what modern systems are capable of - and averages out at around 100m per pixel. Definitely not enough to differentiate between a boulder-strewn sand pit and a cliff of bare bedrock.
Another infrared option on site is the CRISM instrument on the Mars Reconnaissance Orbiter. Launched slightly later in 2005, it has a much higher resolution of 12m per pixel. However, it is hyperspectral, and therefore, doesn’t measure temperature or thermal inertia like THEMIS is capable of.
Combining the two data sets would be best, and that is exactly what the paper does. They used a technique called “data-fusion”, which is already popular for Earth-observing satellites. To start, they took sharp CRISM data and averaged it out to match the 100m resolution of THEMIS. They then trained an “Extra Tree Regressor” - a type of machine learning model - to find hidden relationships between the visual data of a region and its thermal data.
Fraser talks about the resources we can find and utilize on Mars.Once the model was trained on how spectral signatures correlated with TI values, they then allowed the model access to the full 12m resolution CRISM data. After an initial pass, the researchers again smoothed out any mathematical residuals and forced the map to align with the original THEMIS data. This combination automated and manual approach delivered impressive results, with the downscaled thermal map achieving an extremely high accuracy rate, and thereby bypassing the physical limits of the THEMIS sensor.
The data they trained the model on wasn’t a randomly selected part of the Martian surface, though. It was Gale crater, where Curiosity has been roving for years, and allowed for future ground-truth validation, though the paper’s validation was performed against the original THEMIS data.
But utilizing such a well-trodden area does introduce some room for improvement. According to the paper, the model would need localized retraining to be applicable to other parts of the Red Planet. Other parts would likely lack a rover and the ground-truth validation that Gale Crater offered, but, for now at least, the proof of concept of using this data fusion technique on another world is a step towards finding interesting exploration sites using decades old equipment.
Learn More:
M.A. Frazer et al - Producing High-Resolution Martian Surface Temperature Maps Using VIR-TIR Relationships
UT - Temperature of Mars
UT - How Cold is Mars?