Looking at an X-ray image of a galaxy cluster is like watching fireworks frozen in time. You see swirls and arcs, bubbles and filaments, structures that hint at past violence but don't explain what actually happened. Astronomers have puzzled over these features for decades, trying to determine which came from shock waves, which from cooling gas, and which from bubbles blown by black holes. Now a team led by Hannah McCall at the University of Chicago has developed a technique that answers these questions directly, creating images that classify the structures by their physics rather than their appearance.
The method, called "X-arithmetic," works by exploiting that different physical processes emit X-rays at different energies. The team takes Chandra X-ray Observatory data and splits it into lower energy and higher energy observations, then compares how bright each feature appears in both. That comparison reveals the feature's nature. Sound waves and weak shock fronts compressing gas into thin layers show up one way, bubbles inflated by jets from supermassive black holes another, and cooling or slow moving gas a third way.
 Artist illustration of the Chandra X-ray Observatory (Credit : NASA/CXC/NGST)
To make the physics visible, the researchers paint each type of structure a different colour. Pink marks sound waves and shock fronts, ripples of pressure traveling through the cluster's superheated gas at close to the speed of sound. Yellow highlights the bubbles carved out by jets blasting from central black holes, cavities filled with energetic particles but little X-ray-emitting gas. Blue shows cooling or slower moving gas, regions where temperatures have dropped or material moves at different speeds than its surroundings.
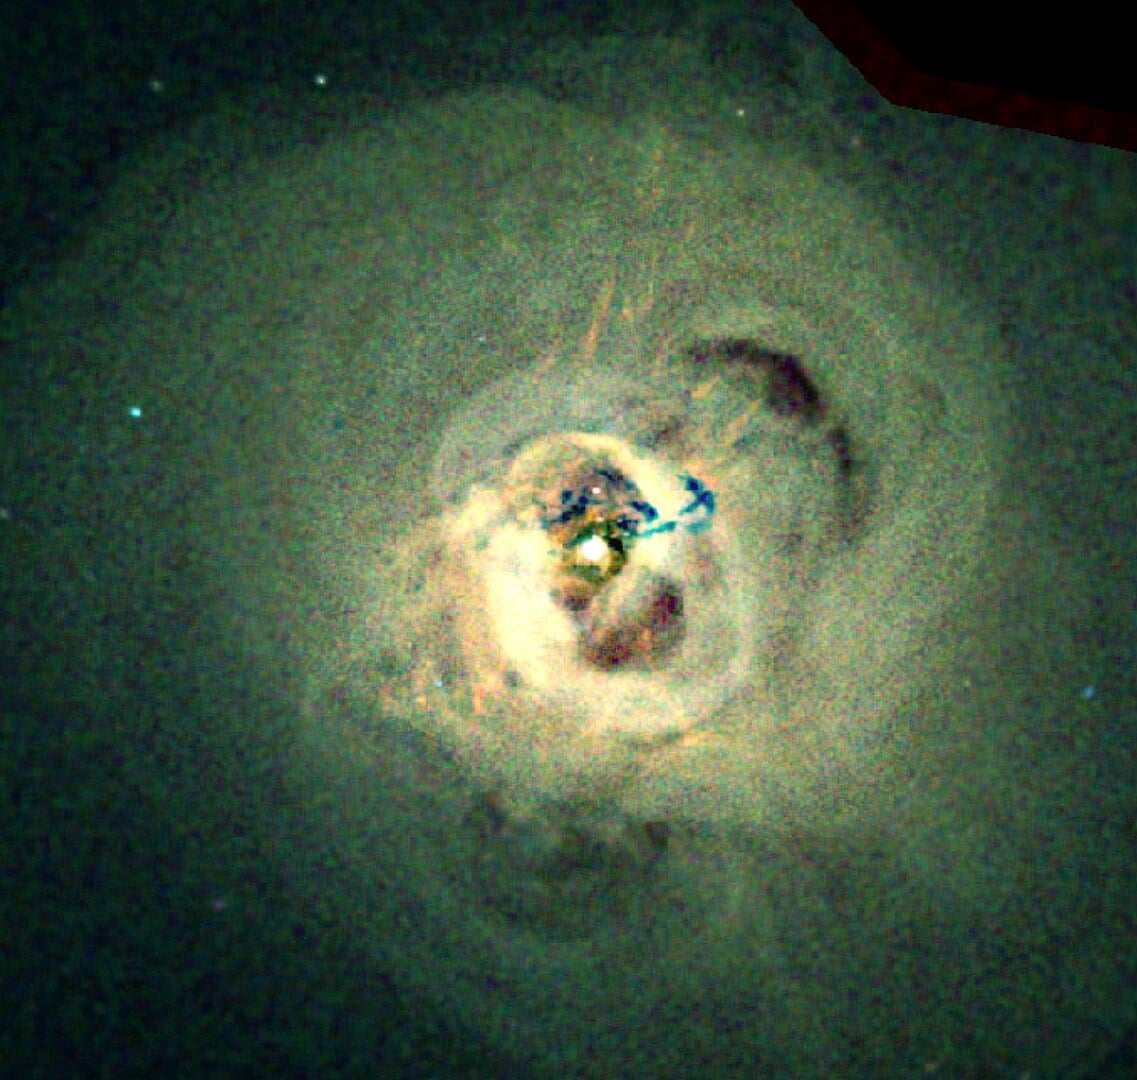
The technique reveals familiar objects in a whole new way. Take the Perseus Cluster, previously seen as a swirling cone of pink gas with dark filaments. The X-arithmetic version reveals it as a corkscrew of neon blue cooling gas dotted with pink shock fronts and golden bubbles. M87, once a cloud of overlapping colours, becomes a faint yellow bubble with blue and pink pixels revealing its complex structure.
McCall's team applied X-arithmetic to fifteen galaxy clusters and smaller galaxy groups, and the results immediately revealed a pattern. Galaxy clusters often show large regions of cooling gas near their centres with fewer shock fronts. Galaxy groups display the opposite with multiple shock fronts in their central regions and smaller amounts of cooling gas. This contrast suggests that black hole feedback operates differently depending on scale. The same outburst might barely disturb a massive galaxy cluster but violently shake a galaxy group held together by weaker gravity.
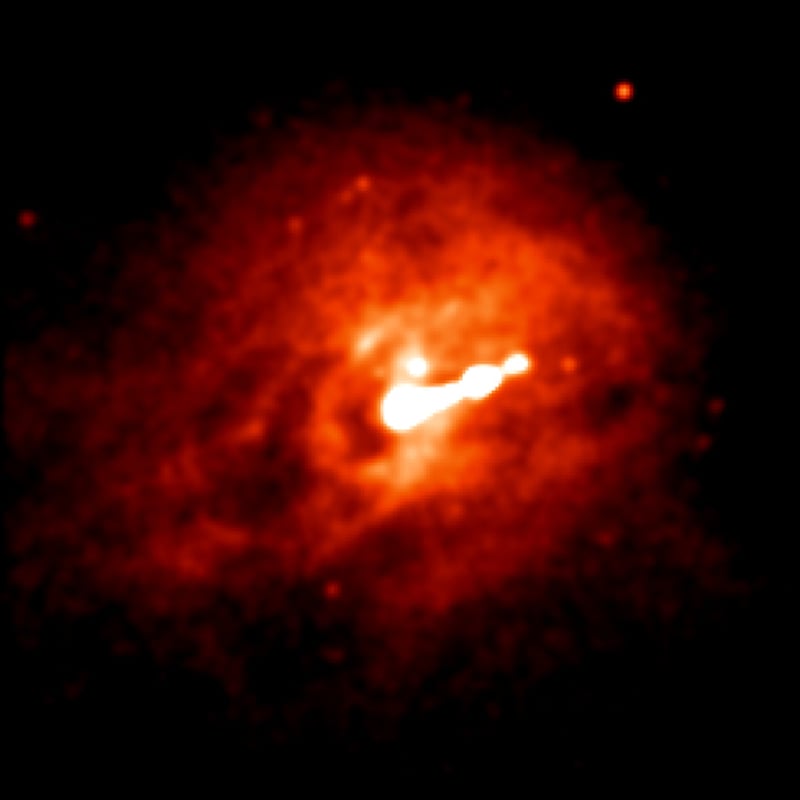 Chandra X-Ray Observatory image of M87 (Credit : NASA/CXC/H.Feng et al.)
This matters because these black hole explosions regulate the entire lifecycle of galaxy clusters. The outbursts heat surrounding gas, preventing it from cooling enough to collapse and form stars. Understanding how feedback works at different scales helps explain why some clusters are ablaze with new star formation while others remain relatively quiet.
The technique works on both observations and computer simulations, giving astronomers a tool to bridge theory and reality. Instead of arguing whether a feature might be a shock or a bubble, researchers can now classify it directly from imaging data alone. It's a new lens for viewing the most violent events in the universe's largest structures, painted not by appearance but by the physics that created them.