As global warming heats up our atmosphere a degree at a time, the world's glaciers are paying the price. In ten years, they've shrunk by a total of 2 percent. To look at it another way, collectively the glaciers have lost 2,720 gigatons of ice thanks to warming air.
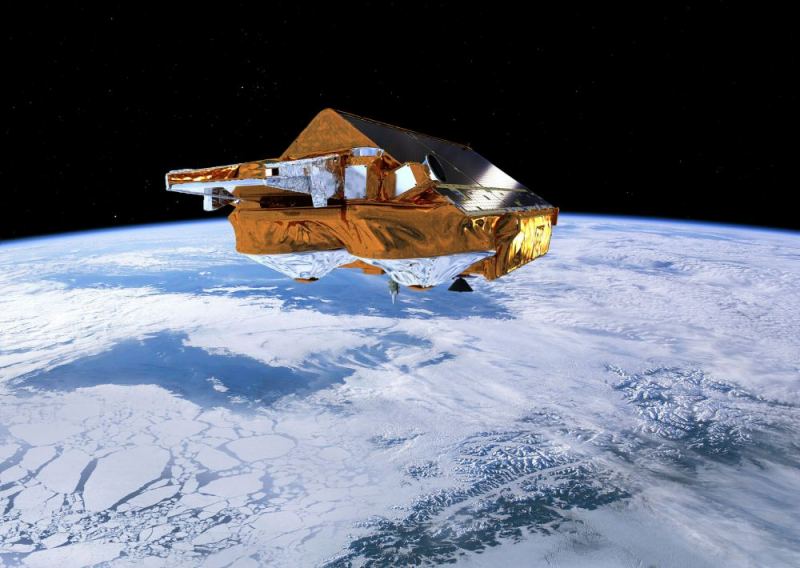
How do we know this? The European Space Agency's CryoSat mission provided data about the 2010-2020 loss of glacier ice. At least 89 percent of it is due to warming temps. In addition, ice being lost from glaciers is contributing more to sea-level rise than the ice being lost from either of the giant ice sheets on Greenland and Antarctica.
Processing Data to Look at Glaciers
Dr. Livia Jakob of Earthwave and Noel Gourmelen of the University of Edinburgh in the UK just published a data processing technique that revolutionized the use of CryoSat data. It uncovered a lot of new data about icy terrains and glaciers that led to the discovery of ice loss.
"We've been able to use this technique to study glaciers all over the world," explained Jakob. "We can report that, in total, mountain glaciers lost 2% of their volume between 2010 and 2020.
The new analysis of CryoSat data revealed the 2720-gigaton loss, she said. "This can be imagined as a giant ice cube, bigger than Europe's highest mountain, which is quite shocking," she said. "Importantly, we also found that air temperature, which causes the ice surface to melt, accounts for 89% of this ice loss."
Warmer air temperatures are responsible for this decreasing "surface mass balance". However, the research team also found that something called 'ice discharge' was responsible for the other 11% of ice lost. That's a factor associated with glaciers that border a coast. There, warmer ocean waters help thin the "front" of the ice flow.
"I'm sure most people have seen photographs taken at different times that show how a glacier terminus has retreated over time,: Gourmelen said. " And we can see this from satellite images too. But we need to measure how a glacier's volume is changing to really make sense of what is happening."
Refining our Understanding of Glacier Ice Loss
Gormelen explained how the CryoSat data analysis is helping scientists compare ice loss around the world. "The relative contribution of decreasing surface mass balance and increasing ice discharge to sea-level change is well known for the Greenland and Antarctic ice sheets," he said. "Now we know more about how the atmosphere and ocean are teaming up to melt glaciers. There is still plenty of work to do to refine these numbers, and to incorporate this knowledge into our glacier projections."
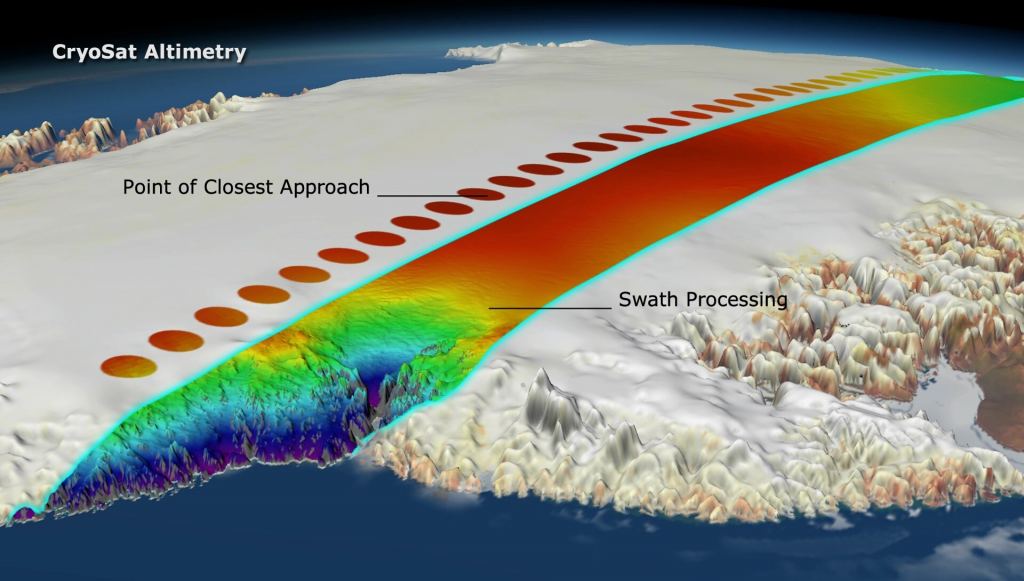
This analysis used data from the satellite when it was in swath altimetry mode. Essentially, the satellite took data over wide swaths of terrain and measured the height of glaciers, water, and land. Such satellite radar altimeters have long monitored changes in the height of the sea surface. They also monitor changes in the height of the huge ice sheets that cover such places as Antarctica and Greenland. The instrument measures the time it takes for a radar pulse to reflect from Earth back to the satellite. Couple that with the exact position of the satellite in space and you get the height of the surface below.
CryoSat Data: The Canary in the Coal Mine?
Mountain glaciers have long been key indicators of climate change, but estimates of global glacier mass loss have remained limited to a few scientific studies. This is because there are big challenges in mapping and monitoring glaciers. This is largely because they exist in complex rugged terrain. Also, there is no specific satellite mission dedicated to mapping glaciers. This is why the CryoSat data are so valuable.
"I'm sure most people have seen photographs taken at different times that show how a glacier terminus has retreated over time. And we can see this from satellite images too," said Gourmelen. "But we need to measure how a glacier's volume is changing to really make sense of what is happening."
CryoSat's altimeter isn't specifically designed to measure changes in mountain glaciers. But, using the satellite's swath mapping technique for icy terrains is invaluable. It has enabled scientists to fine-tune their estimates of ice loss in glaciers and make predictions of resulting sea level rise.
CryoSat has been busy measuring ice loss around the world since its launch. In 2021, its data revealed that between 2010 and 2019, the Gulf of Alaska lost 76 gigatons of ice per year. Asian glaciers lost about 28 gigatons per year. That's about the equivalent of adding 0.21 and 0.05 mm to sea level rise each year. In 2021, scientists reported that between 1992 and 2020, the polar ice sheets lost 7,560 billion tons of ice. In 2019 Greenland and Antarctica lost 444 billion tons and 168 billion tons of ice respectively.
That same year, scientists reported that the total loss from all the world's glaciers topped 9 trillion tons of ice. These losses are directly attributable to warming atmospheric temperatures around the world. If the ice sheets continue to lose mass at this pace, the Intergovernmental Panel on Climate Change predicts that they will contribute between 148 and 272 mm to the global mean sea level by the end of the 21st century.
For More Information
CryoSat Reveals Ice Loss from Glaciers
Glacier Mass Loss Between 2010 and 2020 Dominated by Atmospheric Forcing
CryoSat Reveals Ice Loss from Glaciers in Alaska and Asia