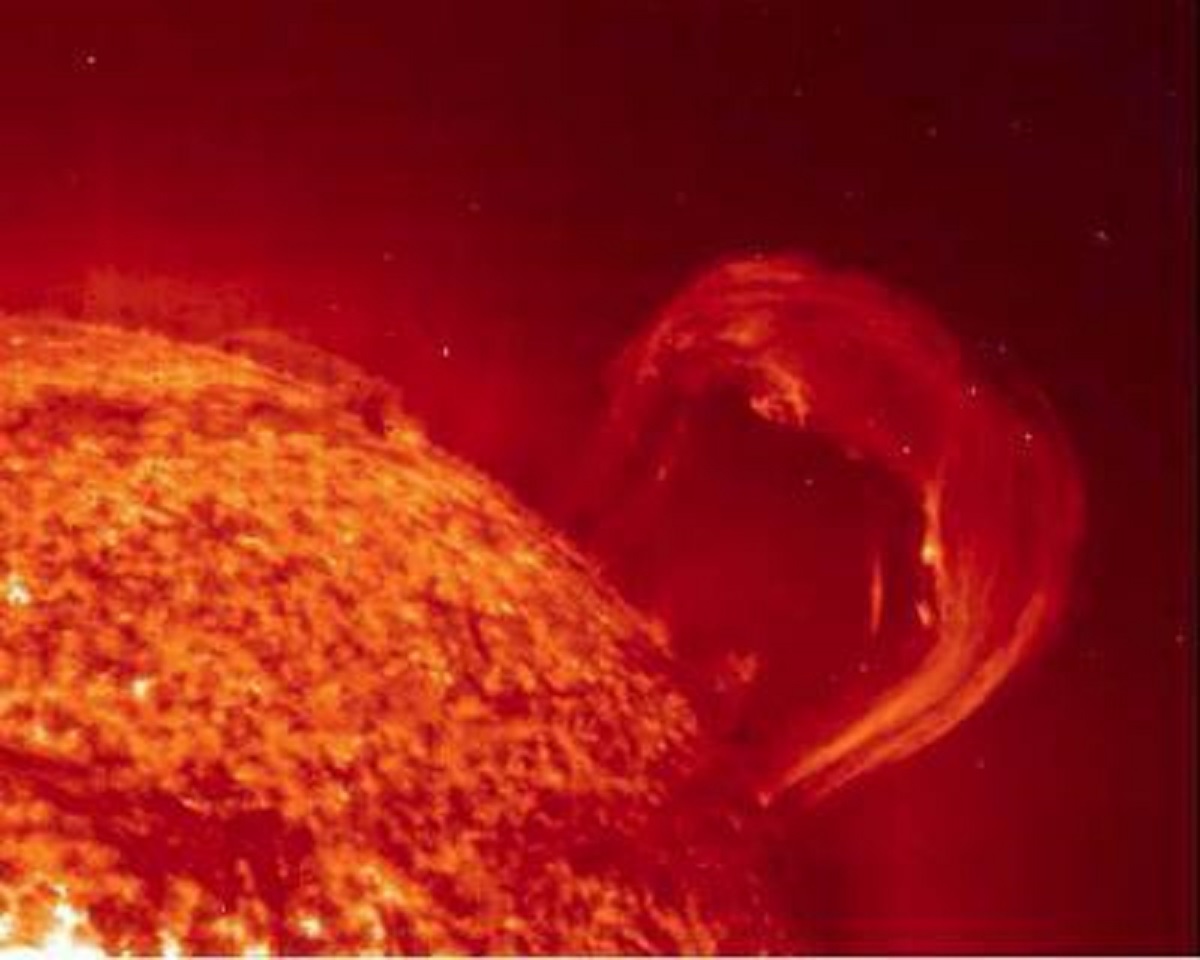
Image of a coronal mass ejection being discharged from the Sun. (Credit: NASA/Goddard Space Flight Center/Solar Dynamics Observatory)
Universe Today has investigated the importance of studying impact craters, planetary surfaces, exoplanets, and astrobiology, and what these disciplines can teach both researchers and the public about finding life beyond Earth. Here, we will discuss the fascinating field of solar physics (also called heliophysics), including why scientists study it, the benefits and challenges of studying it, what it can teach us about finding life beyond Earth, and how upcoming students can pursue studying solar physics. So, why is it so important to study solar physics?
Solar Orbiter’s unique vantage point recently allowed researchers to make a crucial observation of the solar system’s innermost world.
You never know when a chance for some extra space science will present itself. Recently, European Space Agency (ESA) mission controllers had just such a chance, when the planet Mercury passed in front of our host star as seen from the Solar Orbiter’s point of view in space.
A new study turns modern ‘deep learning’ techniques on Galileo’s early sketches of the Sun.
It’s a fascinating thought to consider.
What exactly did the Sun look like, centuries ago? What would we see, if astronomers back in the time of Kepler and Galileo had modern technology monitoring the Sun across the electromagnetic spectrum, available to them?
A new study suggests that Solar Cycle 25 may be more powerful than previously predicted.
It’s the big question in solar astronomy for 2021 and the new decade. Will Solar Cycle 25 wow observers, or be a washout? A new study goes against the consensus, suggesting we may be in for a wild ride… if predictions and analysis of past solar cycle transitions hold true.
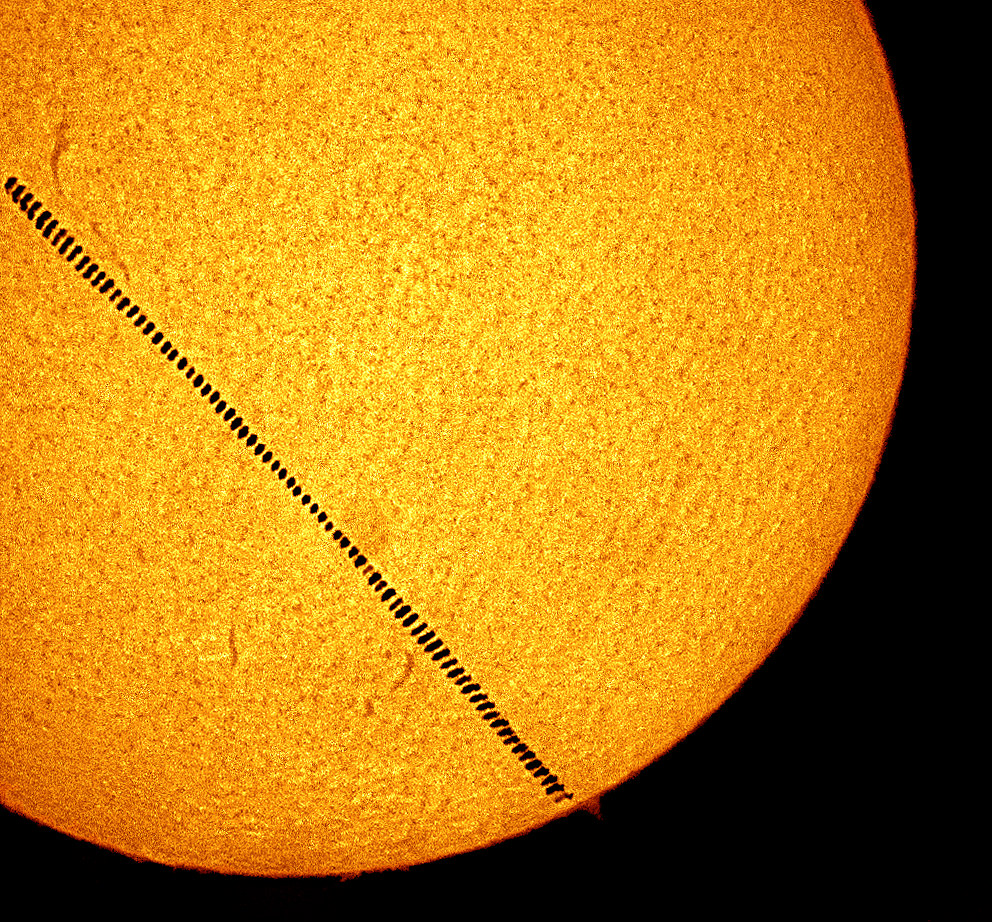
Solar energy energizes the drama of life on Earth, such as the bird caught transiting the solar disk as seen here. Image credit and copyright: Roger Hutchinson
You can be thankful that we bask in the glow of a relatively placid star. Currently about halfway along its 10 billion year career on the Main Sequence, our Sun fuses hydrogen into helium in a battle against gravitational collapse. This balancing act produces energy via the proton-proton chain process, which in turn, fuels the drama of life on Earth.
Looking out into the universe, we see stars that are much more brash and impulsive, such as red dwarf upstarts unleashing huge planet-sterilizing flares, and massive stars destined to live fast and die young.
Our Sun gives us the unprecedented chance to study a star up close, and our modern day technological society depends on keeping a close watch on what the Sun might do next. But did you know that some of the key mechanisms powering the solar cycle are still not completely understood?
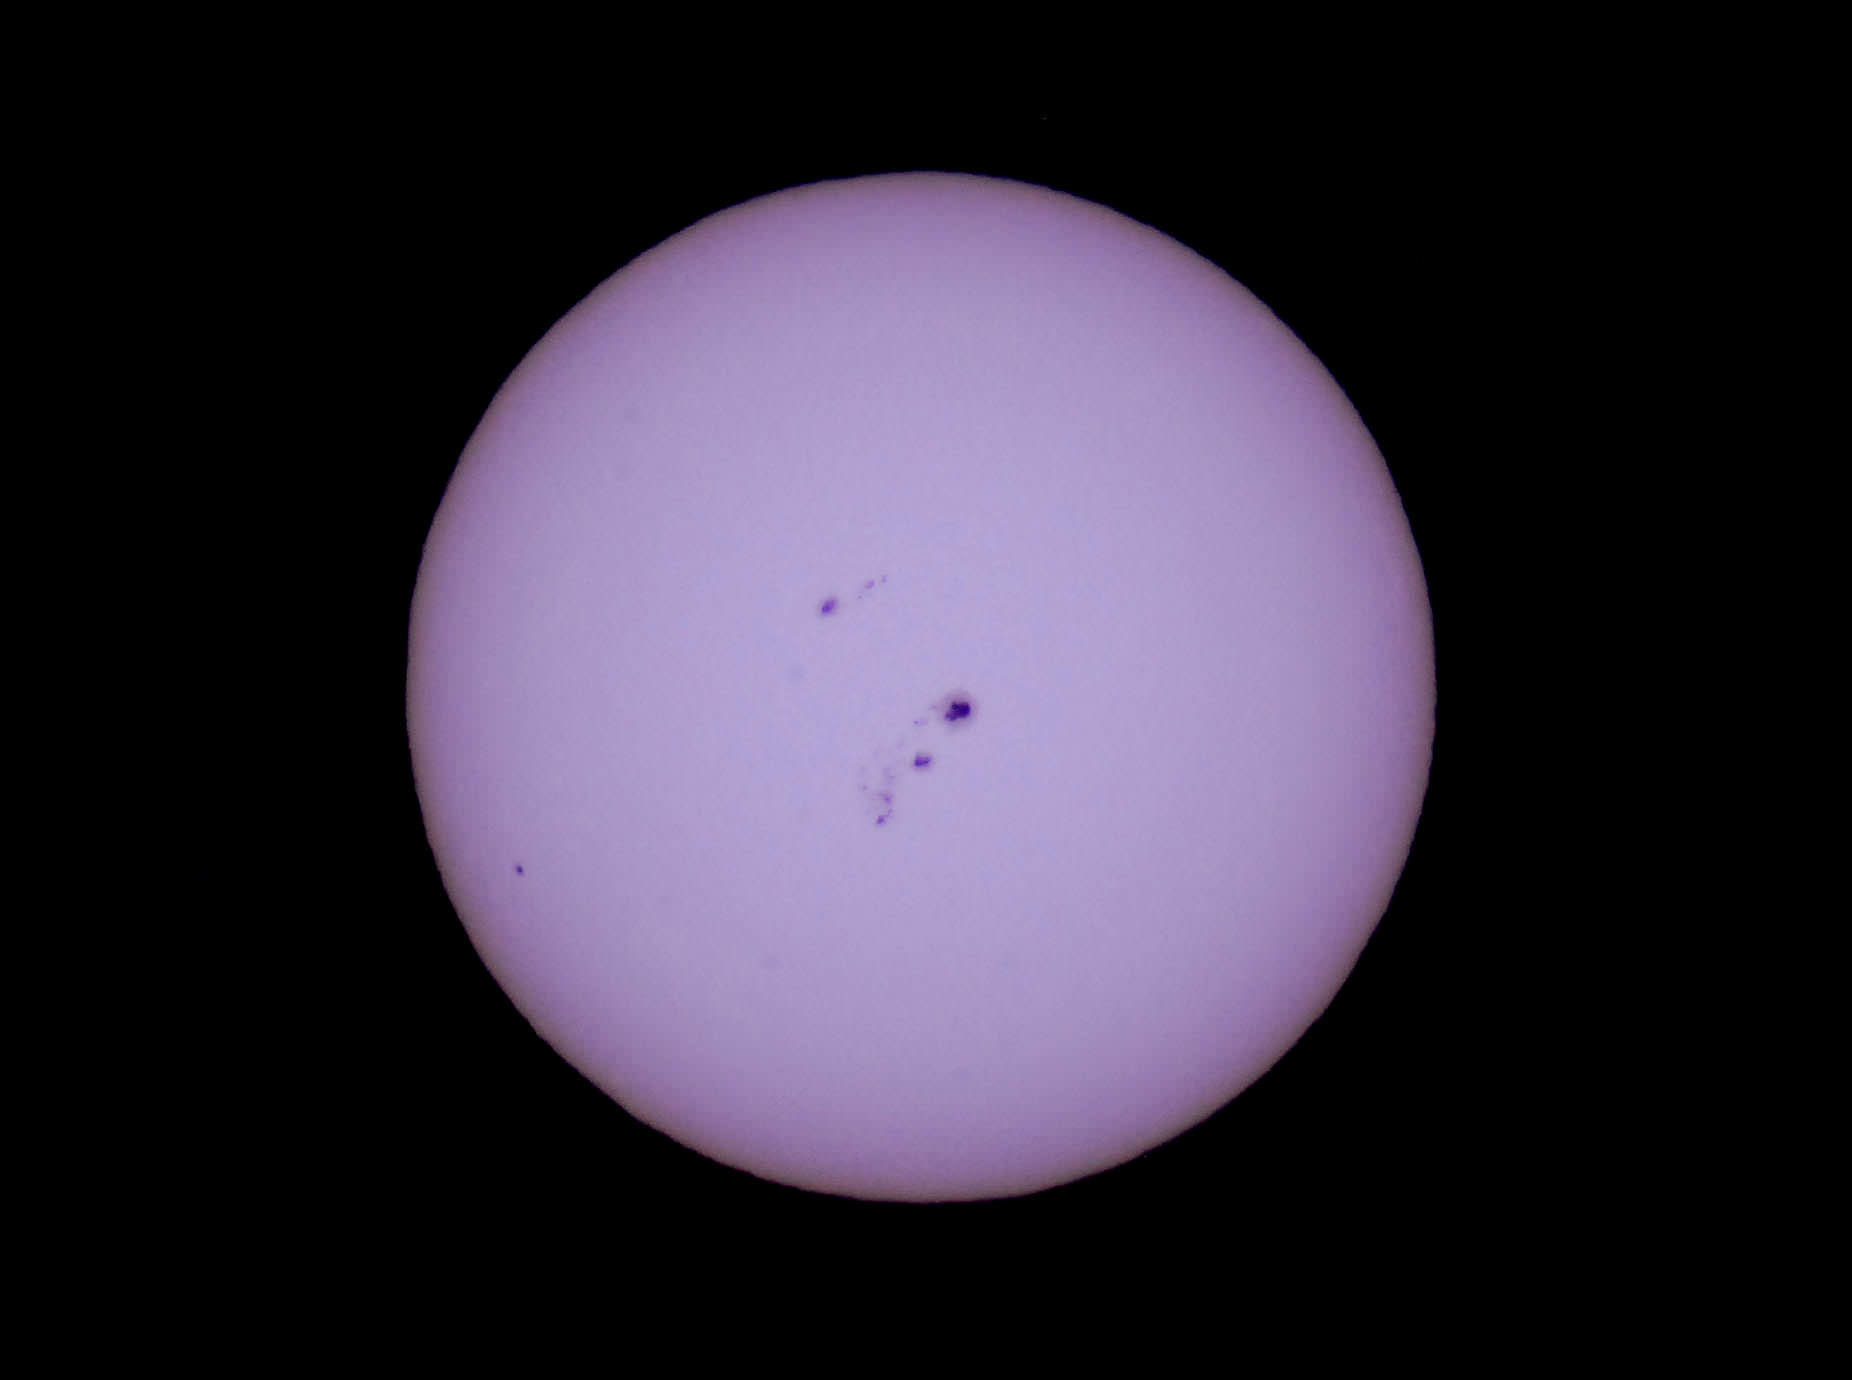
One of the exceptionally active sunspot groups seen for Cycle #24 in early 2014. Image credit: David Dickinson
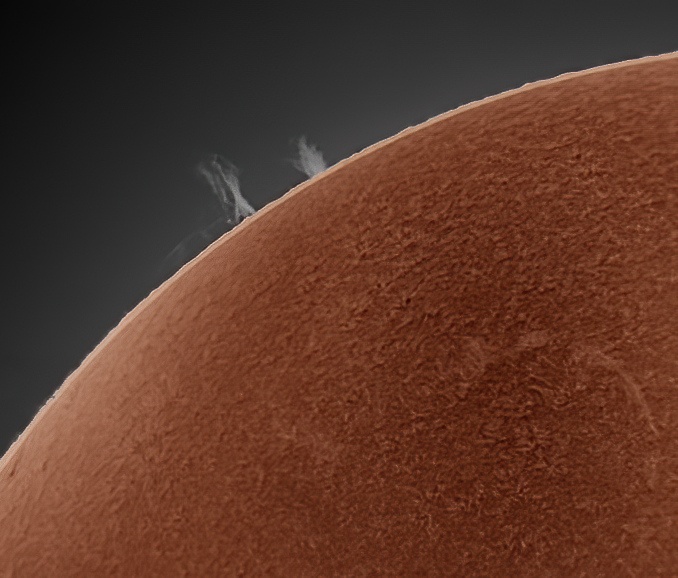
One such mystery confronting solar dynamics is exactly what drives the periodicity related to the solar cycle. Follow our star with a backyard telescope over a period of years, and you’ll see sunspots ebb and flow in an 11 year period of activity. The dazzling ‘surface’ of the Sun where these spots are embedded is actually the photosphere, and using a small telescope tuned to hydrogen-alpha wavelengths you can pick up prominences in the warmer chromosphere above.
This cycle is actually is 22 years in length (that’s 11 years times two), as the Sun flips polarity each time. A hallmark of the start of each solar cycle is the appearance of sunspots at high solar latitudes, which then move closer to the solar equator as the cycle progresses. You can actually chart this distribution in a butterfly diagram known as a Spörer chart, and this pattern was first recognized by Gustav Spörer in the late 19th century and is known as Spörer’s Law.
The ‘Butterfly diagram’ of sunspot distribution by latitude over previous solar cycles. Image credit: NASA/Marshall Spaceflight Center
We’re currently in the midst of solar cycle #24, and the measurement of solar cycles dates all the way back to 1755. Galileo observed sunspots via projection (the tale that he went blind observing the Sun in apocryphal). We also have Chinese records going back to 364 BC, though historical records of sunspot activity are, well, spotty at best. The infamous Maunder Minimum occurred from 1645 to 1717 just as the age of telescopic astronomy was gaining steam. This dearth of sunspot activity actually led to the idea that sunspots were a mythical creation by astronomers of the time.
But sunspots are a true reality. Spots can grow larger than the Earth, such as sunspot active region 2192, which appeared just before a partial solar eclipse in 2014 and could be seen with the unaided (protected) eye. The Sun is actually a big ball of gas, and the equatorial regions rotate once every 25 days, 9 days faster than the rotational period near the poles. And speaking of which, it is not fully understood why we never see sunspots at the solar poles, which are tipped 7.25 degrees relative to the ecliptic.
Other solar mysteries persist. One amazing fact about our Sun is the true age of the sunlight shining in our living room window. Though it raced from the convective zone and through the photosphere of the Sun at 300,000 km per second and only took 8 minutes to get to your sunbeam-loving cat here on Earth, it took an estimated 10,000 to 170,000 years to escape the solar core where fusion is taking place. This is due to the terrific density at the Sun’s center, over seven times that of gold.
Another amazing fact is that we can actually model the happenings on the farside of the Sun utilizing a new fangled method known as helioseismology.
Another key mystery is why the current solar cycle is so weak… it has even been proposed that solar cycle 25 and 26 might be absent all together. Are there larger solar cycles waiting discovery? Again, we haven’t been watching the Sun close enough for long enough to truly ferret these ‘Grand Cycles’ out.
The sunspot number predicted for the current Cycle #24 versus reality. Image credit: NASA
Are sunspot numbers telling us the whole picture? Sunspot numbers are calculated using formula that includes a visual count of sunspot groups and the individual sunspots in them that are currently facing Earthward, and has long served as the gold standard to gauge solar activity. Research conducted by the University of Michigan in Ann Arbor in 2013 has suggested that the orientation of the heliospheric current sheet might actually provide a better picture as to the goings on of the Sun.
Another major mystery is why the Sun has this 22/11 year cycle of activity in the first place. The differential rotation of the solar interior and convective zone known as the solar tachocline drives the powerful solar dynamo. But why the activity cycle is the exact length that it is is still anyone’s guess. Perhaps the fossil field of the Sun was simply ‘frozen’ in the current cycle as we see it today.
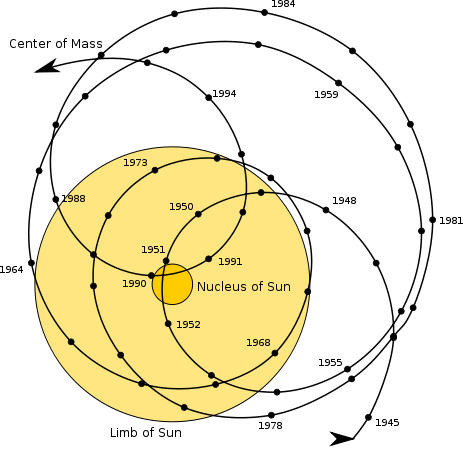
Color us skeptical on these ideas. Although Jupiter accounts for over 70% of the planetary mass in the solar system, it’s 1/1000th as massive as the Sun. The barycenter of Jupiter versus the Sun sits 36,000 kilometres above the solar surface, tugging the Sun at a rate of 12.4 metres per second.
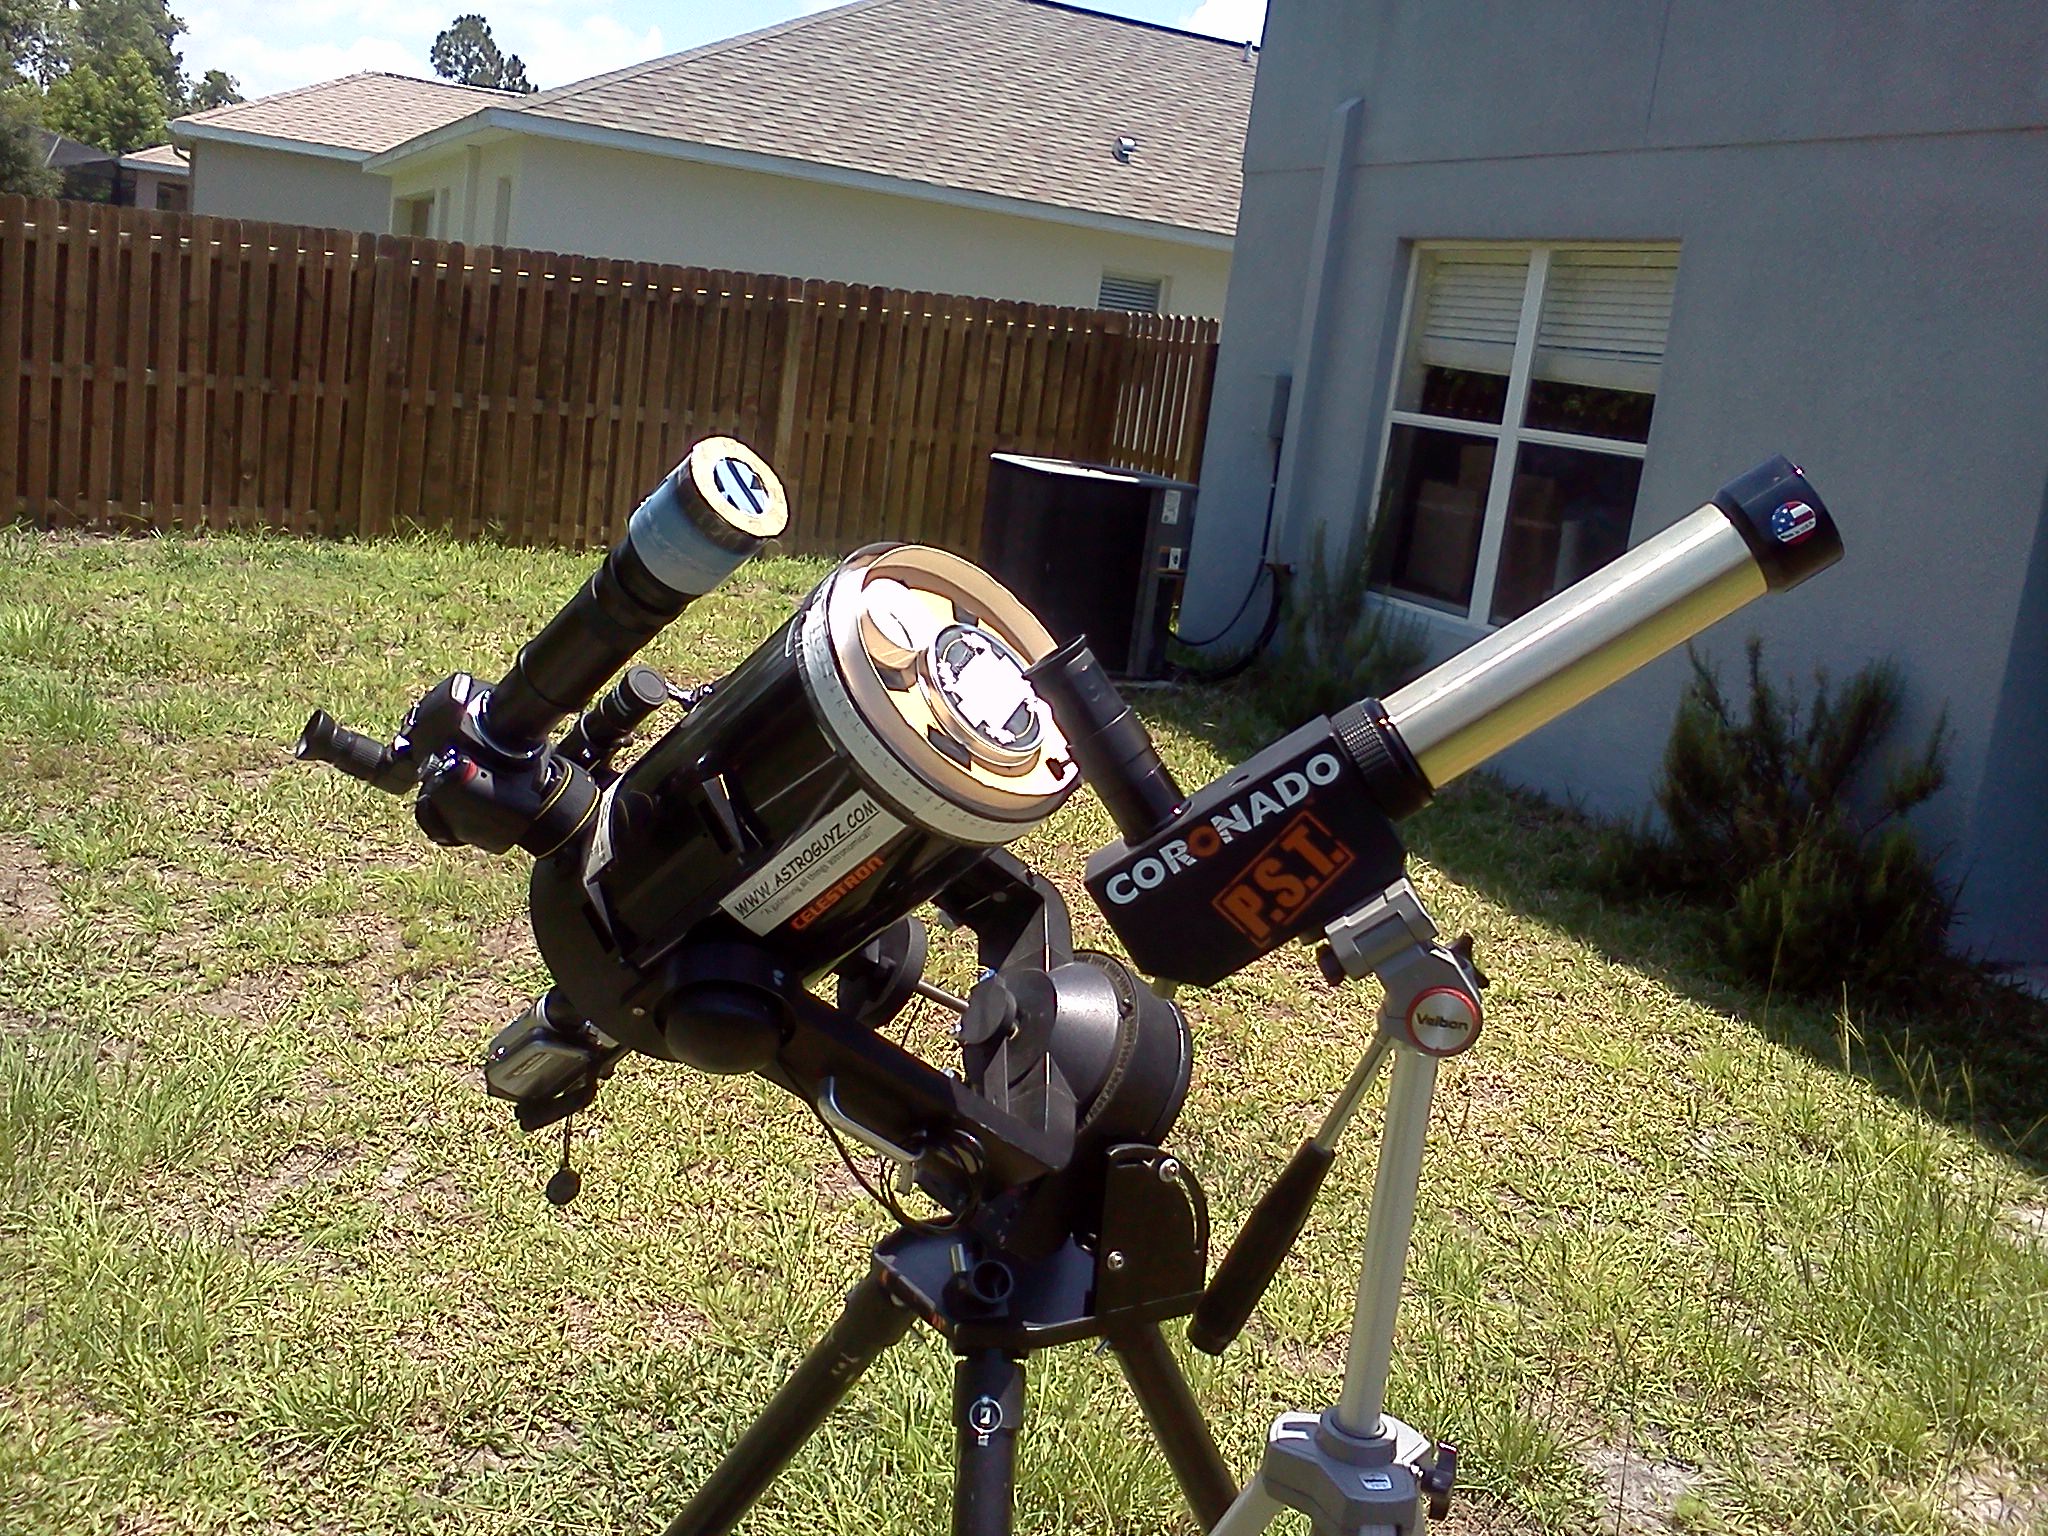
Rigs to view the Sun in both hydrogen-alpha and visible light. Credit: David Dickinson
I suspect this is a case of coincidence: the solar system provides lots of orbital periods of varying lengths, offering up lots of chances for possible mutual occurrences. A similar mathematical curiosity can be seen in Bode’s Law describing the mathematical spacing of the planets, which to date, has no known basis in reality. It appears to be just a neat play on numbers. Roll the cosmic dice long enough, and coincidences will occur. A good test for both ideas would be the discovery of similar relationships in other planetary systems. We can currently detect both starspots and large exoplanets: is there a similar link between stellar activity and exoplanet orbits? Demonstrate it dozens of times over, and a theory could become law.
An innovative solar observatory is adding a key piece to the puzzle of the enigma that is our Sun.
Its two of key questions in heliophysics: why does our Sun have a corona? And why is the temperature of the corona actually higher than the surface of the Sun?
This week, researchers released results from the preliminary first six months of data from NASA’s Interface Region Imaging Spectrograph, known as IRIS. The findings were presented at the Fall American Geophysical Union Meeting this past Monday.
IRIS was launched on June 27th of this year on a Pegasus-XL rocket deployed from the belly of a Lockheed L-1011 aircraft flying out of Vandenberg Air Force Base. IRIS can focus in on a very specific interface region of the Sun sandwiched between the dazzling solar photosphere and the transition to the corona. To accomplish this, IRIS employs an ultraviolet slit spectrograph looking at ionized gas spectra.
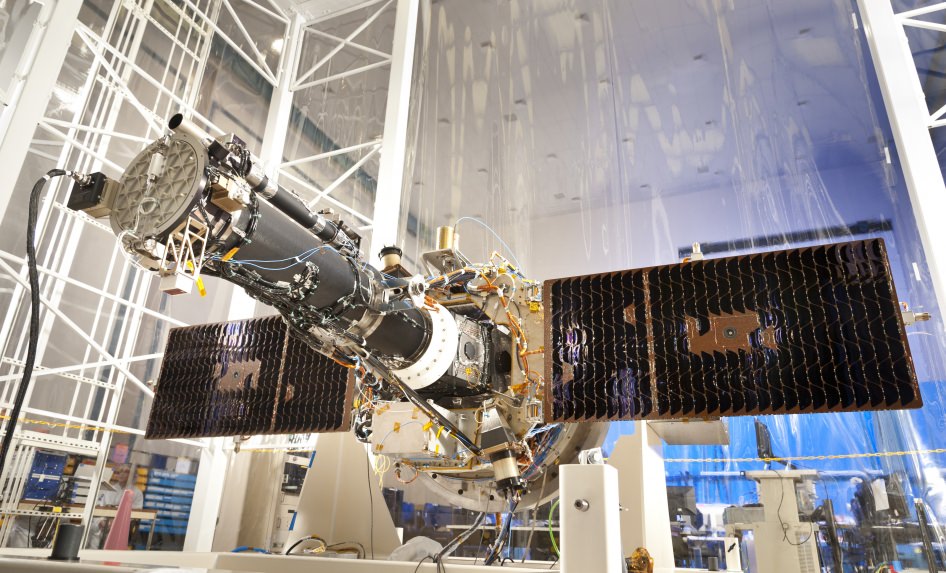
IRIS in the clean room. The spacecraft is only about 2 metres in length, about the height of a person. (Credit: Lockheed Martin).
“The quality of images and spectra we are receiving is amazing,” IRIS Principal Investigator Alan Title said in a recent press release from the NASA Goddard Space Flight Center. While other missions may take over a decade to go from the drawing board to the launch pad, IRIS was developed and deployed into Low Earth Orbit in just 44 months.
IRIS offers scientists a new tool to probe the Sun and a complimentary instrument to platforms such as Hinode, the Solar Heliospheric Observatory (SOHO) and NASA’s Solar Dynamics Observatory. In fact, IRIS has a better resolution than SDO’s AIA imagers or Hinode when it comes to this key solar interface region. IRIS has a 20x greater resolution in time, and 25x the spatial resolution of any former space-based UV spectrometer deployed.
“We are seeing rich and unprecedented images of violent events in which gases are accelerated to very high velocities while being rapidly heated to hundreds of thousands of degrees,” said Lockheed Martin science lead on the IRIS mission Bart De Pontieu. These observations are key to backing up theoretical models of solar dynamics as well as testing and formulating new ones of how our Sun works.
IRIS bridges this crucial gap between the photosphere and the lower chromosphere of the Sun. While the solar surface roils at relatively placid 6,000 degrees Celsius, temperatures rise into the range of 2-3 million degrees Celsius as you move up through the transition region and into the corona.
Two key solar phenomena that are of concern to solar researchers can be examined by IRIS in detail. One is the formation of prominences, which show up as long looping swirls of solar material rising up from the surface of the Sun. Prominences can be seen from backyard telescopes at hydrogen alpha wavelengths. IRIS can catch and track their early modeling with unprecedented resolution. Images released from IRIS show the fine structure of targeted prominences as they evolve and rise off the surface of the Sun. When a prominence and accompanying coronal mass ejection is launched in our direction, disruption of our local space environment caused by massive solar storm can result.
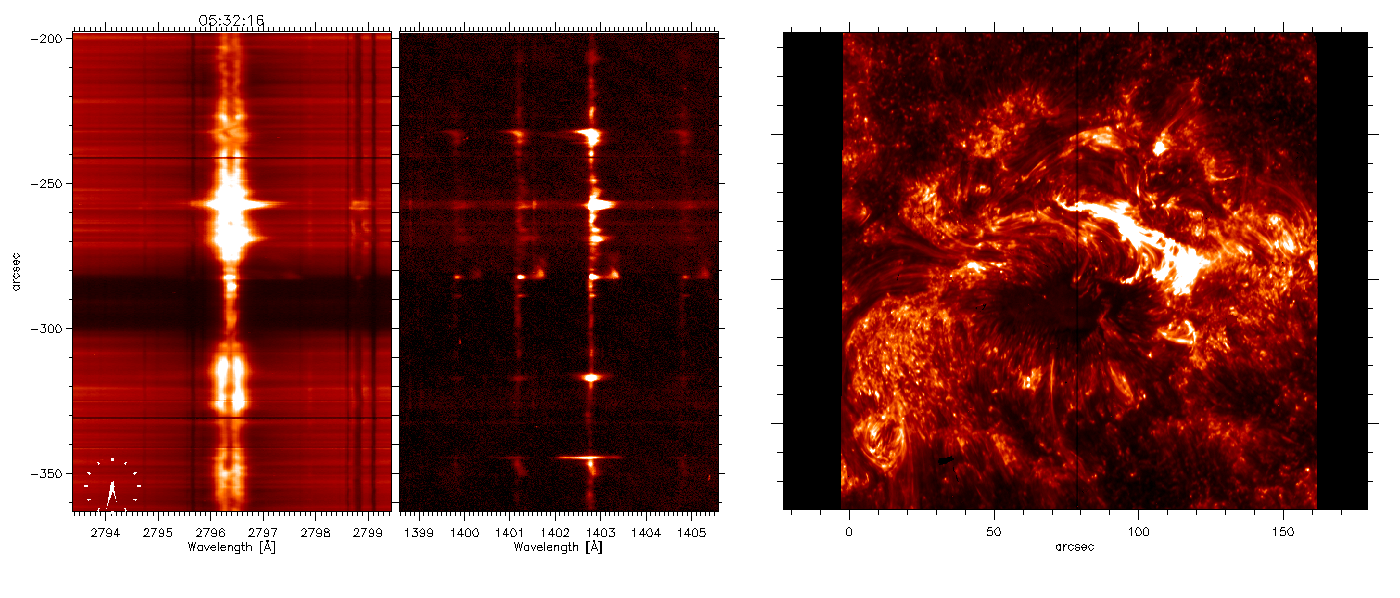
Slit jaw spectra images (the two strips to the left) and imaging of spicules (to the right) as seen by IRIS. (Credit: NASA/IRIS).
The second phenomenon targeted by IRIS is the formation of spicules, which are giant columns of gas rising from the photosphere. Although the spicules look like hair-fine structures through Earth-based solar telescopes, they can be several hundred kilometres wide and as long as the Earth. Short-lived, spicules race up from the surface of the Sun at up to 240,000 kilometres per hour and seem to play a key role in energy and heat transfer from the solar surface up through the atmosphere. IRIS is giving us a view of the evolution of spicules for the first time, and they’re proving to be even more complex than theory previously suggested.
“We see discrepancies between these observations and the models, and that is great news for advancing knowledge. By seeing something we don’t understand, we have a chance of learning something new,” Said University of Oslo astrophysicist Mats Carlsson.
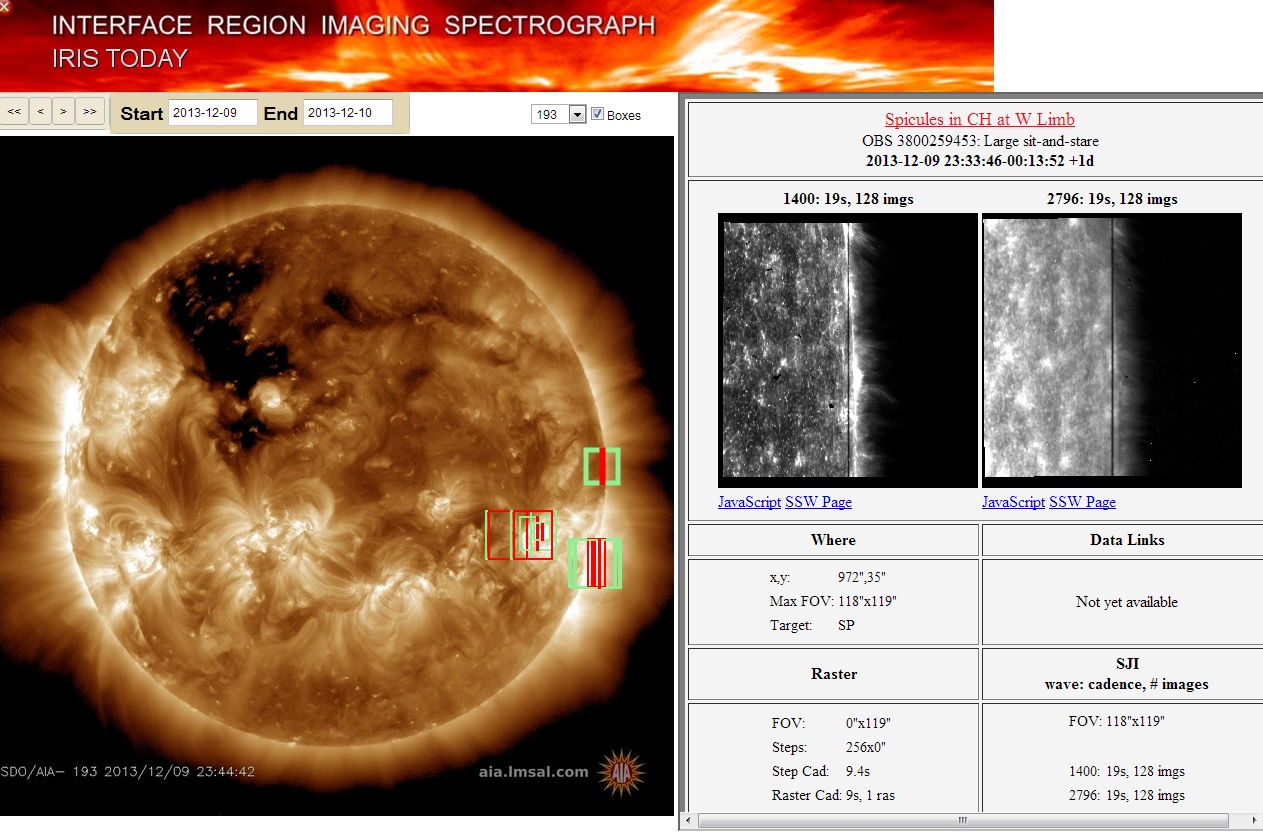
Like SDO and SOHO, data and images from IRIS are free for the public to access online. Though the field of view for IRIS is a narrow 2’ to 4’ arc minutes on a side – the solar disk spans about 30’ as seen from the Earth – IRIS gives us a refined view of “where the action is.”
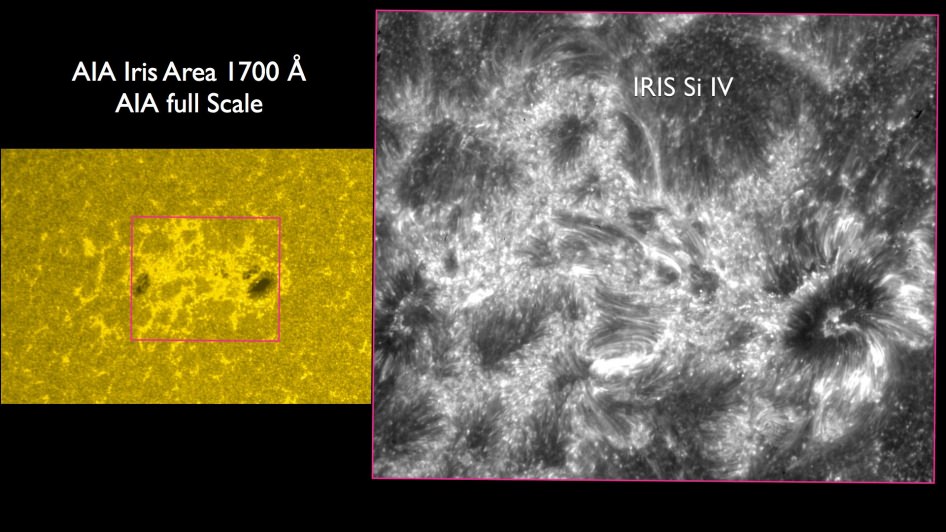
Where is IRIS looking? This snapshot gives some context of the IRIS field of view (green and red boxes) and black and white insets versus SDO’s AIA full disk view of the Sun. (Credit: NASA/SDO/IRIS).
And this all comes at an interesting time, as our nearest star crosses the sputtering solar maximum for Cycle #24.
The equivalent of 50 million CPU hours were utilized in constructing and modeling what IRIS sees. The reconstruction was an international effort, spanning the Partnership for Advanced Computing in Europe, the Norwegian supercomputing collaboration, and NASA’s Ames Research Center.
IRIS also faced the additional challenge of weathering a 2.5 week period of inactivity due to the U.S. government shutdown this fall. Potential impacts due to sequestration remain an issue, though small explorer missions such as IRIS demonstrate how we can do more with less.
“We’ve made a giant step forward in characterizing the heat transfer properties of this region between the visible surface and the corona, which is key to understanding how the outer atmosphere of the Sun exists, and is key to understanding the outer atmosphere that the Earth lies in,” said Alan Title, referring to the tenuous heliosphere of the Sun extending out through the solar system.
Understanding the inner working of our Sun is vital: no other astronomical body has as big an impact on life here on Earth.
IRIS is slated for a two-year mission, though as is the case with most space-based platforms, researchers will work to get every bit of usefulness out of the spacecraft that they can. And it’s already returning some first-rate science at a relatively low production cost. This is all knowledge that will help us as a civilization live with and understand our often tempestuous star.