IRIS Glimpses an Elusive Region of the Sun

An innovative solar observatory is adding a key piece to the puzzle of the enigma that is our Sun.

Its two of key questions in heliophysics: why does our Sun have a corona? And why is the temperature of the corona actually higher than the surface of the Sun?

This week, researchers released results from the preliminary first six months of data from NASA’s Interface Region Imaging Spectrograph, known as IRIS. The findings were presented at the Fall American Geophysical Union Meeting this past Monday.

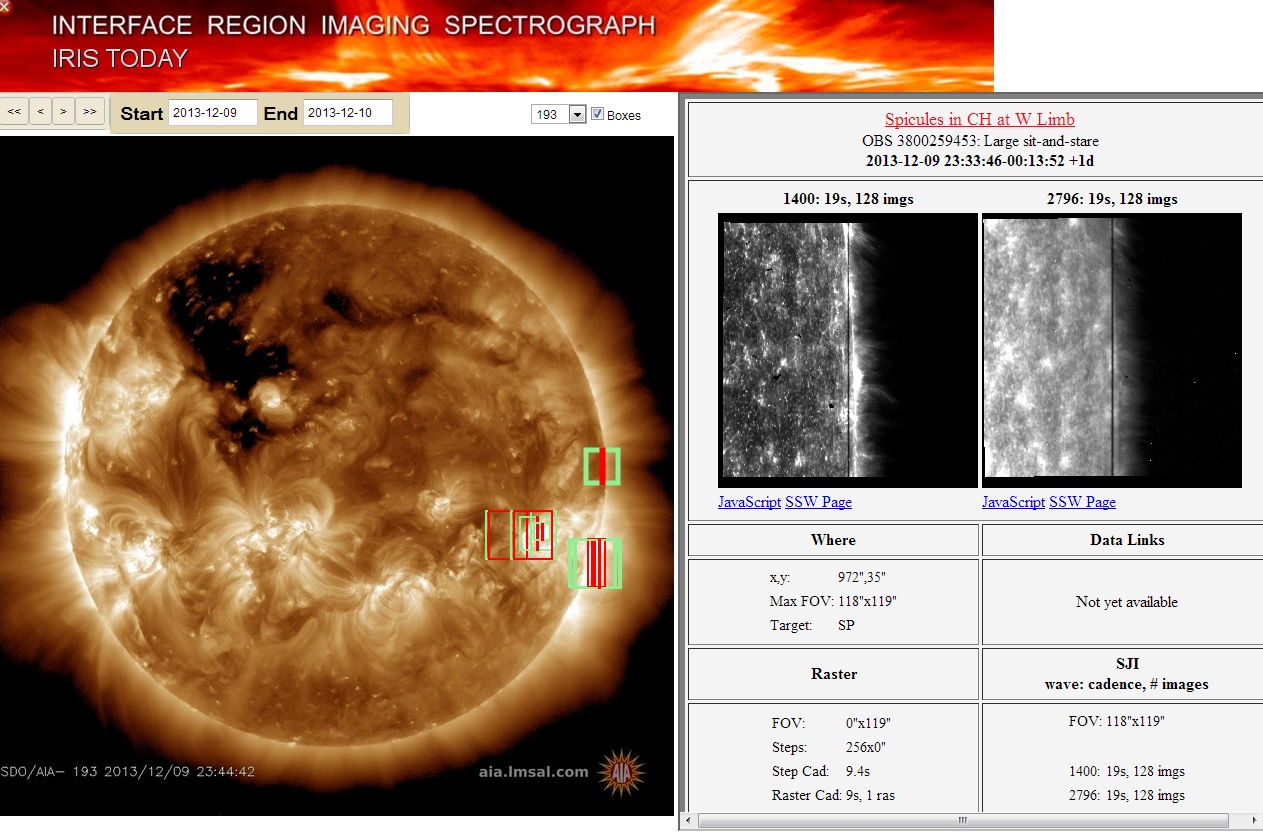
IRIS was launched on June 27th of this year on a Pegasus-XL rocket deployed from the belly of a Lockheed L-1011 aircraft flying out of Vandenberg Air Force Base. IRIS can focus in on a very specific interface region of the Sun sandwiched between the dazzling solar photosphere and the transition to the corona. To accomplish this, IRIS employs an ultraviolet slit spectrograph looking at ionized gas spectra.

IRIS in the clean room. The spacecraft is only about 2 metres in length, about the height of a person. (Credit: Lockheed Martin).

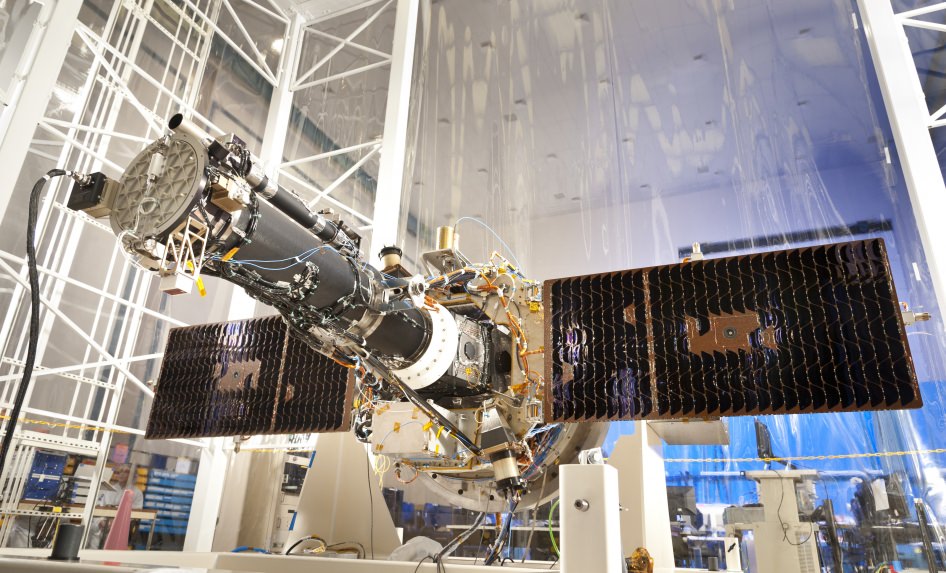
“The quality of images and spectra we are receiving is amazing,” IRIS Principal Investigator Alan Title said in a recent press release from the NASA Goddard Space Flight Center. While other missions may take over a decade to go from the drawing board to the launch pad, IRIS was developed and deployed into Low Earth Orbit in just 44 months.

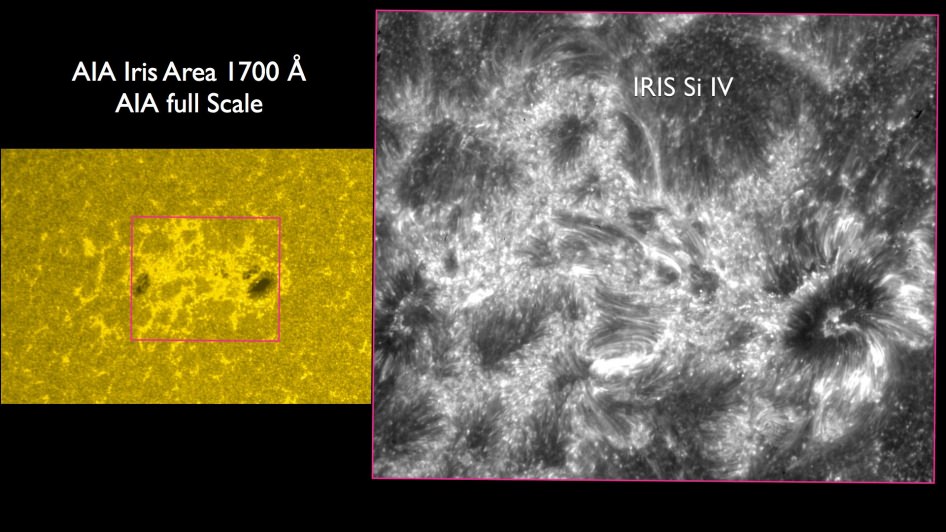
IRIS offers scientists a new tool to probe the Sun and a complimentary instrument to platforms such as Hinode, the Solar Heliospheric Observatory (SOHO) and NASA’s Solar Dynamics Observatory. In fact, IRIS has a better resolution than SDO’s AIA imagers or Hinode when it comes to this key solar interface region. IRIS has a 20x greater resolution in time, and 25x the spatial resolution of any former space-based UV spectrometer deployed.

“We are seeing rich and unprecedented images of violent events in which gases are accelerated to very high velocities while being rapidly heated to hundreds of thousands of degrees,” said Lockheed Martin science lead on the IRIS mission Bart De Pontieu. These observations are key to backing up theoretical models of solar dynamics as well as testing and formulating new ones of how our Sun works.

IRIS bridges this crucial gap between the photosphere and the lower chromosphere of the Sun. While the solar surface roils at relatively placid  6,000 degrees Celsius, temperatures rise into the range of 2-3 million degrees Celsius as you move up through the transition region and into the corona.

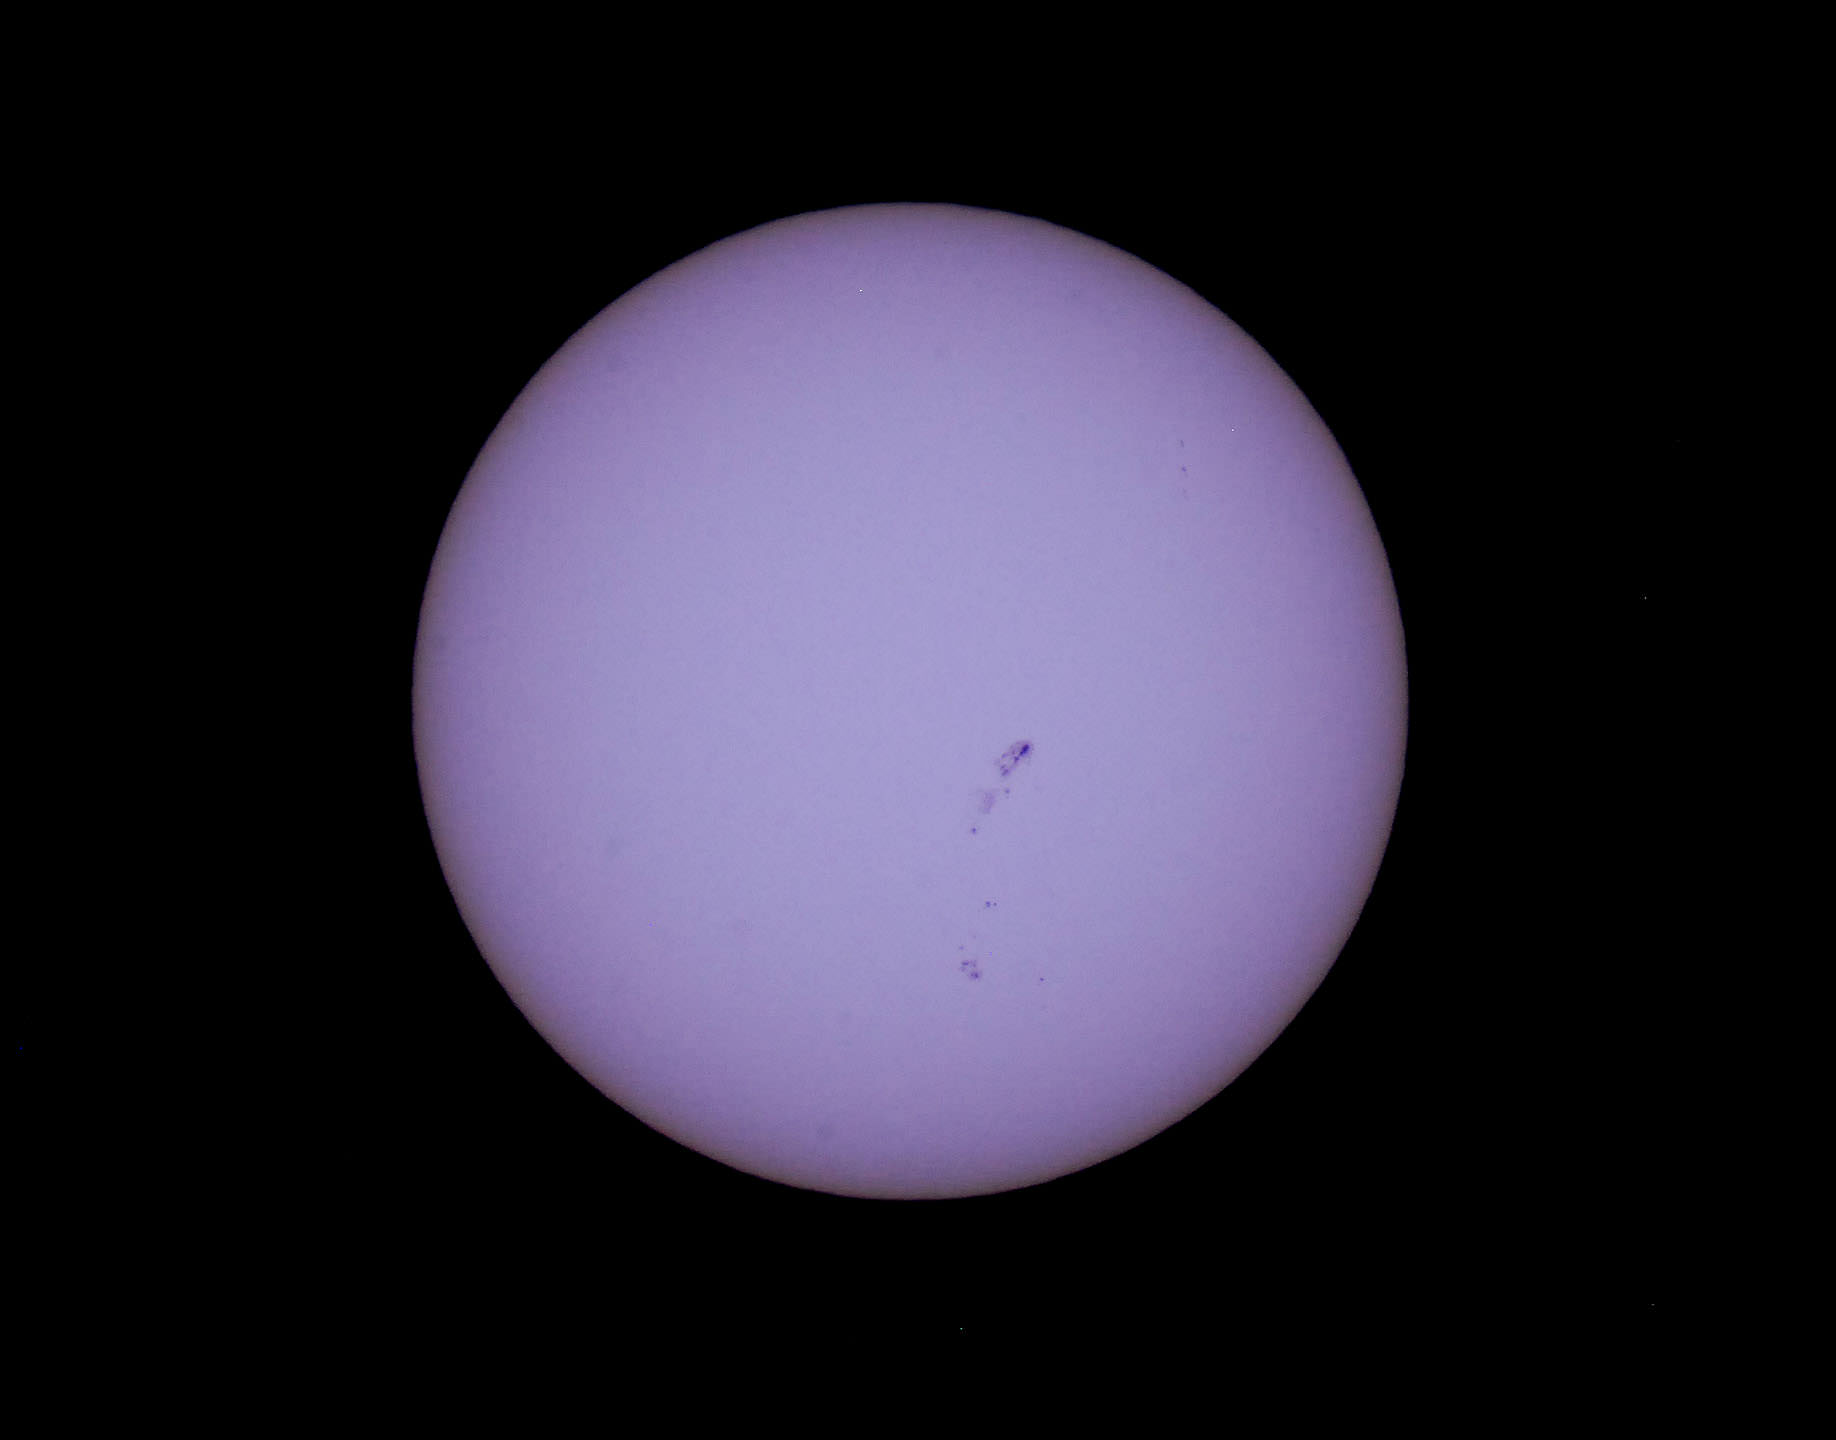
Two key solar phenomena that are of concern to solar researchers can be examined by IRIS in detail. One is the formation of prominences, which show up as long looping swirls of solar material rising up from the surface of the Sun. Prominences can be seen from backyard telescopes at hydrogen alpha wavelengths. IRIS can catch and track their early modeling with unprecedented resolution. Images released from IRIS show the fine structure of targeted prominences as they evolve and rise off the surface of the Sun. When a prominence and accompanying coronal mass ejection is launched in our direction, disruption of our local space environment caused by massive solar storm can result.

Slit jaw spectra images (the two strips to the left) and imaging a spicules 9to the right as seen by IRIS. (Credit: NASA/IRIS).
Slit jaw spectra images (the two strips to the left) and imaging of spicules (to the right) as seen by IRIS. (Credit: NASA/IRIS).

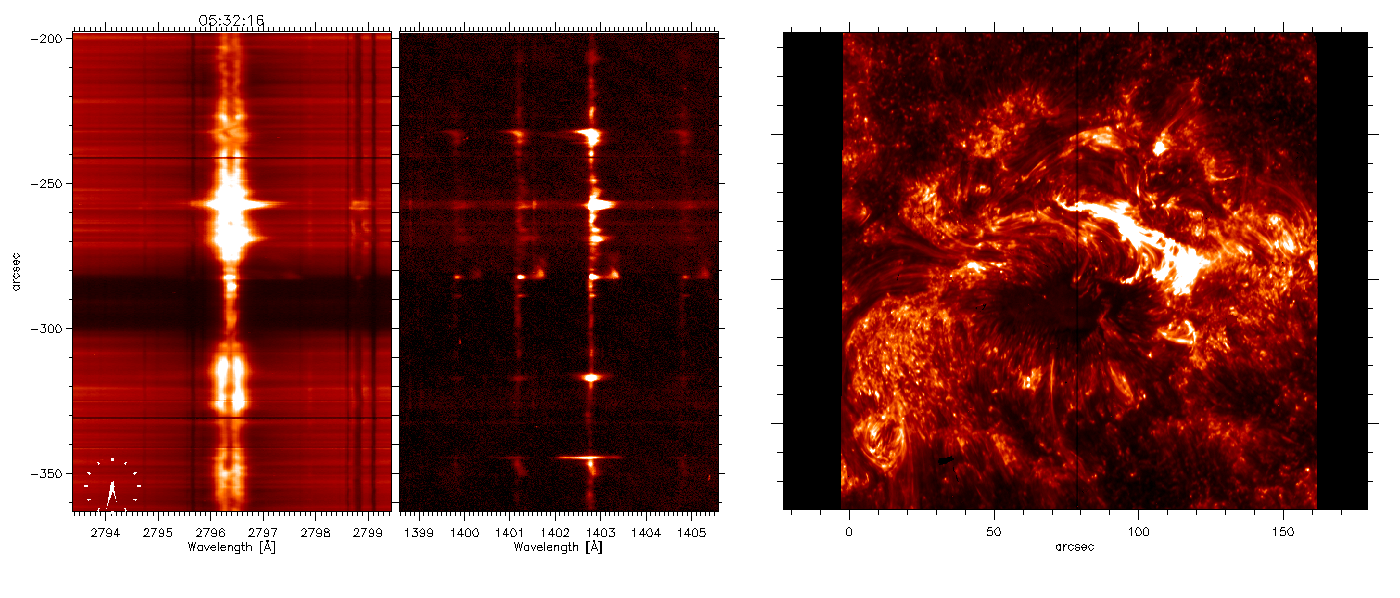
The second phenomenon targeted by IRIS is the formation of spicules, which are giant columns of gas rising from the photosphere. Although the spicules look like hair-fine structures through Earth-based solar telescopes, they can be several hundred kilometres wide and as long as the Earth. Short-lived, spicules race up from the surface of the Sun at up to 240,000 kilometres per hour and seem to play a key role in energy and heat transfer from the solar surface up through the atmosphere. IRIS is giving us a view of the evolution of spicules for the first time, and they’re proving to be even more complex than theory previously suggested.

“We see discrepancies between these observations and the models, and that is great news for advancing knowledge. By seeing something we don’t understand, we have a chance of learning something new,” Said University of Oslo astrophysicist Mats Carlsson.

Like SDO and SOHO, data and images from IRIS are free for the public to access online. Though the field of view for IRIS is a narrow 2’ to 4’ arc minutes on a side – the solar disk spans about 30’ as seen from the Earth – IRIS gives us a refined view of “where the action is.”

Where is IRIS looking? This snapshot gives some context of the IRIS field of view (green and red boxes) and black and white insets versus SDO's AIA full disk view of the Sun. (Credit: NASA/SDO/IRIS).
Where is IRIS looking? This snapshot gives some context of the IRIS field of view (green and red boxes) and black and white insets versus SDO’s AIA full disk view of the Sun. (Credit: NASA/SDO/IRIS).

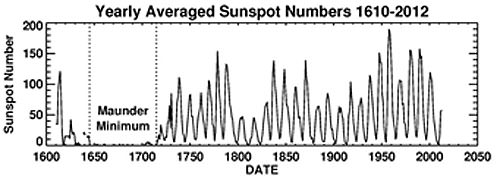
And this all comes at an interesting time, as our nearest star crosses the sputtering solar maximum for Cycle #24.

The equivalent of 50 million CPU hours were utilized in constructing and modeling what IRIS sees. The reconstruction was an international effort, spanning the Partnership for Advanced Computing in Europe, the Norwegian supercomputing collaboration, and NASA’s Ames Research Center.

IRIS also faced the additional challenge of weathering a 2.5 week period of inactivity due to the U.S. government shutdown this fall. Potential impacts due to sequestration remain an issue, though small explorer missions such as IRIS demonstrate how we can do more with less.

“We’ve made a giant step forward in characterizing the heat transfer properties of this region between the visible surface and the corona, which is key to understanding how the outer atmosphere of the Sun exists, and is key to understanding the outer atmosphere that the Earth lies in,” said Alan Title, referring to the tenuous heliosphere of the Sun extending out through the solar system.

Understanding the inner working of our Sun is vital: no other astronomical body has as big an impact on life here on Earth.

IRIS is slated for a two-year mission, though as is the case with most space-based platforms, researchers will work to get every bit of usefulness out of the spacecraft that they can. And it’s already returning some first-rate science at a relatively low production cost. This is all knowledge that will help us as a civilization live with and understand our often tempestuous star.


Solar Cycle #24: On Track to be the Weakest in 100 Years

Projected vs observed sunspot numbers for solar cycles #23 & #24. (Credit: Hathaway/NASA/MSFC).

Our nearest star has exhibited some schizophrenic behavior thus far for 2013.

By all rights, we should be in the throes of a solar maximum, an 11-year peak where the Sun is at its most active and dappled with sunspots.

Thus far though, Solar Cycle #24 has been off to a sputtering start, and researchers that attended the meeting of the American Astronomical Society’s Solar Physics Division earlier this month are divided as to why.“Not only is this the smallest cycle we’ve seen in the space age, it’s the smallest cycle in 100 years,” NASA/Marshall Space Flight Center research scientist David Hathaway said during a recent press teleconference conducted by the Marshall Space Flight Center.

Cycle #23 gave way to a profound minimum that saw a spotless Sol on 260 out of 365 days (71%!) in 2009. Then, #Cycle 24 got off to a late start, about a full year overdue — we should have seen a solar maximum in 2012, and now that’s on track for the late 2013 to early 2014 time frame. For solar observers, both amateur, professional and automated, it seems as if the Sun exhibits a “split-personality” this year, displaying its active Cycle #24-self one week, only to sink back into a blank despondency the next.

This new cycle has also been asymmetrical as well. One hallmark heralding the start of a new cycle is the appearance of sunspots at higher solar latitudes on the disk of the Sun. These move progressively toward the Sun’s equatorial regions as the cycle progresses, and can be mapped out in what’s known as a Spörer’s Law.

The sunspot number "butterfly" graph, illustrating Spörer's Law that susnpots gradually migrate towards the equator of the Sun as the solar cycle progresses. (Credit: NASA/MSFC).
The sunspot number “butterfly” graph, illustrating Spörer’s Law that susnpots gradually migrate towards the equator of the Sun as the solar cycle progresses. (Credit: NASA/MSFC).

But the northern hemisphere of the Sun has been much more active since 2006, with the southern hemisphere experiencing a lag in activity. “Usually this asymmetry lasts a year or so, and then the hemispheres synchronize,” said Giuliana de Toma of the High Altitude Observatory.

So far, several theories have been put forth as to why our tempestuous star seems to be straying from its usual self. Along with the standard 11-year cycle, it’s thought that there may be a longer, 100 year trend of activity and subsidence known as the Gleissberg Cycle.

The Sun is a giant ball of gas, rotating faster (25 days) at the equator than at the poles, which rotate once every 34.5 days. This dissonance sets up a massive amount of torsion, causing the magnetic field lines to stretch and snap, releasing massive amounts of energy. The Sun also changes polarity with every sunspot cycle, another indication that a new cycle is underway.

But predictions have run the gamut for Cycle #24. Recently, solar scientists have projected a twin peaked solar maximum for later this year, and thus far, Sol seems to be following this modified trend.  Initial predictions by scientists at the start of Cycle #24 was for the sunspot number to have reached 90 by August 2013; but here it is the end of July, and we’re sitting at 68, and it seems that we’ll round out the northern hemisphere Summer at a sunspot number of 70 or so.

Some researchers predict that the following sunspot Cycle #25 may even be absent all together.

“If this trend continues, there will be almost no spots in Cycle 25,” Noted Matthew Penn of the National Solar Observatory, hinting that we may be on the edge of another Maunder Minimum.

Looking back over solar cycles for the past 500 years. (Credit: D. Hathaway/NASA/MSFC).

The Maunder Minimum was a period from 1645 to 1715 where almost no sunspots were seen. This span of time corresponded to a medieval period known as the Little Ice Age. During this era, the Thames River in London froze, making Christmas “Frost Fairs” possible on the ice covered river. Several villages in the Swiss Alps were also consumed by encroaching glaciers, and the Viking colony established in Greenland perished. The name for the period comes from Edward Maunder, who first noted the minimum in papers published in the 1890s. The term came into modern vogue after John Eddy published a paper on the subject in the journal of Science in 1976. Keep in mind, the data from the period covered by the Maunder Minimum is far from complete— Galileo had only started sketching sunspots via projection only a few decades prior to the start of the Maunder Minimum. But tellingly, there was a span of time in the early 18th century when many researchers supposed that sunspots were a myth! They were really THAT infrequent…

Just what role a pause in the solar cycle might play in the climate change debate remains to be seen. Perhaps, humanity is getting a brief (and lucky) reprieve, a chance to get serious about controlling our own destiny and doing something about anthropogenic climate-forcing. On a more ominous note, however, an extended cooling phase may give us reason to stall on preparing for the inevitable while giving ammunition to deniers, who like to cite natural trends exclusively.

Down but not out? Sol looking more like its solar max-self earlier this month on July 8th. (Photo by author).

Whatever occurs, we now have an unprecedented fleet of solar monitoring spacecraft on hand to watch the solar drama unfold. STEREO A & B afford us a 360 degree view of the Sun. SOHO has now monitored the Sun for the equivalent of more than one solar cycle, and NASA’s Solar Dynamics Observatory has joined it in its scrutiny. NASA’s Interface Region Imaging Spectrograph (IRIS)  just launched earlier this year, and has already begun returning views of the solar atmosphere in unprecedented detail. Even spacecraft such as MESSENGER orbiting Mercury can give us vital data from other vantage points in the solar system.

Cycle #24 may be a lackluster performer, but I’ll bet the Sun has a few surprises in store. You can always get a freak cloud burst, even in the middle of a drought. Plus, we’re headed towards northern hemisphere Fall, a time when aurora activity traditionally picks up.

Be sure to keep a (safely filtered) eye on ol’ Sol— it may be the case over these next few years that “no news is big news!”