WISE Mission Completes All-sky Infrared Survey

This view of the Pleiades star cluster is a composite of hundreds of WISE images, a tiny fraction of all those collected to complete the full-sky survey. Image credit: NASA/JPL-Caltech/UCLA

[/caption]

If you take a lot of digital pictures, you’re probably familiar with the frustration of keeping track of dozens of files, and always running out of hard drive space to store them. Well, the scientists and engineers on NASA’s Wide-field Infrared Survey Explorer (WISE) mission have no pity for you. Their spacecraft just finished photographing the entire sky in exquisite detail: a total of 1.3 million photos.

“The eyes of WISE have not blinked since launch,” said William Irace, the mission’s project manager at NASA’s Jet Propulsion Laboratory in Pasadena, Calif. “Both our telescope and spacecraft have performed flawlessly and have imaged every corner of our universe, just as we planned.”

WISE surveys the sky in strips as it orbits the earth. It takes six months of constant observing to map the entire sky. By pointing at every part of the sky, astronomical surveys deliver excellent data covering both well-known objects and those that have never been seen before.

“WISE is filling in the blanks on the infrared properties of everything in the universe from nearby asteroids to distant quasars,” said Peter Eisenhardt of JPL, project scientist for WISE. “But the most exciting discoveries may well be objects we haven’t yet imagined exist.”

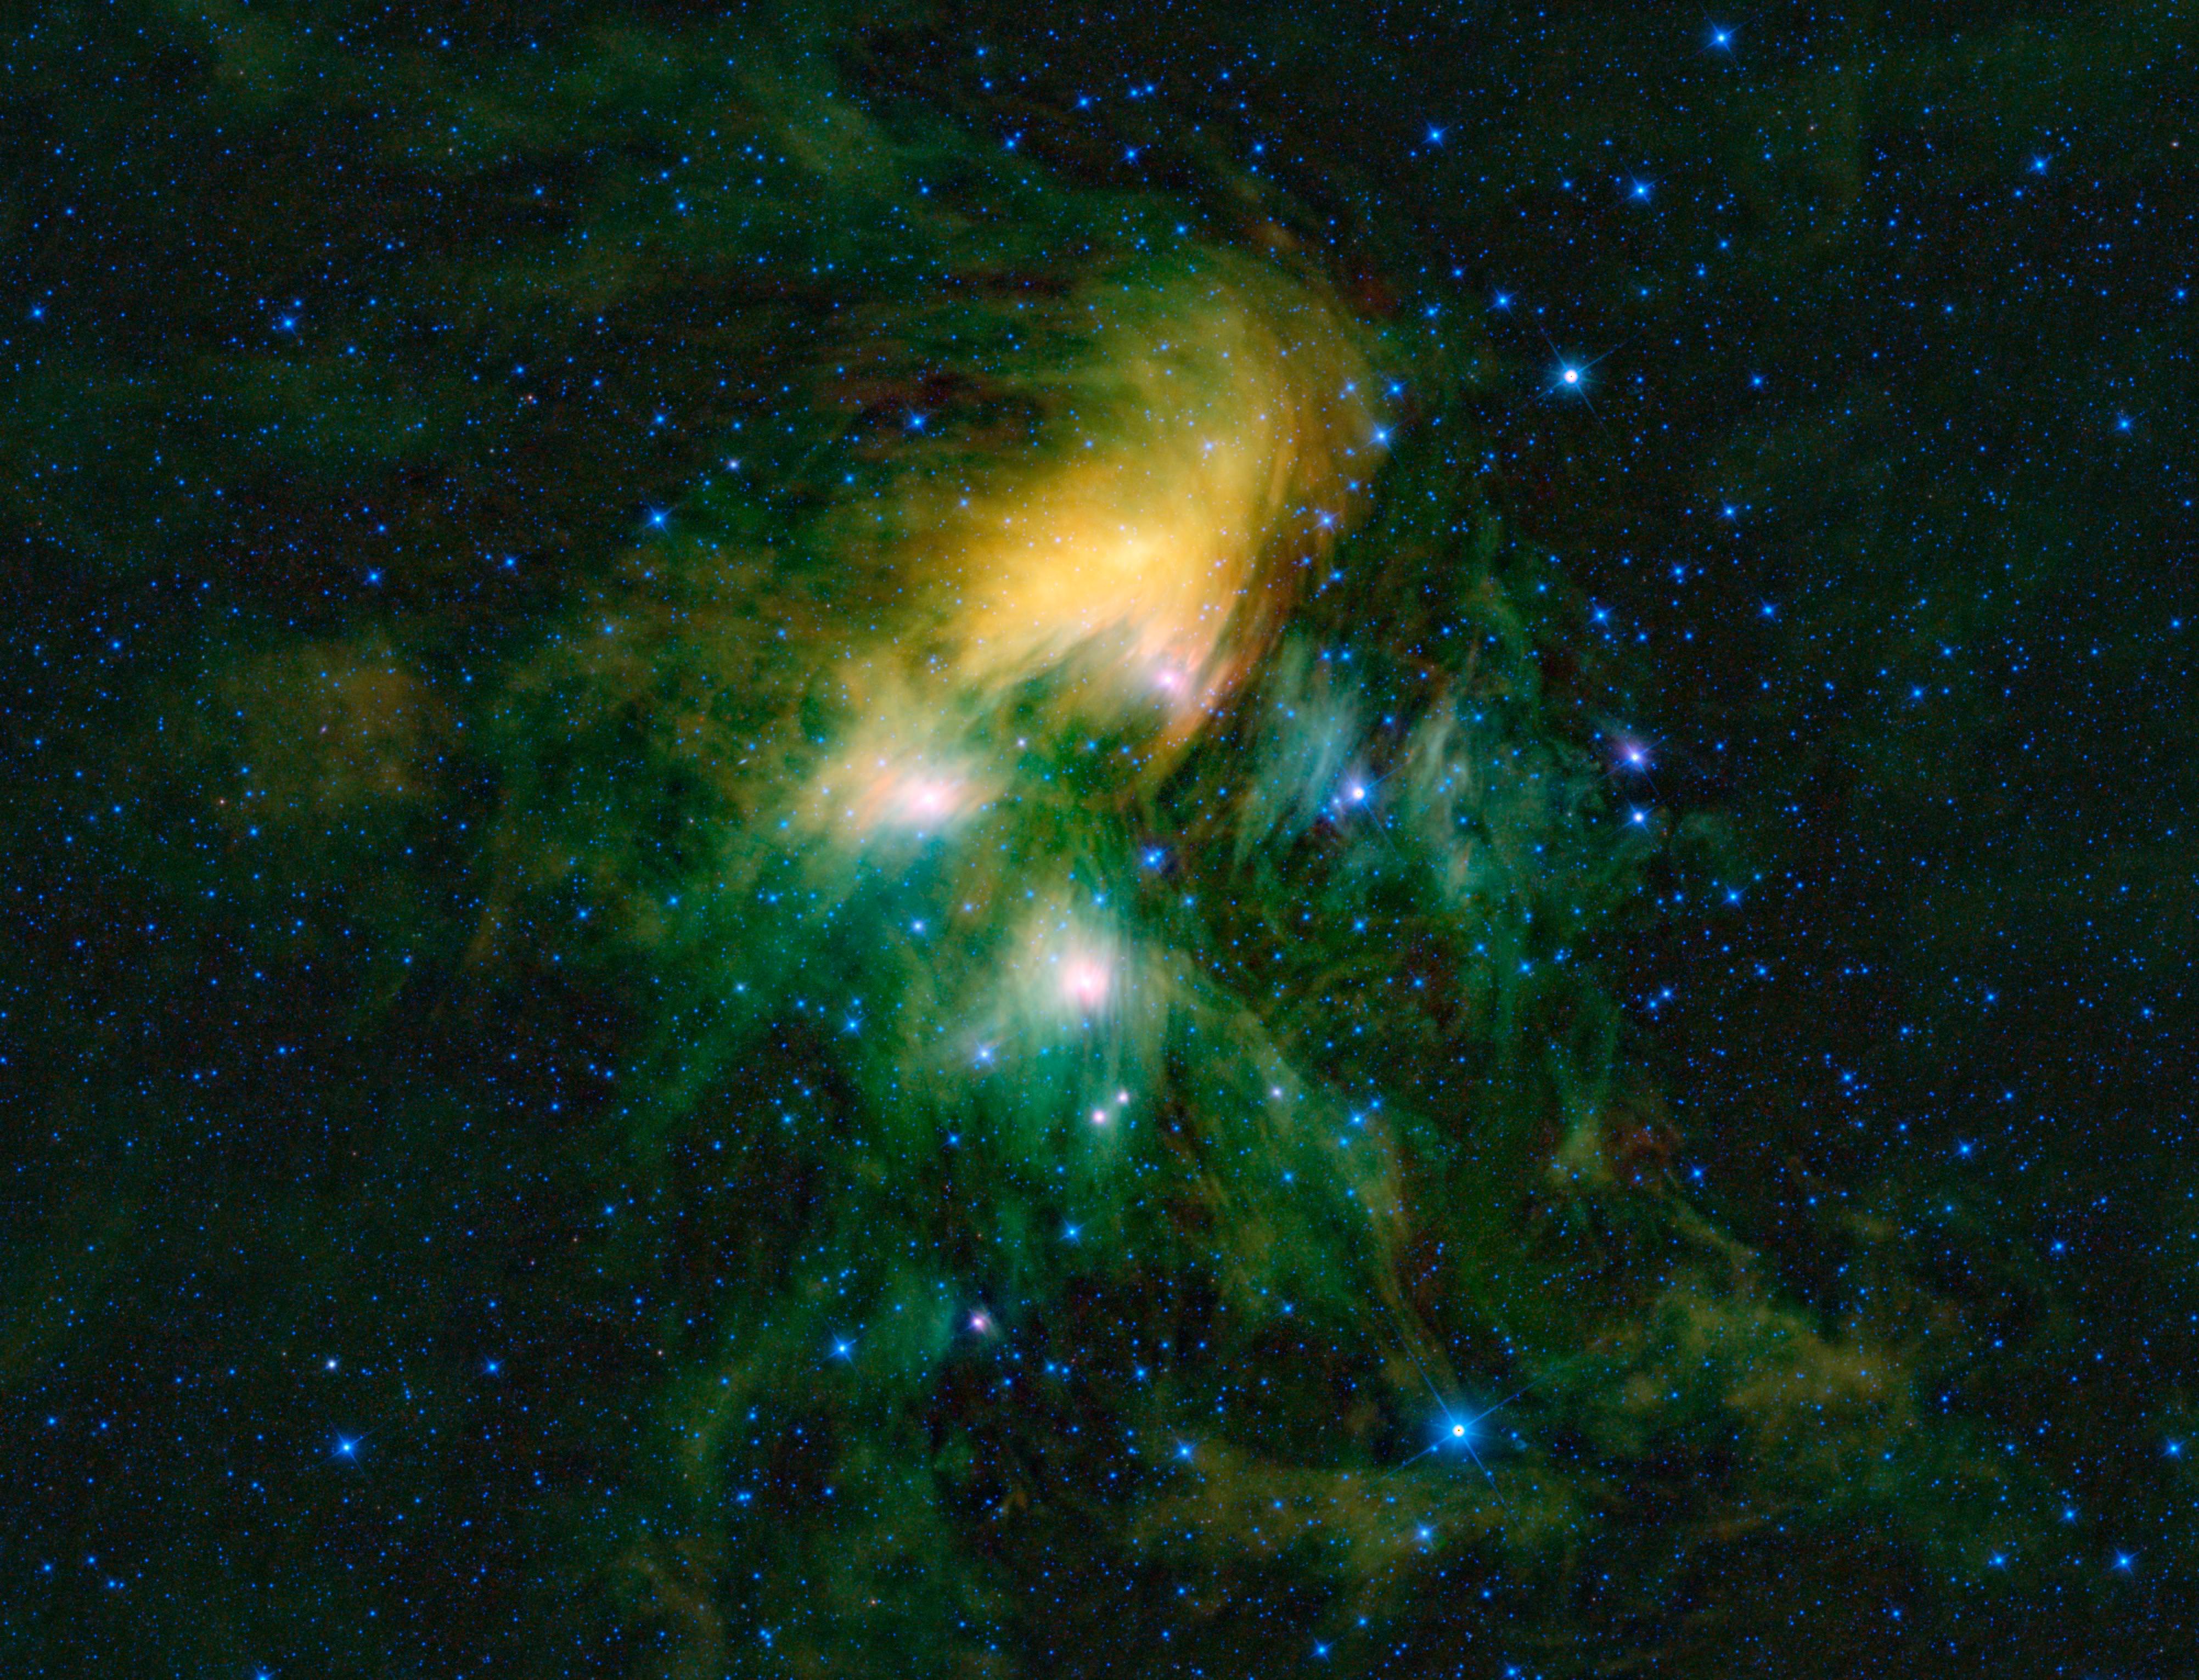
One example of a well-known object seen in new light by WISE is the Pleiades cluster: a group of young blue stars shrouded by dust that the cluster is currently passing through. In WISE’s false-color infrared vision, the hot stars look blue but the cooler dust clouds give off longer wavelengths of infrared light, causing them to glow in shades of yellow and green.

The WISE survey is particularly significant because such a wide range of objects in the universe are visible in infrared light. Giant molecular clouds glow in infrared light, as do brown dwarfs – objects that are bigger than planets but smaller than true stars. WISE can also see ultra-bright, extremely distant galaxies whose visible light has been stretched into the infrared by the expansion of the universe during its multi-billion-year journey.

The recently completed WISE survey also observed 100,000 asteroids in our solar system, many of which had never been seen before. 90 of the newly discovered asteroids are near-earth objects, whose orbits cross our own, making them potentially dangerous but also potential targets for future mission.

You might think that 1.3 million pictures would be plenty, but WISE will keep mapping the sky for another three months, covering half of the sky again and allowing astronomers to search for changes. The mission will end when the spacecraft’s solid hydrogen coolant finally runs out and the infrared detectors warm up (they don’t work as well when they are warm enough to emit the same wavelengths of infrared light that they are meant to detect).

But even as the telescope warms up, the astronomers on the WISE team will just be getting warmed up too. With nearly two million images, they will be busy making new discoveries for years to come.

Radiation from the Sun

Extreme Ultraviolet Sun

[/caption]Radiation from the Sun, which is more popularly known as sunlight, is a mixture of electromagnetic waves ranging from infrared (IR) to ultraviolet rays (UV). It of course includes visible light, which is in between IR and UV in the electromagnetic spectrum.

All electromagnetic waves (EM) travel at a speed of approximately 3.0 x 10 8 m/s in vacuum. Although space is not a perfect vacuum, as it is really composed of low-density particles, EM waves, neutrinos, and magnetic fields, it can certainly be approximated as such.

Now, since the average distance between the Earth and the Sun over one Earth orbit is one AU (about 150,000,000,000 m), then it will take about 8 minutes for radiation from the Sun to get to Earth.

Actually, the Sun does not only produce IR, visible light, and UV. Fusion in the core actually gives off high energy gamma rays. However, as the gamma ray photons make their arduous journey to the surface of the Sun, they are continuously absorbed by the solar plasma and re-emitted to lower frequencies. By the time they get to the surface, their frequencies are mostly only within the IR/visible light/UV spectrum.

During solar flares, the Sun also emits X-rays. X-ray radiation from the Sun was first observed by T. Burnight during a V-2 rocket flight. This was later confirmed by Japan’s Yohkoh, a satellite launched in 1991.

When electromagnetic radiation from the Sun strikes the Earth’s atmosphere, some of it is absorbed while the rest proceed to the Earth’s surface. In particular, UV is absorbed by the ozone layer and re-emitted as heat, eventually heating up the stratosphere. Some of this heat is re-radiated to outer space while some is sent to the Earth’s surface.

In the meantime, the electromagnetic radiation that wasn’t absorbed by the atmosphere proceeds to the Earth’s surface and heats it up. Some of this heat stays there while the rest is re-emitted. Upon reaching the atmosphere, part of it gets absorbed and part of it passes through. Naturally, the ones that get absorbed add to the heat already there.

The presence of greenhouse gases make the atmosphere absorb more heat, reducing the fraction of outbound EM waves that pass through. Known as the greenhouse effect, this is the reason why heat can build up some more.

The Earth is not the only planet that experiences the greenhouse effect. Read about the greenhouse effect taking place in Venus here in Universe Today. We’ve also got an interesting article that talks about a real greenhouse on the Moon by 2014.

Here’s a simplified explanation of the greenhouse effect on the EPA’s website. There’s also NASA’s Climate Change page.

Relax and listen to some interesting episodes at Astronomy Cast. Want to know more aboutUltraviolet Astronomy? How different is it from Optical Astronomy?

References:
NASA Science: The Electromagnetic Spectrum
NASA Earth Observatory

Infrared Spectroscopy

Silicates in Alien Asteroids. Credit: NASA/JPL/Caltech

[/caption]
Infrared spectroscopy is spectroscopy in the infrared (IR) region of the electromagnetic spectrum. It is a vital part of infrared astronomy, just as it is in visual, or optical, astronomy (and has been since lines were discovered in the spectrum of the Sun, in 1802, though it was a couple of decades before Fraunhofer began to study them systematically).

For the most part, the techniques used in IR spectroscopy, in astronomy, are the same or very similar to those used in the visual waveband; confusingly, then, IR spectroscopy is part of both infrared astronomy and optical astronomy! These techniques involve use of mirrors, lenses, dispersive media such as prisms or gratings, and ‘quantum’ detectors (silicon-based CCDs in the visual waveband, HgCdTe – or InSb or PbSe – arrays in IR); at the long-wavelength end – where the IR overlaps with the submillimeter or terahertz region – there are somewhat different techniques.

As infrared astronomy has a much longer ground-based history than a space-based one, the terms used relate to the windows in the Earth’s atmosphere where lower absorption spectroscopy makes astronomy feasible … so there is the near-IR (NIR), from the end of the visual (~0.7 &#181m) to ~3 &#181m, the mid (to ~30 &#181m), and the far-IR (FIR, to 0.2 mm).

As with spectroscopy in the visual and UV wavebands, IR spectroscopy in astronomy involves detection of both absorption (mostly) and emission (rather less common) lines due to atomic transitions (the hydrogen Paschen, Brackett, Pfund, and Humphreys series are all in the IR, mostly NIR). However, lines and bands due to molecules are found in the spectra of nearly all objects, across the entire IR … and the reason why space-based observatories are needed to study water and carbon dioxide (to take just two examples) in astronomical objects. One of the most important class of molecules (of interest to astronomers) is PAHs – polycyclic aromatic hydrocarbons – whose transitions are most prominent in the mid-IR (see the Spitzer webpage Understanding Polycyclic Aromatic Hydrocarbons for more details).

Looking for more info on how astronomers do IR spectroscopy? Caltech has a brief introduction to IR spectroscopy. The ESO’s Very Large Telescope (VLT) has several dedicated instruments, including VISIR (which is both an imager and spectrometer, working in the mid-IR); CIRPASS, a NIR integrated field unit spectrograph on Gemini; Spitzer’s IRS (a mid-IR spectrograph); and LWS on the ESA’s Infrared Space Observatory (a FIR spectrometer).

Universe Today stories related to IR spectroscopy include Infrared Sensor Could Be Useful on Earth Too, Search for Origins Programs Shortlisted, and Jovian Moon Was Probably Captured.

Infrared spectroscopy is covered in the Astronomy Cast episode Infrared Astronomy.

Sources:
http://en.wikipedia.org/wiki/Infrared_spectroscopy
http://www2.chemistry.msu.edu/faculty/reusch/VirtTxtJml/Spectrpy/InfraRed/infrared.htm
http://www.chem.ucla.edu/~webspectra/irintro.html