Chandra Infographic Shows Where The Color Comes From In Space Pictures

A part of the Small Magellanic Cloud galaxy is dazzling in this new view from NASA's Great Observatories. The Small Magellanic Cloud, or SMC, is a small galaxy about 200,000 light-years way that orbits our own Milky Way spiral galaxy. Credit: NASA.

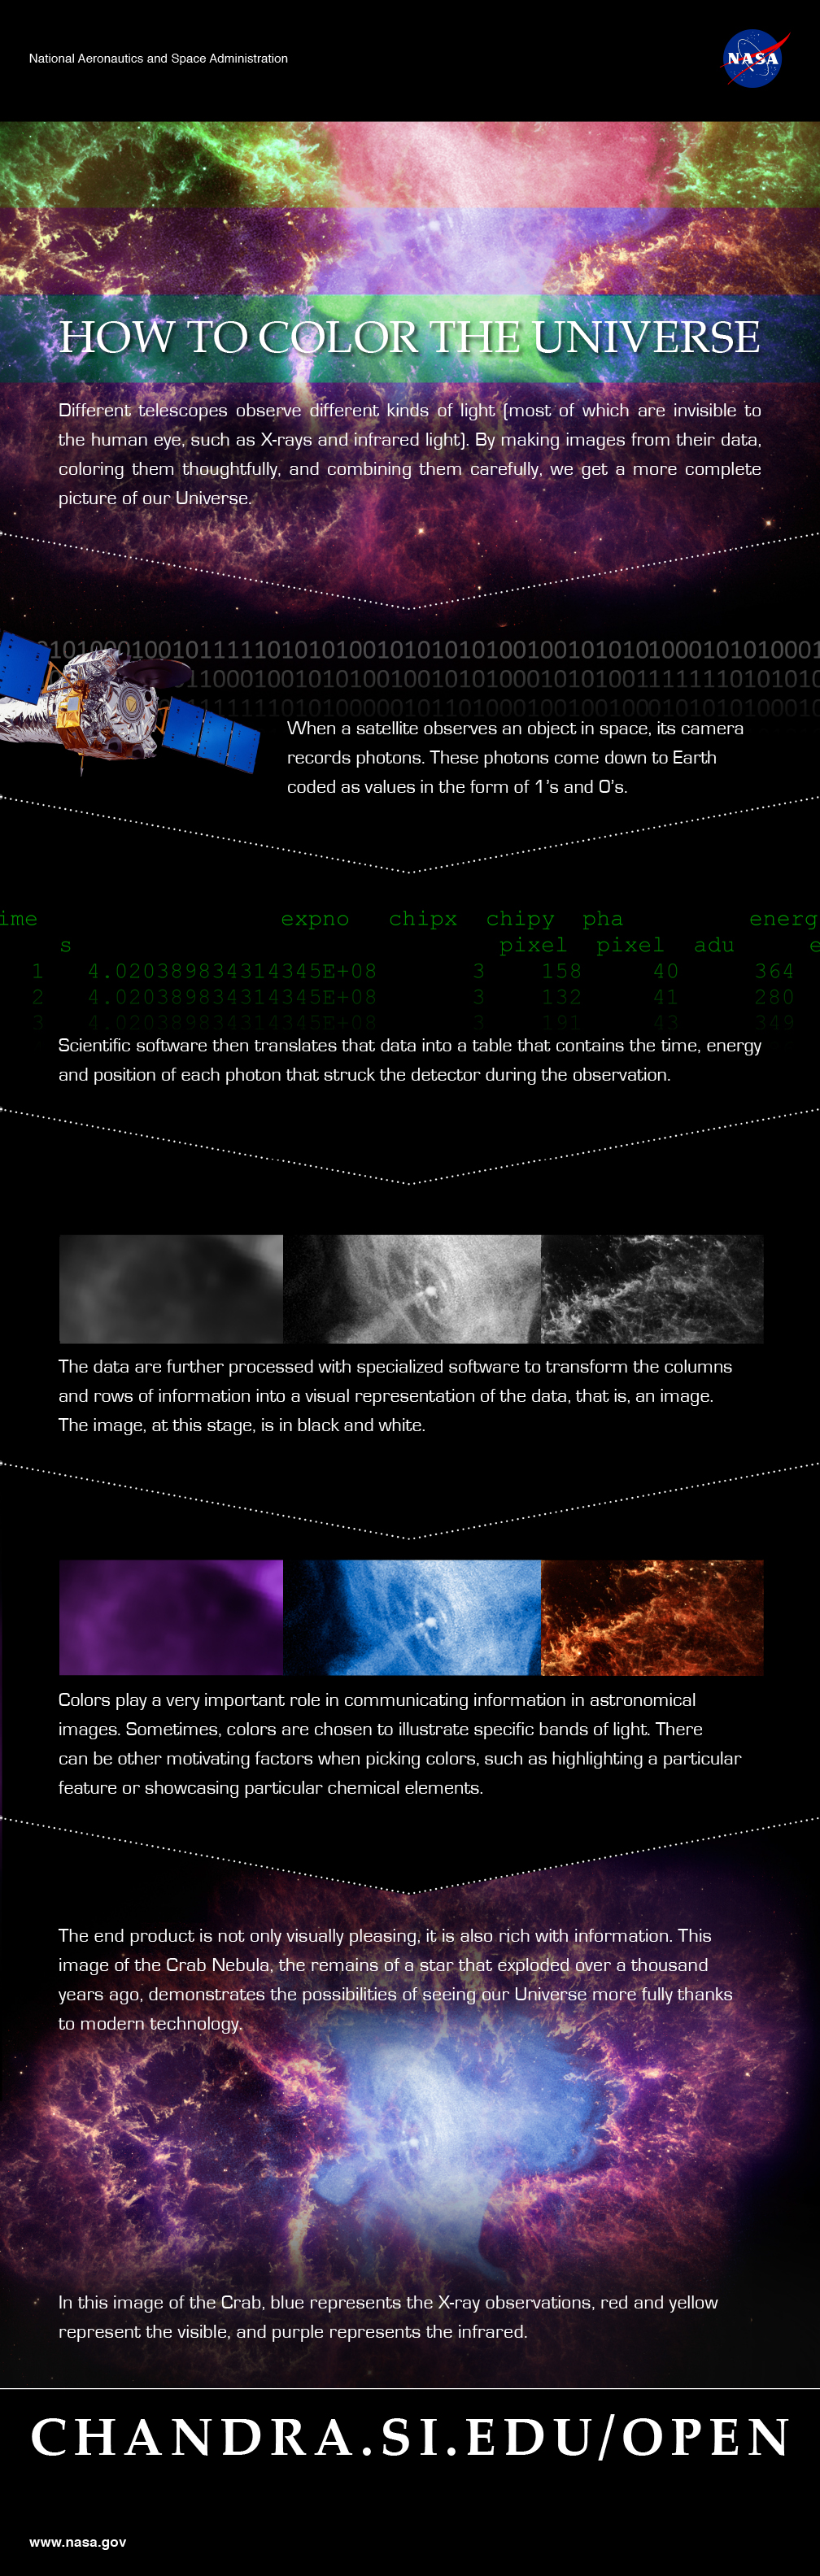
For your daily space zing, check out an infographic recently highlighted on the Chandra X-ray Observatory’s Google+ page. Called “How to Color the Universe” (see it below), it explains why the colors we see from space telescope pictures are added in after the data is gathered.

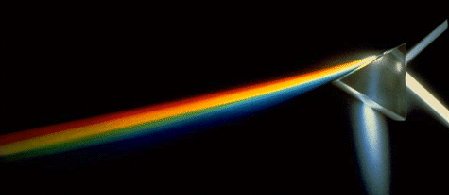
In a nutshell, the information is recorded by the telescope in photons, which is sent down to Earth in binary code (1s and 0s). Software renders these numbers into images, then astronomers pick the colors to highlight what to show in the data.

“Colors play a very important role in communication information in astronomical images,” the infographic states. “Sometimes, colors are chosen to illustrate specific bands of light. There can be other motivating factors when picking colors, such as highlighting a particular feature or showcasing particular chemical elements.”

This multiwavelength image of the galaxy NGC 3627 contains X-rays from Chandra (blue), infrared data from Spitzer (red), and optical data from Hubble and the Very Large Telescope (yellow).  Astronomers conducted a survey of 62 galaxies, which included NGC 3627, to study the supermassive black holes at their centers.  Among this sample, 37 galaxies with X-ray sources are supermassive black hole candidates, and seven were not previously known. Confirming previous Chandra results, this study finds the fraction of galaxies hosting supermassive black holes is much higher than in optical searches for black holes that are relatively inactive.
This multiwavelength image of the galaxy NGC 3627 contains X-rays from Chandra (blue), infrared data from Spitzer (red), and optical data from Hubble and the Very Large Telescope (yellow). Astronomers conducted a survey of 62 galaxies, which included NGC 3627, to study the supermassive black holes at their centers. Among this sample, 37 galaxies with X-ray sources are supermassive black hole candidates, and seven were not previously known. Confirming previous Chandra results, this study finds the fraction of galaxies hosting supermassive black holes is much higher than in optical searches for black holes that are relatively inactive.

It’s natural right now to think that astronomers are adding data where none exist, but Chandra’s public affairs employees (Kim Arcand and Megan Watzke) wrote a Huffington Post piece in September addressing this, too.

“Often, scientists choose colors to represent certain scientific phenomena such as structures that appear in one wavelength and not another. This might be why the planet is pink or the galaxy green. Or they might want to show where different elements like iron or magnesium are found in an object, and they can demonstrate this by assigning the sliver of light for each in different colors,” they wrote.

“In other instances, colors are picked to make an image the most pleasing or beautiful. In some of these instances, cries of the images being faked can erupt. But they are not fake, no matter what colors are used. We can’t see these data without scientific tools and processing. The color in these images enhances the data but does not alter them.”

If you have a high level of comfort manipulating images, Chandra offers a website to create images from raw data yourself, complete with a tutorial showing you how to do it.

color_infograph

Mercury’s Many Colors

Although composited from expanded wavelengths of light, this wide-angle image from NASA’s MESSENGER spacecraft shows the amazing variation of colors and tones to be found on Mercury’s Sun-scoured surface.


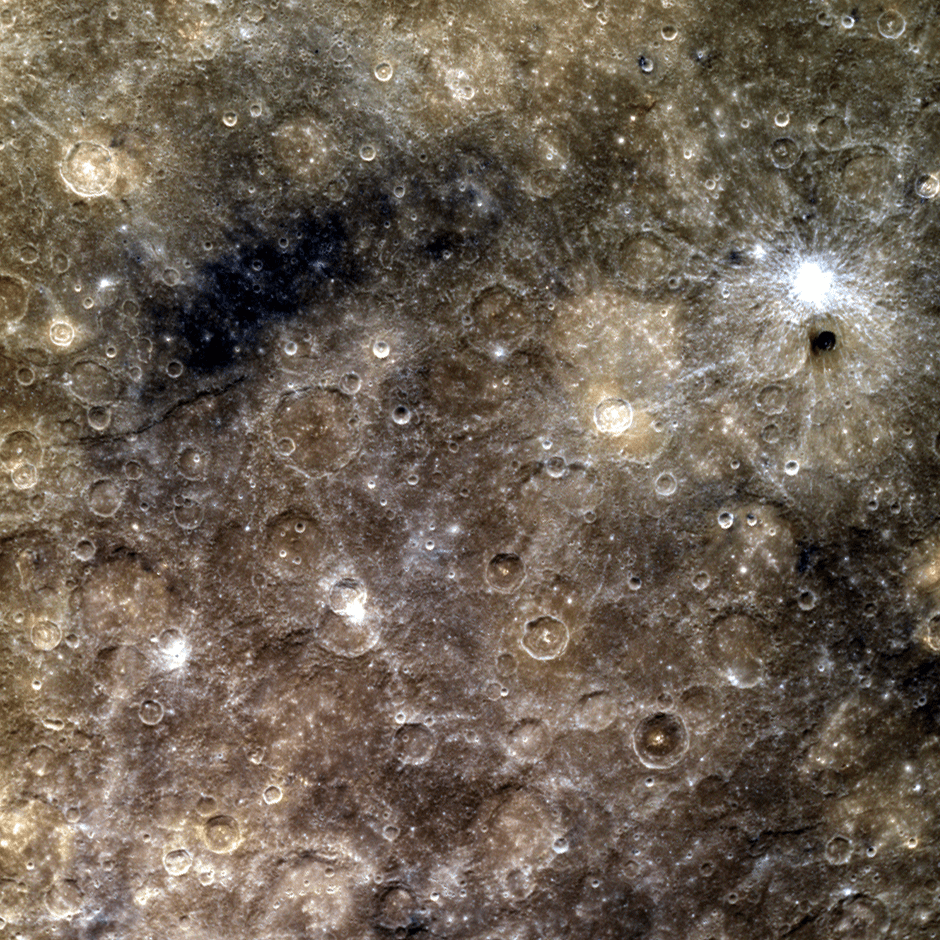
This scene lies between Mercury’s Moody and Amaral craters, spanning an area of about 1200 km (745 miles). The patch of dark blue Low Reflectance Material (LRM) in the upper left of the image and the bright rayed crater on the right make this a diverse view of Mercury’s surface. Note the curious small, dark crater just below the bright rayed crater on the right.

Dark LRM material is thought to indicate the presence of a mineral called ilmenite, which is composed of iron and titanium and has been revealed through volcanic, cratering and erosion processes.

More Mercury images: Postcards from the (Inner) Edge

Did you know that until MESSENGER arrived in 2008 half of Mercury had never been seen? And that although Mercury is the closest planet to the Sun there may still be water ice on its surface? Learn more about these and other fascinating facts about Mercury here.

Image: NASA/Johns Hopkins University Applied Physics Laboratory/Carnegie Institution of Washington


Visible Light

Sunlight passing through a prism. Image credit: NASA

[/caption]
Of all the wavelengths in the electromagnetic spectrum, those that lie between 400 nm to 700 nm are the ones most familiar to us. That’s because these are the waves that comprise what we call visible light. 

When we see objects, it’s because they’re being illuminated by visible light. When we see that the sky is blue, or the grass is green, or hair black, or that an apple is red, that’s because we’re seeing different wavelengths within the 400nm-700nm band. Because of the waves in this band, a lot has been learned about the properties of electromagnetic waves.

Through visible light, reflection & refraction are easily observed. So are interference and diffraction. Mirrors, lenses, prisms, diffraction gratings, and spectrometers have all been put to use to understand and manifest the qualities of the light that we see through our naked eyes.

Galileo’s telescope, which was composed of a simple set of lenses, made use of the refractive properties of light to magnify distant objects. Today’s  binoculars and periscopes capitalize on the optical phenomenon called Total Internal Reflection by using prisms to improve on what early refractive telescopes were capable of achieving.

As mentioned earlier, visible light is made up of the wavelengths that range from 400 nm to 700 nm. Each wavelength is characterized by a unique color, with violet on one end (adjacent to ultraviolet light) and red on the other (adjacent to infrared light). When all these wavelengths are combined together, they make up what is known as white light. 

You can separate these wavelengths (and the corresponding colors) by letting them pass through either a prism or a diffraction grating. The magnificent array of colors that we see in a rainbow, on a diamond, or even a peacock’s tail are examples of this separation.

All phenomena of visible light such as reflection, refraction, interference, and diffraction are also exhibited by non-visible wavelengths. Hence, by understanding these phenomena, and applying them to the non-visible wavelengths, scientists were able to unearth many of nature’s secrets. In fact, if we trace back the roots of modern physics, particularly the wave-particle duality of matter, we will be led back to its manifestation in visible light. 

The study of visible light falls under the realm of optics. Among the scientists who have contributed substantially to the development of optics are Christiaan Huygens for his wavelets and a wave theory of light, Isaac Newton for his contributions on reflection and refraction, James Clerk Maxwell for the propagation of electromagnetic waves as explained in a series of equations, and Heinrich Hertz for verifying the truth of those equations through experiments.

You can read more about visible light here in Universe Today. Want to know where visible light comes from? How about a visible light image of a distant galaxy?

There’s more about it at NASA and Physics World:
Visible Light Waves
The special effect of physics

Here are two episodes at Astronomy Cast that you might want to check out as well:
Optical Astronomy
Interferometry

Sources:
Windows to Universe
NASA: Visible Light
Wikipedia: Christiaan Huygens
NASA: Maxwell and Hertz