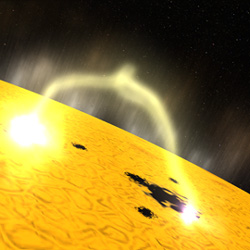
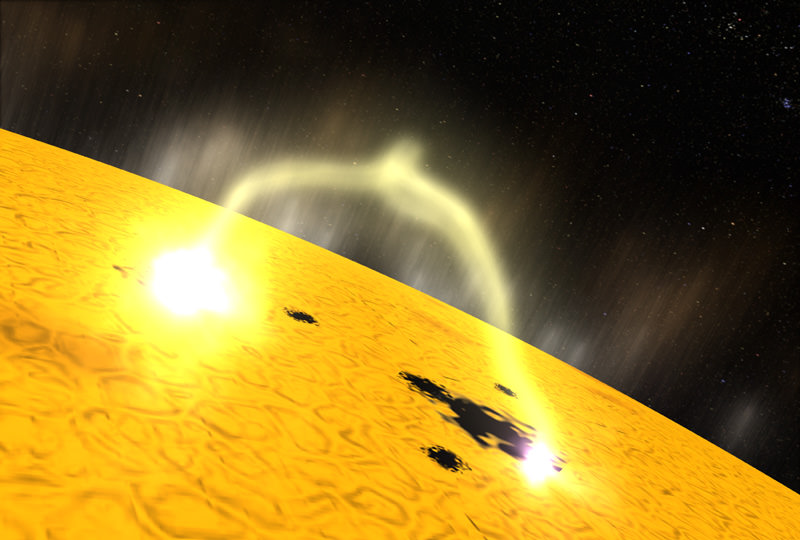
Keeping the Rings In Line

Saturn’s moon Prometheus is seen shepherding the inner edge of Saturn’s F ring. Prometheus is 102 kilometers (63 miles) across and was captured in a close-up view by the Cassini spacecraft near the time of orbital insertion at Saturn PIA06098. A number of clumps are visible here along the arcing F ring.

The image was taken with the Cassini spacecraft narrow angle camera on Aug. 5, 2004, at a distance of 8.2 million kilometers (5.1 million miles) from Saturn through a filter sensitive to visible green light. The image scale is 49 kilometers (33 miles) per pixel. Contrast was slightly enhanced to aid visibility.

The Cassini-Huygens mission is a cooperative project of NASA, the European Space Agency and the Italian Space Agency. The Jet Propulsion Laboratory, a division of the California Institute of Technology in Pasadena, manages the Cassini-Huygens mission for NASA’s Science Mission Directorate, Washington, D.C. The Cassini orbiter and its two onboard cameras were designed, developed and assembled at JPL. The imaging team is based at the Space Science Institute, Boulder, Colo.

For more information about the Cassini-Huygens mission, visit http://saturn.jpl.nasa.gov and the Cassini imaging team home page, http://ciclops.org .

Original Source: NASA JPL News Release

Book Review: Sun Observer’s Guide

Our sun produces vast amounts of energy through nuclear reactions. Due to this energy and the sun’s huge mass, the sun consists mostly of sub atomic particles and ionized atoms especially hydrogen and helium. These rocket and careen within the sun and then via convection and radiation they work their way out through the surface, the photosphere, and onward throughout the solar system. The photosphere, tenuous as it is, can be seen to resemble porridge with a fairly homogeneous mix of small light and dark patches. Occasionally, a large dark spot occurs. Seemingly harmless, this spot is quite often a burst of energy and matter that sends an energetic stream of particles and radiation out from the sun. Perhaps harmless in appearance these spots can disrupt radio traffic, fail electrical power grids and knock out satellites. But on the good side, these spots are the main subjects for sun observers.

Using sun spots, observers can assign a latitude and longitude coordinate system to the sun. They can define the sun’s rotation rate and its ‘mood’. A sullen sun may have only one or even no sunspots on its surface. At other times, the playful sun could have hundreds of sunspots. This activity cycles through its minimum and maximum over an eleven year period. However the sun can quiet down for a longer time. Between 1645 and 1715 there was almost no sun spot activity. We refer to this time as a little ice age here on Earth due to the much cooler temperatures experienced. Of course, the opposite can happen. Unusually high sun spot activity occurred in the years 1000 to 1250 and a warmer climate allowed Vikings to settle in Greenland. So, not only are sun spots the main characteristic of our sun, they also have a direct influence on the earth’s climate. There can’t be a much better reason for observers to continue their studies!

One of the main benefits of observing the sun is that minimal equipment is required. Some observations are achievable with binoculars and a few sheets of paper. A small refractor telescope is better than binoculars, but due to the sun’s energy, small is actually better than large. And using paper with appropriate grids and scales on it aids in locating and sizing sun spots that do appear. Then, using the techniques described in this book, a viewer can characterize and record their observations in a manner that is useful for their own benefit and in a manner that would be advantageous to professional bodies, if the observer wanted to share their work. This isn’t that far fetched, as the author herself contributes as an amateur and then works with an organization that makes use of amateur observations.

Aside from sun spots, the other great viewing attraction of the sun is its eclipse. Because of its rarity and its spectacular sight, the eclipse draws people from everywhere in the world. If you are fortunate enough to be on a path of totality, you will see the sun go through a number of distinct phases. It starts with an annular eclipse, where the moon moves to block the sun’s light. When the moon almost exactly covers the sun only some of the photosphere is visible at the moon’s edges and the moon appears to have a ring of fire about its circumference. Should a valley on the moon allow a ray of light to sparkle and flash in the sun’s normal white colour with the beads somewhat like a diamond ring. At totality the photosphere is completely blocked and the ghostly corona shimmers and shines in vibrant ribbons floating around the ring of the moon. Then these phases repeat themselves in reverse order, as the moon continues in its orbit past the sun. The solar eclipse is truly worth travelling to see.

To learn a bit about the sun and of the pleasures in viewing it then Pam Spence’s book, Sun Observer’s Guide, is a handy reference. Sometimes it can be repetitive in its instructions and there is very little on why the sun does what it does. However, there is more than sufficient detail on how to look, what to look for and what the value is of the observations. The unaided and unknowing eye may consider the sun a rock steady source of light and heat, but an educated viewer, with the help of this book, will know better.

To read more reviews, or order the book online, visit Amazon.com.

Review by Mark Mortimer

Methane and Water Overlap on Mars

Recent analyses of ESA?s Mars Express data reveal that concentrations of water vapour and methane in the atmosphere of Mars significantly overlap. This result, from data obtained by the Planetary Fourier Spectrometer (PFS), gives a boost to understanding of geological and atmospheric processes on Mars, and provides important new hints to evaluate the hypothesis of present life on the Red Planet.

PFS observed that, at 10-15 kilometres above the surface, water vapour is well mixed and uniform in the atmosphere. However, it found that, close to the surface, water vapour is more concentrated in three broad equatorial regions: Arabia Terra, Elysium Planum and Arcadia-Memnonia.

Here, the concentration is two to three times higher than in other regions observed. These areas of water vapour concentration also correspond to the areas where NASA?s Odyssey spacecraft has observed a water ice layer a few tens of centimetres below the surface, as Dr Vittorio Formisano, PFS principal investigator, reports.

New in-depth analysis of PFS data also confirms that methane is not uniform in the atmosphere, but concentrated in some areas. The PFS team observed that the areas of highest concentration of methane overlap with the areas where water vapour and underground water ice are also concentrated. This spatial correlation between water vapour and methane seems to point to a common underground source.

Initial speculation has taken the underground ice layer into account. This could be explained by the ?ice table? concept, in which geothermal heat from below the surface makes water and other material move towards the surface. It would then freeze before getting there, due to the very low surface temperature (many tens of degrees Celsius below zero).

Further investigations are needed to fully understand the correlation between the ice table and the presence and distribution of water vapour and methane in the atmosphere.

In other words, can the geothermal processes which ?feed? the ice table also bring water vapour and other gases, like methane, to the surface? Can there be liquid water below the ice table? Can forms of bacterial life exist in the water below the ice table, producing methane and other gases and releasing them to the surface and then to the atmosphere?

The PFS instrument has also detected traces of other gases in the Martian atmosphere. A report on these is currently under peer review. Further studies will address whether these gases can be linked to water and methane and help answer the unresolved questions. In-situ observations by future lander missions to Mars may provide a more exhaustive solution to the puzzle.

Original Source: ESA News Release

Early Universe Might Not Have Been So Violent

The Universe has experienced far fewer collisions among galaxies than previously thought, according to a new analysis of Hubble Space Telescope data by an ANU researcher.

Astronomer Dr Alister Graham, from the Research School of Astronomy and Astrophysics, analysed a sample of galaxies located 100 million light years away ? and discovered that the number of violent encounters between large galaxies is around one-tenth of the number earlier studies had suggested.

Although theoretical models predict that fewer collisions were involved in the evolution of the universe, Dr Graham?s observations are the first that confirm these theories.

?The new result is in perfect agreement with popular models of hierarchical structure formation in our universe,? Dr Graham said. ?Galactically speaking, things appear to be a little safer out there.?

For years, astronomers have known the collision and merger of galaxies resulted in the formation of larger galaxies. The biggest of these galaxies appear largely devoid of stars at their cores, a phenomenon believed to result from the damage caused by the ?supermassive? black holes from the smaller galaxies as they merge near the centre of the new galaxy.

However, rather than requiring multiple mergers to clear away the stars from the heart of a galaxy, Dr Graham has shown just one collision between two galaxies is sufficient.

Using images from Hubble’s Wide Field Planetary Camera 2, Dr Graham was able to examine galaxies 100 million light years away, whose cores had not been depleted of stars, providing an important insight into star distributions before any major collisions occurred. By considering the overall galaxy structure, he was able to more accurately measure the sizes of the depleted cores in the galaxies.

The result: the mass of the deficit of stars at the galaxies centres equalled rather than exceeded the mass of the black hole.

?If there had been 10 mergers, we would have found a star deficit 10 times the mass of the central black hole. Many galaxies have large central black holes but no depleted cores. It is therefore not the case that every black hole is formed by gobbling up its surrounding stars. Instead, we?re observing the demolished cores of galaxies after the union of two massive cosmic wrecking balls.?

Although small satellite galaxies have been captured by our galaxy, the Milky Way, it has not experienced a recent major merger. If it had, the plane of its disk, visible as a faint wide ribbon in the night sky, would have been scattered and dispersed across the heavens. Such a fate is expected in about three billion years when the Milky Way collides with a neighbouring spiral galaxy, Andromeda.

The research was conducted during Dr Graham’s tenure at the University of Florida and was funded by NASA via a grant from the Space Telescope Science Institute in Baltimore. Dr Graham?s research will appear in the September 20 edition of Astrophysical Journal Letters.

Original Source: ANU News Release

Genesis Recovery is Going Well

Genesis team scientists and engineers continue their work on the mission’s sample return canister in a specially constructed clean room at the U.S. Army Proving Ground in Dugway, Utah. As more of the capsule’s contents are revealed, the team’s level of enthusiasm for the amount of science obtainable continues to rise.

At present, the science canister that holds the majority of the mission’s scientific samples is lying upside down – on its lid. Scientists are very methodically working their way “up” from the bottom portion of the canister by trimming away small portions of the canister’s wall. The team continues to extract, from the interior of the science canister, small but potentially analyzable fragments of collector array material. One-half of a sapphire wafer was collected Tuesday – the biggest piece of collector array to date.

The mission’s main priority is to measure oxygen isotopes to determine which of several theories is correct regarding the role of oxygen in the formation of the solar system. Scientists hope to determine this with isotopes collected in the four target segments of the solar wind concentrator carried by the Genesis spacecraft. The condition of these segments will be better known over the next few days, after the canister’s solar wind concentrator is extricated. At this time, it is believed that three of these segments are relatively intact and that the fourth may have sustained one or more fractures. There are no concrete plans regarding the shipping date of the Genesis capsule or its contents from Dugway to the Johnson Space Center in Houston. The team continues its meticulous work and believes that a significant repository of solar wind materials may have survived that will keep the science community busy for some time.

The Genesis sample return capsule landed well within the projected ellipse path in the Utah Test and Training Range on Sept. 8, but its parachutes did not open. It impacted the ground at nearly 320 kilometers per hour (nearly 200 miles per hour).

News and information about Genesis is available on the Internet at http://www.nasa.gov/genesis. For background information about Genesis, visit http://genesismission.jpl.nasa.gov. For information about NASA on the Internet, visit http://www.nasa.gov.

Original Source: NASA/JPL News Release

Wallpaper: Saturn’s Translucent Rings

Saturn’s ring shadows appear wrapped in a harmonious symphony with the planet in this color view from the Cassini spacecraft.

Saturn and its rings would nearly fill the space between Earth and the Moon. Yet, despite their great breadth, the rings are a few meters thick and, in some places, very translucent. This image shows a view through the C ring, which is closest to Saturn, and through the Cassini division, the 4,800-kilometer-wide gap (2,980-miles) that arcs across the top of the image and separates the optically thick B ring from the A ring. The part of the atmosphere seen through the gap appears darker and more bluish due to scattering at blue wavelengths by the cloud-free upper atmosphere.

The different colors in Saturn’s atmosphere are due to particles whose composition is yet to be determined. This image was obtained with the Cassini spacecraft narrow angle camera on July 30, 2004, at a distance of 7.6 million kilometers (4.7 million miles) from Saturn.

The Cassini-Huygens mission is a cooperative project of NASA, the European Space Agency and the Italian Space Agency. The Jet Propulsion Laboratory, a division of the California Institute of Technology in Pasadena, manages the Cassini-Huygens mission for NASA’s Science Mission Directorate, Washington, D.C. The Cassini orbiter and its two onboard cameras were designed, developed and assembled at JPL. The imaging team is based at the Space Science Institute, Boulder, Colo.

For images and information about the Cassini-Huygens mission, visit http://saturn.jpl.nasa.gov and http://www.nasa.gov/cassini. Images are also available at the Cassini imaging team home page, http://ciclops.org.

Original Source: NASA/JPL News Release

Seeing Our Sun’s Future in Other Stars

For more than 400 years, astronomers both professional and amateur have taken a special interest in observing Mira stars, a class of variable red giants famous for pulsations that last for 80-1,000 days and cause their apparent brightness to vary by a factor of ten times or more during a cycle.

An international team of astronomers led by Guy Perrin from the Paris Observatory/LESIA (Meudon, France) and Stephen Ridgway from the National Optical Astronomy Observatory (Tucson, Arizona, USA) has used interferometric techniques to observe the close environments of five Mira stars, and were surprised to find that the stars are surrounded by a nearly transparent shell of water vapor, and possibly carbon monoxide and other molecules. This shell gives the stars a deceptively large apparent size. By penetrating through this layer using the combined light of several telescopes, the team found that Mira stars are likely only half as large as formerly believed.

?This discovery resolves nagging inconsistencies between observations of the size of Mira stars, and models describing their composition and pulsations, which now can be seen to generally agree with each other,? Ridgway explains. ?The revised picture is that Mira stars are very luminous yet relatively normal stars of the asymptotic giant branch, but they have a resonant pulsation that drives their large variability.?

Mira stars are particularly interesting since they are similar in size to the Sun and they are undergoing a late stage of the same evolutionary path that all one-solar mass stars, including the Sun, will experience. Therefore, these stars illustrate the fate of our Sun five billion years from now. If such a star, including its surrounding shell, were located at the Sun?s position in our solar system, its vaporous shell would extend beyond the orbit of Mars.

Although they are really very large in diameter (up to a few hundred solar radii), red giant stars are point-like to unaided human eyes on Earth, and even the largest telescopes fail to distinguish their surfaces. This challenge can be overcome by combining signals from separate telescopes using a technique called astronomical interferometry that makes it possible to study very small details in the close surroundings of Mira stars. Ultimately, images of the observed stars can be reconstructed.

Mira stars are named after the first such known object, Mira (or Omicron Ceti). One possible explanation for their significant variability is that large amounts of material, including dust and molecules, are produced during each cycle. This material blocks much of the outgoing stellar radiation, until the material becomes diluted by expansion. The close environment of Mira stars is therefore very complex, and the characteristics of the central object are difficult to observe.

To study the close environment of these stars, the team led by Perrin and Ridgway carried out observations at the Infrared-Optical Telescope Array (IOTA) of the Smithsonian Astrophysical Observatory in Arizona. IOTA is a Michelson stellar interferometer, with two arms forming an L-shaped array. It operates with three collectors that can be located at different stations on each arm. In the present study, observations were made at several wavelengths using different telescope spacings ranging from 10 to 38 meters.

From these observations, the team was able to reconstruct the variation of the stellar brightness across the surface of each star. Details down to about 10 milli-arcseconds can be detected. For comparison, at the Moon?s distance, this would correspond to seeing features down to 20 meters in size.

The observations were made at near-infrared wavelengths that are of particular interest for the study of water vapor and carbon monoxide. The role played by these molecules was suspected some years ago by the team and independently confirmed by observations with the Infrared Space Observatory. The new observations using IOTA clearly demonstrate that Mira stars are surrounded by a molecular layer of water vapor and, in at least some cases, of carbon monoxide. This layer has a temperature of about 2,000 K and extends to about one stellar radius above the stellar photosphere, or roughly 50 percent of the observed diameter of the Mira stars in the sample.

Previous interferometric studies of Mira stars led to estimates of star diameters that were biased by the presence of the molecular layer, and were thus much overestimated. This new result shows that the Mira stars are about one-half as large as previously believed.

The new observations presented by the team are interpreted in the framework of a model that bridges the gap between observations and theory. The space between the star?s surface and the molecular layer very likely contains gas, like an atmosphere, but it is relatively transparent at the observed wavelengths. In visible light, the molecular layer is rather opaque, giving the impression that it is a surface, but in the infrared, it is thin and the star can be seen through it.

This model is the first ever to explain the structure of Mira stars over a wide range of spectral wavelengths from the visible to the mid-infrared and to be consistent with the theoretical properties of their pulsation. However, the presence of the layer of molecules far above the stellar surface is still somewhat mysterious. The layer is too high and dense to be supported purely by atmospheric pressure. The pulsations of the star probably play a role in producing the molecular layer, but the mechanism is not yet understood.

As Mira stars represent a late evolutionary stage of Sun-like stars, it will be very interesting to better describe the processes that occur in and around them, as a foreshadowing of the Sun?s own expected fate in the distant future. Mira stars eject large amounts of gas and dust into space, typically about one-third Earth mass per year, thus providing more than 75 percent of the molecules in the galaxy. The carbon, nitrogen, oxygen and other elements of which we are made were mostly produced in the interior of such stars (with heavier elements coming from supernovae), and are then returned to space via this mass loss to become part of new stars and planets. The maturing technique of interferometry is revealing details of the Mira atmosphere, bringing scientists close to observing and understanding the production and ejection of molecules and dust, as these stars recyle their contents on an astronomical scale.

The paper ?Unveiling Mira stars behind the molecules: Confirmation of the molecular layer model with narrow band near-infrared interferometry,? by Perrin et al., will appear in an upcoming issue of the journal Astronomy & Astrophysics.

Original Source: NOAO News Release

NASA Centres Could Be Damaged by Ivan

NASA’s Stennis Space Center in Mississippi and the Michoud Assembly Facility in New Orleans are riding out Hurricane Ivan, which made landfall near Gulf Shores, Alabama, overnight. NASA has made preparations to secure important space flight hardware against damage.

Stennis, where Space Shuttle engines are tested before flight, is about 45 miles inland near the Mississippi-Louisiana border and is home to about 300 NASA personnel and 1,250 NASA contractors as well as employees from other agencies. Workers there were sent home Tuesday, Sept. 14 to prepare for the storm, and the center is not expected to open before Friday, Sept. 17. Information for Stennis employees will be posted on http://www.nasa.gov/stennis as it becomes available.

A team of about 50 essential personnel will ride out the storm at Stennis. Two flight-qualified Space Shuttle Main Engines at Stennis have been secured; one was put back into its container, and the other was wrapped in plastic. Two developmental engines were enclosed on their test stands and protected.

A ride-out team will also remain in place through the storm at Michoud, across the Mississippi-Louisiana border about 40 miles to the southwest of Stennis. The NASA facility, operated by Lockheed-Martin, manufactures and assembles the large Space Shuttle external fuel tanks, and is home to about 3,900 employees from NASA, Lockheed-Martin and other agencies. Lockheed Martin and NASA workers were dismissed Tuesday, Sept. 14. to make preparations at home, and the facility is not expected to open before Friday, Sept. 17. Contact information for Michoud employees is available at http://www.nasa.gov/marshall.

The shuttle fuel tanks at Michoud have been secured. Equipment has been moved indoors, facilities have been sandbagged, and important materials — such as insulating foam and adhesive — have been loaded onto trucks to be transported out of the area, if necessary.

KSC Recovering From Frances
Meanwhile, approximately 14,000 people returned to work at NASA’s Kennedy Space Center (KSC) this week, following an 11-day closure due to Hurricane Frances. Recovery efforts are already underway.

“We really saw our readiness for hurricanes Charley and Frances pay off,” said William Readdy, NASA’s associate administrator for space operations. “KSC was in the path of those two strong storms, and while some of our buildings were damaged, we made sure our workforce was safe and had no injuries. We were also able to protect our three Space Shuttles, our International Space Station components, and other key hardware.”

During the closure, the KSC Damage Assessment and Recovery Team (DART) completed initial damage assessments. KSC weathered sustained winds greater than 70 mph and gusts as high as 94 mph. A thorough assessment of KSC’s 900 facilities and buildings continues and could take weeks or months to complete.

The Vehicle Assembly Building (VAB), the Thermal Protection System Facility (TPSF) and the Processing Control Center (PCC) received significant damage. The Operations and Checkout Building, Vertical Processing Facility, Hangar AE, Hangar S, and Hangar AF Small Parts Facility received substantial damage.

Original Source: NASA News Release

It’s Cold, But the View is Great

Australian researchers have shown that a ground-based telescope in Antarctica can take images almost as good as those from the Hubble Space Telescope, at a fraction of the cost.

“It represents arguably the most dramatic breakthrough in the potential for ground-based optical astronomy since the invention of the telescope,” says University of New South Wales Associate Professor Michael Ashley, who co-authored the Nature paper. “The discovery means that a telescope at Dome C on the Antarctic plateau could compete with a telescope two to three times larger at the best mid-latitude observatories, with major cost-saving implications. Dome C could become an important ‘test-bed’ for experiments and technologies that will later be flown as space missions. Indeed, for some projects, the site might be an attractive alternative to space based astronomy.”

Astronomical observations made by Australian astronomers at Dome C on the Antarctic Plateau, 3250 m above sea-level, prove that the site has less “star jitter” than the best mid-latitude observatories in Hawaii, Chile and the Canary Islands. While Antarctica has long been recognised as having characteristics that make it a potentially excellent site for astronomy, seeing conditions at the South Pole itself (latitude 90 degrees south) are poor due to atmospheric turbulence within 200 – 300 m of the ground.

By contrast, Dome C, located at latitude 75 degrees south, has several atmospheric and site characteristics that make it ideal for astronomical observations. The site’s atmospheric characteristics include low infrared sky emission, extreme cold and dryness, a high percentage of cloud free time, and low dust and aerosol content – features that confer significant benefits for all forms of astronomy, especially infrared and sub-millimetre.

Dome C is 400 m higher than the South Pole and further inland from the coast. Being a “dome” – a local maximum in the elevation of the terrain – it experiences much lower peak and average wind speeds, which has a profound beneficial effect on the performance of astronomical instruments. Like other regions on the Antarctic plateau, it shares the advantages of a lack of seismic activity and low levels of light pollution.

A key issue in considering where to locate new generation ground-based optical telescopes is to choose a site with excellent ‘seeing’. Seeing is defined as the amount of star jitter or sharpness of astronomical images, which is affected by atmospheric conditions close to Earth.

“The sharpness of the astronomical images at Dome C is two to three times better than at the very best sites currently used by astronomers, including those in Chile, Hawaii and the Canary Islands,” says A/Prof Ashley. “This implies a factor of ten increase in sensitivity. Put another way, an 8 metre infrared telescope on the Antarctic Plateau could achieve the sensitivity limits of a hypothetical 25 metre telescope anywhere else.

“It means there’s now a fantastic opportunity now for Australian astronomers to build world-beating telescopes at the site. I expect the romance and adventure of this combination of astronomy and Antarctica will inspire the next generation of young scientists.”

The observations at Dome C represent a stunning technical achievement, according to the paper’s lead author, Dr Jon S. Lawrence, a University of New South Wales Postdoctoral Fellow.

“We set up a self contained robotic observatory called AASTINO (Automated Astronomical Site Testing International Observatory) at Dome C in January 2004. Powered by two engines, the facility has heat and electrical power that allowed us to communicate with site testing equipment, computers and telescopes via an Iridium satellite network. The entire experiment was controlled remotely — we didn’t turn the telescope on until we returned home,” says Dr Lawrence. “When we left there in February we said goodbye to it knowing all that we could do was communicate with it by the phone and the Internet. If we’d needed to press a reset button on a computer or something, there was no way to do so, and the entire experiment could have failed.

“As it turns out, we’ve made some exceptional findings and published a paper in Nature before even returning to the site. We’re pretty thrilled about it.”

Original Source: UNSW News Release

Comparing Satellite Images of Ivan and Frances

Seen through the eyes of the Multi-angle Imaging SpectroRadiometer aboard NASA’s Terra satellite, the menacing clouds of Hurricanes Frances and Ivan provide a wealth of information that can help improve hurricane forecasts.

The ability of forecasters to predict the intensity and amount of rainfall associated with hurricanes still requires improvement, particularly on the 24- to 48-hour timescales vital for disaster planning. Scientists need to better understand the complex interactions that lead to hurricane intensification and dissipation, and the various physical processes that affect hurricane intensity and rainfall distributions. Because uncertainties in representing hurricane cloud processes still exist, it is vital that model findings be evaluated against actual hurricane observations whenever possible. Two-dimensional maps of cloud heights such as those provided by the Multi-angle Imaging SpectroRadiometer offer an unprecedented opportunity for comparing simulated cloud fields against actual hurricane observations.

The newly released images of Hurricanes Frances and Ivan were acquired Sept. 4 and Sept. 5, 2004, respectively, when Frances’ eye sat just off the coast of eastern Florida and Ivan was heading toward the central and western Caribbean. They are available at: http://photojournal.jpl.nasa.gov/catalog/PIA04367.

The left-hand panel in each image pair is a natural-color view from the instrument’s nadir camera. The right-hand panels are computer-generated cloud-top height retrievals produced by comparing the features of images acquired at different view angles. When these images were acquired, clouds within Frances and Ivan had attained altitudes of 15 and 16 kilometers (9.3 and 9.9 miles) above sea level, respectively.

The instrument is one of several Earth-observing experiments aboard Terra, launched in December 1999. The instrument acquires images of Earth at nine angles simultaneously, using nine separate cameras pointed forward, downward and backward along its flight path. It observes the daylit Earth continuously and every 9 days views the entire globe between 82 degrees north and 82 degrees south latitude. It was built and is managed by NASA’s Jet Propulsion Laboratory, Pasadena, Calif. JPL is a division of the California Institute of Technology in Pasadena.

More information about the Multi-angle Imaging SpectroRadiometer is available at: http://www-misr.jpl.nasa.gov/.

Original Source: NASA/JPL News Release