How Much Material Was Blasted Off By Deep Impact?

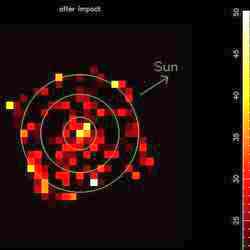
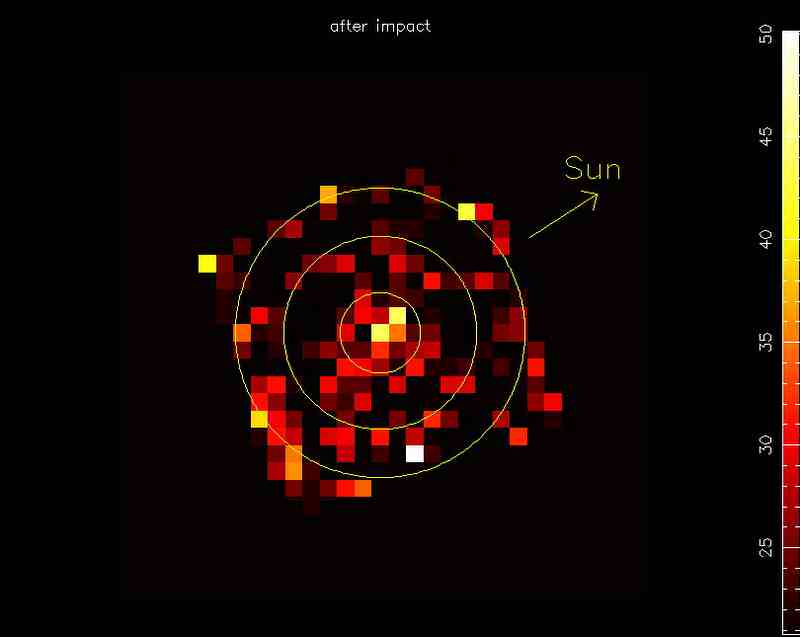
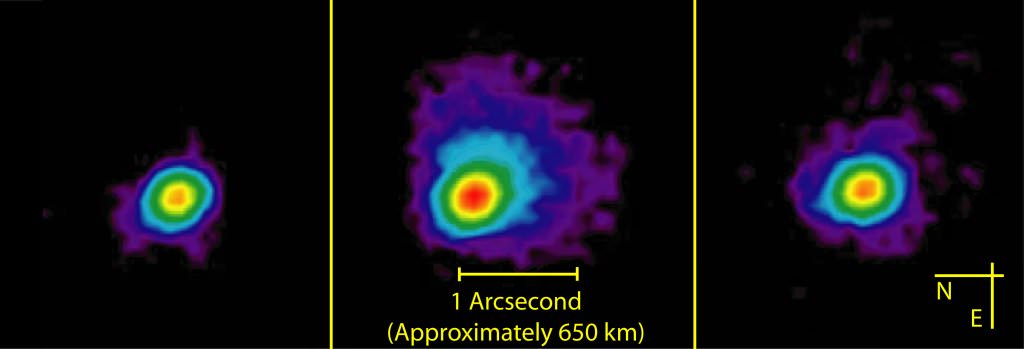
X-ray detections from Tempel 1 after Deep Impact collision. Image credit: Swift. Click to enlarge.
Here come the X-rays, on cue. Scientists studying the Deep Impact collision using NASA’s Swift satellite report that comet Tempel 1 is getting brighter and brighter in X-ray light with each passing day.

The X-rays provide a direct measurement of how much material was kicked up in the impact. This is because the X-rays are created by the newly liberated material lifted into the comet’s thin atmosphere and illuminated by the high-energy solar wind from the Sun. The more material liberated, the more X-rays are produced.

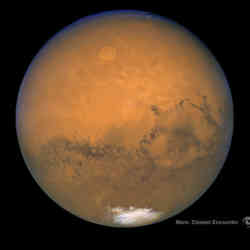
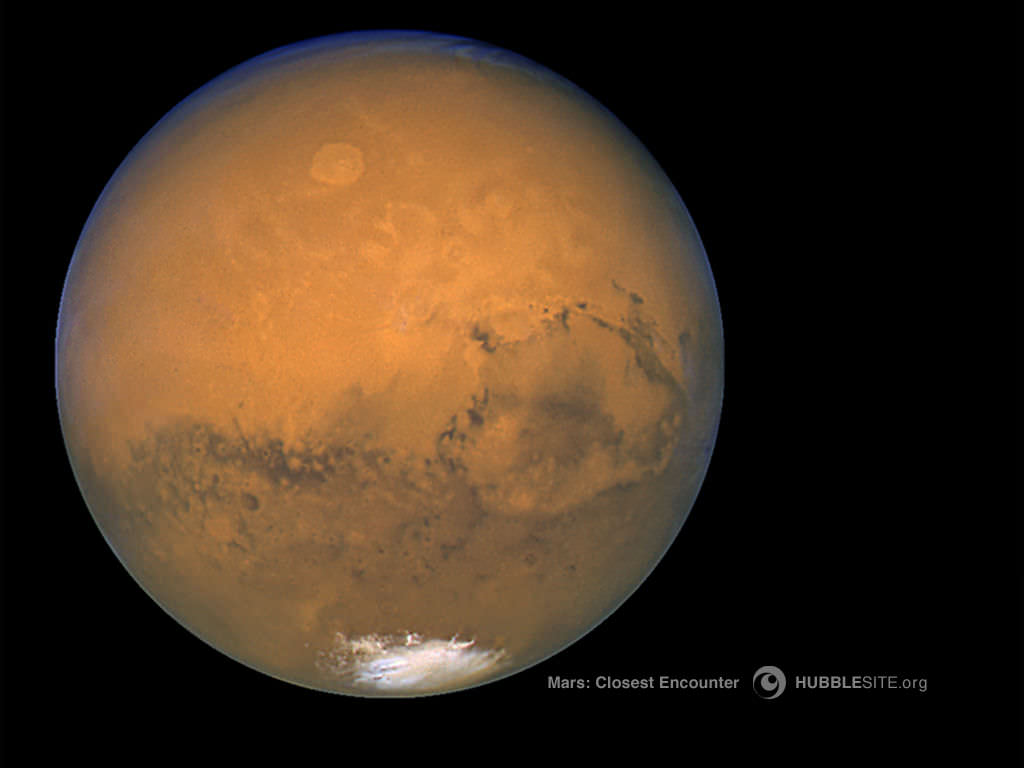
Swift data of the water evaporation on comet Tempel 1 also may provide new insights into how solar wind can strip water from planets such as Mars.

“Prior to its rendezvous with the Deep Impact probe, the comet was a rather dim X-ray source,” said Dr. Paul O’Brien of the Swift team at the University of Leicester. “How things change when you ram a comet with a copper probe traveling over 20,000 miles per hour. Most of the X-ray light we detect now is generated by debris created by the collision. We can get a solid measurement of the amount of material released.”

“It takes several days after an impact for surface and sub-surface material to reach the comet’s upper atmosphere, or coma,” said Dr. Dick Willingale, also of the University of Leicester. “We expect the X-ray production to peak this weekend. Then we will be able to assess how much comet material was released from the impact.”

Based on preliminary X-ray analysis, O’Brien estimates that several tens of thousands of tons of material were released, enough to bury Penn State’s football field under 30 feet of comet dust. Observations and analysis are ongoing at the Swift Mission Operations Center at Penn State University as well as in Italy and the United Kingdom.

Swift is providing the only simultaneous multi-wavelength observation of this rare event, with a suite of instruments capable of detecting visible light, ultraviolet light, X-rays, and gamma rays. Different wavelengths reveal different secrets about the comet.

The Swift team hopes to compare the satellite’s ultraviolet data, collected hours after the collision, with the X-ray data. The ultraviolet light was created by material entering into the lower region of the comet’s atmosphere; the X-rays come from the upper regions. Swift is a nearly ideal observatory for making these comet studies, as it combines both a rapidly responsive scheduling system with both X-ray and optical/UV instruments in the same satellite.

“For the first time, we can see how material liberated from a comet’s surface migrates to the upper reaches of its atmosphere,” said Prof. John Nousek, Director of Mission Operations at Penn State. “This will provide fascinating information about a comet’s atmosphere and how it interacts with the solar wind. This is all virgin territory.”

Nousek said Deep Impact’s collision with comet Tempel 1 is like a controlled laboratory experiment of the type of slow evaporation process from solar wind that took place on Mars. The Earth has a magnetic field that shields us from solar wind, a particle wind composed mostly of protons and electrons moving at nearly light speed. Mars lost its magnetic field billions of years ago, and the solar wind stripped the planet of water.

Comets, like Mars and Venus, have no magnetic fields. Comets become visible largely because ice is evaporated from their surface with each close passage around the Sun. Water is dissociated into its component atoms by the bright sunlight and swept away by the fast-moving and energetic solar wind. Scientists hope to learn about this evaporation process on Tempel 1 now occurring quickly — over the course of a few weeks instead of a billion years — as the result of a planned, human intervention.

Swift’s “day job” is detecting distant, natural explosions called gamma-ray bursts and creating a map of X-ray sources in the universe. Swift’s extraordinary speed and agility enable scientists to follow Tempel 1 day by day to see the full effect from the Deep Impact collision.

The Deep Impact mission is managed by NASA’s Jet Propulsion Laboratory, Pasadena, California. Swift is a medium-class NASA explorer mission in partnership with the Italian Space Agency and the Particle Physics and Astronomy Research Council in the United Kingdom, and is managed by NASA Goddard. Penn State controls science and flight operations from the Mission Operations Center in University Park, Pennsylvania. The spacecraft was built in collaboration with national laboratories, universities and international partners, including Penn State University; Los Alamos National Laboratory, New Mexico; Sonoma State University, Rohnert Park, Calif.; Mullard Space Science Laboratory in Dorking, Surrey, England; the University of Leicester, England; Brera Observatory in Milan; and ASI Science Data Center in Frascati, Italy.

Original Source: PSU News Release

Transit Method Turns Up Planets

Perhaps 1 in 4 stars have planets. Image credit: Hubble. Click to enlarge.
In the past decade, more than 130 extrasolar planets have been discovered to date. Most of these have been found using a technique that measures tiny changes in a star’s radial velocity, the speed of its motion relative to Earth. In a talk at a recent symposium on extrasolar planets, astronomer Alan Boss, of the Carnegie Institution of Washington, presented this overview of the difficult measurements – and the profound discoveries – made by planet-hunters using the radial-velocity technique.

In 1991, Michel Mayor and Antoine Duquennoy published a classic survey of binary stars in our solar neighborhood. They found all the binary companions that they could, but there were another 200 or so G-type stars that didn’t seem to have any binary companions. Subsequently, Michel Mayor, along with Didier Queloz, decided to look at these 200-odd stars, potential solar analogs, to see if they had planetary systems. The technique they used involved looking for stellar wobbles, cyclical changes in the stars’ radial velocity, induced by the gravitational tug of orbiting planets.

In the spring of 1994, they installed a new spectrometer on their telescope at the Haute Provence Observatory, ELODIE, which had a resolution of about 13 meters per second. This was just about the right level to be able to see the velocity wobble, the Doppler wobble, induced in the Sun by a Jupiter-like planet. By the end of 1994 they had noticed a very interesting wobble in a star called 51 Peg.

Unfortunately, 51 Peg at that point was getting closer and closer to the Sun and couldn’t be observed, so they had to take a 6-month sabbatical, and come back in the summer of 1995 and start looking at 51 Peg again. They had an 8-night observing run at the Haute Provence Observatory, and by the end of that observing run, they were ready to go to Nature and publish.

The curve they produced fit a model of 51 Peg, a solar-type star, being orbited by a planet with roughly a half of a Jupiter mass, on a nice, circular orbit. The only problem was that the object had an orbital period of 4.23 days. It was orbiting in at about 0.05 AU, nowhere near where people had been expecting to find Jupiter-mass planets. So it was a bit of a puzzle. But it was clear early on that this had to be a planet, which perhaps had formed farther out and migrated in. That was the only way to explain how it could exist at that location.

The next step was to see if anyone else could reproduce the result. Because, of course, the critical problem with the planet around Barnard’s star was that no one could confirm it. There were several other planet-hunting efforts underway at the time in 1995, but the folks who got to the telescope first were Paul Butler and Geoff Marcy. They were able to confirm 51 Peg’s planet, with even smaller scatter than the original discovery measurements.

We realized at this point that the field of extrasolar planets had truly been born. In October 1995 a new era was entered, where we actually had convincing, solid proof of the existence of extrasolar planets around normal stars.

Now Geoff and Paul had been working in this field for many years. They had actually started seriously around 1987, and so they had a lot of data ready to analyze. They immediately began to reduce all of their data, looking for short period orbits, took some more measurements, and by January of 1996, they were able to announce a couple more planets. One of them, 47 UMa b, was considerably more reassuring a planet than the one discovered orbiting 51 Peg. It was roughly a 2 or 3 Jupiter-mass object orbiting at a distance of 2 or so AU, more like what we were expecting to find based on the planets in our own solar system. We now know that this is a multiple-planet system, but at the time they fit it with a single Keplerian orbit.

Almost all of the known extrasolar planets have been found using this radial-velocity technique; roughly 117 planets have been discovered that way. But there’s another way of finding planets, transit detection. The first transit detection was achieved by David Charboneau and colleagues and separately by Greg Henry and colleagues in 2000. This was a planet which had been found originally by radial velocity, but then these other researchers went on and did both ground-based and later Hubble photometry of the host star and found a really wonderful light curve, indicative of the planet passing in front of the star, dimming its light slightly. The initial detection by Charbonneau’s team was done, believe it or not, using a 4-inch telescope in a parking lot in Boulder, Colorado.

The dip in the star’s light amplitude is about 1.5 percent, so it’s truly amazing that this very first transit detection could have been made by a good amateur telescope. When HST went back and re-did the photometry with much higher precision, it produced an incredibly beautiful light curve, which is so precise you could use it to try to search for moons around the planet and place limits on how large they could be.

So transits are now coming into their own. I think they’re the second leading way of finding planets. Six planets have been discovered by transits now.

Original source: NASA Astrobiology

No, Mars Won’t Look as Big as the Moon

Hubble Space Telescope view of Mars at its closest point 2 years ago. Image credit: Hubble. Click to enlarge.
There’s a rumor going around. You might have heard it at a 4th of July BBQ or family get-together. More likely you’ve read it on the Internet. It goes like this:

“The Red Planet is about to be spectacular.”

“Earth is catching up with Mars [for] the closest approach between the two planets in recorded history.”

“On August 27th ? Mars will look as large as the full moon.”

And finally, “NO ONE ALIVE TODAY WILL EVER SEE THIS AGAIN.”

Those are snippets from a widely-circulated email. Only the first sentence is true. The Red Planet is about to be spectacular. The rest is a hoax.

Here are the facts: Earth and Mars are converging for a close encounter this year on October 30th at 0319 Universal Time. Distance: 69 million kilometers. To the unaided eye, Mars will look like a bright red star, a pinprick of light, certainly not as wide as the full Moon.

Disappointed? Don’t be. If Mars did come close enough to rival the Moon, its gravity would alter Earth’s orbit and raise terrible tides.

Sixty-nine million km is good. At that distance, Mars shines brighter than anything else in the sky except the Sun, the Moon and Venus. The visual magnitude of Mars on Oct. 30, 2005, will be -2.3. Even inattentive sky watchers will notice it, rising at sundown and soaring overhead at midnight.

You might remember another encounter with Mars, about two years ago, on August 27, 2003. That was the closest in recorded history, by a whisker, and millions of people watched as the distance between Mars and Earth shrunk to 56 million km. This October’s encounter, at 69 million km, is similar. To casual observers, Mars will seem about as bright and beautiful in 2005 as it was in 2003.

Although closest approach is still months away, Mars is already conspicuous in the early morning. Before the sun comes up, it’s the brightest object in the eastern sky, really eye-catching. If you have a telescope, even a small one, point it at Mars. You can see the bright icy South Polar Cap and strange dark markings on the planet’s surface.

One day people will walk among those dark markings, exploring and prospecting, possibly mining ice from the polar caps to supply their settlements. It’s a key goal of NASA’s Vision for Space Exploration: to return to the Moon, to visit Mars and to go beyond.

Every day the view improves. Mars is coming–and that’s no hoax.

Original Source: NASA News Release

Shuttle Exhaust Can Make Clouds in Antarctica

Space shuttle Discovery on the launch pad. Image credit: NASA. Click to enlarge.
A new study, funded in part by the Naval Research Laboratory and the National Aeronautics and Space Administration (NASA) reports that exhaust from the space shuttle can create high-altitude clouds over Antarctica mere days following launch, providing valuable insight to global transport processes in the lower thermosphere[mhs1]. The same study also finds that the shuttle’s main engine exhaust plume carries small quantities of iron that can be observed from the ground, half a world away.

The international team of authors of the study, to appear in the July 6 issue of Geophysical Research Letters, used the STS-107 Shuttle mission as a case study to show that exhaust released in the lower thermosphere, near 110 kilometers altitude, can form Antarctic polar mesospheric clouds (PMCs). The thermosphere is the highest layer in our atmosphere, with the mesosphere (between 50-90 kilometers above the Earth), stratosphere, and troposphere below.

New observations presented by the research team from the Global Ultraviolet Imager (GUVI) on NASA’s Thermosphere, Ionosphere, Mesosphere, Energetics and Dynamics (TIMED) satellite reveal transport of the STS-107 exhaust into the southern hemisphere just two days after the January 2003 launch. Water from the exhaust ultimately led to a significant burst of PMCs during the 2002-2003 southern polar summer, observed by the Solar Backscatter Ultraviolet (SBUV) satellite experiment. The inter-hemispheric transport followed by Antarctic PMC formation were unexpected.

PMCs, also known as noctilucent clouds, appear near 83 kilometers altitude and are made up of water ice particles created through microphysical processes of nucleation, condensation, and sedimentation. They typically appear in the frigid polar summer mesosphere where temperatures plummet below 130? Kelvin (-220? F). Little is known about the specific processes that lead to PMC formation.

According to the study’s lead author, Dr. Michael Stevens, a research physicist at the E.O. Hulburt Center for Space Research at the Naval Research Laboratory, the research produced multiple groundbreaking science results.

“This research is exciting in that it extends a new explanation for the formation of these clouds by demonstrating the global effect of a Shuttle exhaust plume in a region of the atmosphere that has traditionally not been well understood,” said Stevens.

Some believe that the impact of anthropogenic change in the lower atmosphere is reflected in these upper atmospheric clouds. Although historically PMCs have only been seen in the polar region, in recent years PMCs have been spotted at lower latitudes as far south as [mhs2]Colorado and Utah, renewing interest and sparking debate on the implications. However, the findings of this work, “call into question the interpretation of the impact of late 20th century PMC trends solely in terms of global climate change,” Stevens said. The team concludes that the water from a space shuttle’s exhaust plume can contribute a remarkable 10-20 percent to PMCs observed during one summer season in Antarctica.

A key piece of data that confirmed the plume’s arrival in Antarctica was the ground-based observation of iron atoms near 110 km. The presence of iron at this altitude originally perplexed scientists because there is no known natural source there. The data imply that iron ablated, or vaporized, by the main engines of the Shuttle was transported along with the water plume, arriving in Antarctica three to four days after the January 2003 launch. Both the water plume and the presence of iron demonstrate that the mean southward wind inferred from the team’s data is much faster than gleaned from global circulation models or wind climatologies.

“This tells us something new and exciting about transport in this region of the atmosphere,” said Stevens. “It can be so fast that a shuttle plume can form ice over Antarctica before other loss processes can really take effect. We must take great care in interpreting the long-term implications to observations and features of these clouds because of this contribution from the shuttle and the potential contribution from many other smaller launch vehicles.”

NRL and NASA funded the study, with contributions from the National Science Foundation, the British Antarctic Survey in Cambridge, United Kingdom, and the University of Illinois, Urbana-Champaign. Other researchers on the study include Robert Meier of George Mason University, Fairfax, Va.; Xinzhao Chu of the University of Illinois, Urbana-Champaign; Matthew DeLand of Science Systems & Applications, Inc., Lanham, Md.; and John Plane of the University of East Anglia, Norwich, United Kingdom.

Original Source: NRL News Release

Microquasar Puzzles Astronomers

Computer illustration of microquasar LS5039. Image credit: PPARC. Click to enlarge.
In a recent issue of Science Magazine, the High Energy Stereoscopic System (H.E.S.S.) team of international astrophysicists reports the discovery of another new type of very high energy (VHE) gamma ray source.

Gamma-rays are produced in extreme cosmic particle accelerators such as supernova explosions and provide a unique view of the high energy processes at work in the Milky Way. VHE gamma-ray astronomy is still a young field and H.E.S.S. is conducting the first sensitive survey at this energy range, finding previously unknown sources.

The object that is producing the high energy radiation is thought to be a ‘microquasar’. These objects consist of two stars in orbit around each other. One star is an ordinary star, but the other has used up all its nuclear fuel, leaving behind a compact corpse. Depending on the mass of the star that produced it, this compact object is either a neutron star or a black hole, but either way its strong gravitational pull draws in matter from its companion star. This matter spirals down towards the neutron star or the black hole, in a similar way to water spiraling down a plughole.

However, sometimes the compact object receives more matter than it can cope with. The material is then squirted away from the system in a jet of matter moving at speeds close to that of light, resulting in a microquasar. Only a few such objects are known to exist in our galaxy and one of them, an object called LS5039, has now been detected by the H.E.S.S. team.

In fact, the real nature LS5039 is something of a mystery. It is not clear what the compact object is. Some of the characteristics suggest it is a neutron star, some that it is a black hole. Not only that, but the jet isn’t much of a jet; although it is moving at about 20% of the speed of light, which might seem a lot, in the context of these objects it’s actually quite slow.

Nor is it clear how the gamma rays are being produced. As Dr. Guillaume Dubus of the Ecole Polytechnique points out “We really shouldn’t have detected this object. Very high energy gamma rays emitted close to the companion star are more likely to be absorbed, creating a matter/antimatter cascade, than escape from the system.”

Dr Paula Chadwick of the University of Durham adds “It’s very exciting to have added another class of object to the growing catalogue of gamma ray sources. It’s an intriguing object – it will take more observations to work out what is going on in there.”

The H.E.S.S. array is ideal for finding new VHE gamma ray objects; because it’s wide field of view (ten times the diameter of the Moon) means that it can survey the sky and discover previously unknown sources.

The results were obtained using the High Energy Stereoscopic System (H.E.S.S.) telescopes in Namibia, in South-West Africa. This system of four 13 m diameter telescopes is currently the most sensitive detector of VHE gamma-rays – radiation that is a million, million times more energetic than the visible light. These high energy gamma rays are quite rare even for relatively strong sources; only about one gamma ray per month hits a square metre at the top of the Earth’s atmosphere. Also, since they are absorbed in the atmosphere, a direct detection of a significant number of the rare gamma rays would require a satellite of huge size. The H.E.S.S. telescopes employ a trick – they use the atmosphere as detector medium. When gamma rays are absorbed in the air, they emit short flashes of blue light, named Cherenkov light, lasting a few billionths of a second. This light is collected by the H.E.S.S. telescopes with large mirrors and extremely sensitive cameras and can be used to create images of astronomical objects as they appear in gamma-rays.

The H.E.S.S. telescopes represent several years of construction effort by an international team of more than 100 scientists and engineers from Germany, France, the UK, Ireland, the Czech Republic, Armenia, South Africa and the host country Namibia. The instrument was inaugurated in September 2004 by the Namibian Prime Minister, Theo-Ben Guirab, and its first data have already resulted in a number of important discoveries, including the first astronomical image of a supernova shock wave at the highest gamma-ray energies.

Original Source: PPARC News Release

Seas are Rising Faster than Ever

Artist illustration of NASA satellite measuring sea levels. Image credit: NASA/JPL. Click to enlarge.
For the first time, NASA has the tools and expertise to understand the rate at which sea level is changing, some of the mechanisms that drive those changes and the effects that sea level change may have worldwide.

“It’s estimated that more than 100 million lives are potentially impacted by a one-meter (3.3-foot) increase in sea level,” said Dr. Waleed Abdalati, head of the Cryospheric Sciences Branch at NASA’s Goddard Space Flight Center, Greenbelt, Md. “When you consider this information, the importance of learning how and why these changes are occurring becomes clear,” he added.

Although scientists have directly measured sea level since the early part of the 20th century, it was not known how many of the observed changes in sea level were real and how many were related to upward or downward movement of the land. Now satellites have changed that by providing a reference by which changes in ocean height can be determined regardless of what the nearby land is doing. With new satellite measurements, scientists are able to better predict the rate at which sea level is rising and the cause of that rise.

“In the last 50 years sea level has risen at an estimated rate of .18 centimeters (.07 inches) per year, but in the last 12 years that rate appears to be .3 centimeters (.12 inches) per year. Roughly half of that is attributed to the expansion of ocean water as it has increased in temperature, with the rest coming from other sources,” said Dr. Steve Nerem, associate professor, Colorado Center for Astrodynamics Research, University of Colorado, Boulder.

Another source of sea level rise is the increase in ice melting. Evidence shows that sea levels rise and fall as ice on land grows and shrinks. With the new measurements now available, it’s possible to determine the rate at which ice is growing and shrinking.

“We’ve found the largest likely factor for sea level rise is changes in the amount of ice that covers the Earth. Three-fourths of the planet’s freshwater is stored in glaciers and ice sheets or the equivalent of about 67 meters (220 feet) of sea level,” said Dr. Eric Rignot, principal scientist for the Radar Science and Engineering Section at NASA’s Jet Propulsion Laboratory, Pasadena, Calif. “Ice cover is shrinking much faster than we thought, with over half of recent sea level rise due to the melting of ice from Greenland, West Antarctica’s Amundsen Sea and mountain glaciers,” he said.

Additionally, NASA scientists and partner researchers now are able to measure and monitor the world’s waters globally in a sustained and comprehensive way using a combination of satellite observations and sensors in the ocean. By integrating the newly available satellite and surface data, scientists are better able to determine the causes and significance of current sea level changes.

“Now the challenge is to develop an even deeper understanding of what is responsible for sea level rise and to monitor for possible future changes. That’s where NASA’s satellites come in, with global coverage and ability to examine the many factors involved,” said Dr. Laury Miller, chief of the National Oceanic and Atmospheric Administration Laboratory for Satellite Altimetry, Washington, D.C.

NASA works with agency partners such as the National Oceanic and Atmospheric Administration and the National Science Foundation to explore and understand sea level change. Critical resources that NASA brings to bear on this issue include such satellites as:

— Topex/Poseidon and Jason, the U.S. portions of which are managed by JPL, which use radar to map the precise features of the oceans’ surface, measuring ocean height and monitoring ocean circulation;

— Ice, Cloud and Land Elevation Satellite (IceSat), which studies the mass of polar ice sheets and their contributions to global sea level change;

— Gravity Recovery And Climate Experiment (Grace), also managed by JPL, which maps Earth’s gravitational field, allowing us to better understand movement of water throughout the Earth.

Original Source: NASA News Release

STS-114 Countdown Begins July 10

Space shuttle Discovery moving from the Vehicle Assembly building. Image credit: NASA. Click to enlarge.
NASA will begin the countdown for the Return to Flight launch of Space Shuttle Discovery on mission STS-114 July 10 at 6 p.m. EDT, 43 hours before liftoff. Discovery’s seven-member crew will test new equipment and procedures to increase the safety of the Shuttle and deliver spare parts, water and supplies to the International Space Station.

The Kennedy Space Center (KSC) launch team will conduct the countdown from Firing Room 3 of the Launch Control Center. The countdown includes nearly 27 hours of built-in hold time leading to a preferred launch time at about 3:51 p.m. on July 13 with a launch window extending about five minutes.

This historic mission is the 114th Space Shuttle flight and the 17th U.S. flight to the International Space Station. STS-114 is scheduled to last about 12 days with a planned KSC landing at about 11:01 a.m. EDT on July 25.

Discovery rolled into KSC’s Orbiter Processing Facility (OPF) on Aug. 22, 2001, after returning from its last mission STS-105 in August 2001 and undergoing an Orbiter Major Modification period. The Shuttle rolled out of OPF bay 3 and into the Vehicle Assembly Building (VAB) on March 29. While in VAB high bay 1, Discovery was mated to its redesigned External Tank and Solid Rocket Boosters. The entire Space Shuttle stack was transferred to Launch Pad 39B on April 7.

In order to allow for the addition of a new heater to the External Tank, Space Shuttle Discovery was rolled back to the VAB on May 26 for that modification to be performed. Discovery was removed from its External Tank and attached to a new tank originally scheduled to fly with orbiter Atlantis on mission STS-121, the second Return to Flight mission.

Discovery was rolled back out to Launch Pad 39B on June 15 in preparation for the July launch window.

On mission STS-114, the crew will perform inspections on orbit for the first time of all of the Reinforced Carbon-Carbon (RCC) panels on the leading edge of the wings and the Thermal Protection System tiles using the new Canadian-built Orbiter Boom Sensor System and the data from 176 impact and temperature sensors. Mission Specialists will also practice repair techniques on RCC and tile samples during a spacewalk in the payload bay.

In the payload bay, the Multi-Purpose Logistic Module Raffaello, built by the Italian Space Agency, will carry 11 racks with supplies, hardware, equipment and the Human Research Facility-2.

During two additional spacewalks, the crew will install the External Stowage Platform-2, equipped with spare part assemblies, and a replacement Control Moment Gyroscope contained in the Lightweight Multi-Purpose Experiment Support Structure.

The STS-114 crew includes Commander Eileen Collins, Pilot James Kelly, and Mission Specialists Soichi Noguchi, Stephen Robinson, Andrew Thomas, Wendy Lawrence and Charles Camarda.

Original Source:NASA News Release

Extremely Large Telescope Takes the Next Step

Astronomers from across Europe today (July 7th) took a step closer to making their plans for a giant telescope a reality when they unveiled the scientific case for an Extremely Large Telescope (ELT) – a monster telescope with a light capturing mirror of between 50 and 100 metres, dwarfing all previous optical telescope facilities. The announcement was made at a meeting in Dwingeloo, the Netherlands and initiates the design phase of the project. Astronomers plan to use the ELT to search for planets like the Earth in other star systems and to find out when the first stars in the Universe began to shine.

The first step when selecting the specifications and design options for a new telescope is for astronomers to establish the science that could be achieved with the facility. The science case launched today will be used in a Design Study funded by the European Union’s Framework 6 Programme and a Europe-wide consortium of partners, including industry, aimed at evaluating critical technologies needed to build a giant telescope, and led by the European Southern Observatory (ESO). The UK part of this ?30M programme is led by the UK Astronomy Technology Centre (UK ATC) and partly funded by the Particle Physics and Astronomy Research Council (PPARC).

Roberto Gilmozzi, ESO’s coordinator of the ELT Design Study said, “The ELT Design Study initiative, a 31 MEuro activity partially funded by the FP6, shows the willingness of Europe to pursue a common path towards the eventual construction of an ELT. It is a design independent study of enabling technologies that brings together European institutes and industry to define a palette of ELT “building blocks” that indicate the way in which the telescope design should evolve to take advantage of the directions industry believes are most appropriate and cost effective.”

Bigger is better

The power of optical telescopes is limited by the size of the mirror that is used to collect light, which in turn determines how well they can distinguish between faint objects – the bigger the mirror, the fainter the object that the telescope will be able to see. For example, a 100m telescope with perfect compensation for atmospheric disturbances would be able to separate two points on the moon two metres apart, compared with 95m apart for the Hubble Space Telescope.

The quest for bigger mirrors has pushed current technologies to their limits. Some of the most advanced 8-10 metre telescopes now rely on mirrors constructed from smaller mirror segments, controlled by computers to act as a single large surface. These new techniques offer astronomers the opportunity for an unprecedented step-up in size. A 100m telescope would use a greater area of precision mirrors than has been made for all the previous telescopes ever built!

Dr Isobel Hook from the University of Oxford has led the working group producing the science case. She says “An Extremely Large Telescope is a very exciting prospect for astronomers. Something with a 50 or even 100 metre mirror could completely change our understanding of the Universe and answer truly fundamental questions such as ‘Is the Earth unique?’ and ‘How did the first stars and galaxies form?’. We will have much more information than ever before – it will be a bit like being there when the first telescopes were pointed at the sky.”

The next step

The European ELT Design Study is a five year project to explore the challenges of building an ELT, with most of the work being done in the initial three years. Every aspect of the ELT project will be examined, from site selection to instrumentation. It is due to report in 2008 at which time it will present a range of options to funding agencies.

The design study will provide the crucial technical information needed to make tough decisions at the next stage. This will involve balancing the size and design of the telescope against cost and time of first operation. Building work is likely to start in the next decade and the telescope could start scientific operations from 2015!

Professor Gerry Gilmore of the Institute of Astronomy Cambridge and Chair of the EU OPTICON network, said “Development of the ELT science case has involved over 100 European astronomers, and 3 years of work. All this happened because the astronomers want it: an ELT is overwhelmingly the scientifically favoured next major astronomy development, with widespread and strong community support. Turning this bottom-up support into a science case and a design study proposal needed some resources, and a trans-national support structure, both naturally available and provided by the EC-funded OPTICON infrastructure network. This proves that European astronomers are becoming a single community, and as such are now international leaders in astronomy.”

PPARC, the UK funding agency for astronomy, has earmarked ?2million for research and development of an ELT for the period to April 2008. ?500,000 of this is to support the design study concentrating on UK strengths in instrumentation and adaptive optics led by the UK ATC, in partnership with Durham and Oxford Universities. The remainder of the programme is under evaluation, but will concentrate on key technologies such as lightweight and adaptive mirrors to enable the science goals to be met at an affordable cost.

Colin Cunningham, Director of Technology Development at the UK ATC says “A telescope of 50 to 100m in diameter will have outstanding sensitivity and resolution -but to reach this performance at an affordable cost requires us to address many engineering and technology challenges. The UK will be at the heart of these efforts through its part in the EU-supported ELT Design Study and our UK R&D programme which will bring together academic and industrial partners in preparation for the design and construction phase of this exciting project.”

Original Source: PPARC News Release

Gemini Sees Rocky Material on Tempel 1

False colour image of Tempel 1 taken by Gemini North. Image credit: Gemini. Click to enlarge.
The Gemini North telescope on Mauna Kea successfully captured the dramatic fireworks display produced by the collision of NASA’s Deep Impact probe with Comet 9P/Tempel 1. Researchers in two control rooms on Hawaii?s Big Island (on Mauna Kea and in Hilo) were able to keep enough composure amid an almost giddy excitement to perform a preliminary analysis of the data. They concluded from the mid-infrared spectroscopic observations that there was strong evidence for silicates or rocky material exposed by the impact. Little doubt remains that the unprecedented quality of the Gemini data will keep astronomers busy for years.

?The properties of the mid-infrared light were completely transformed after impact,? said David Harker of the University of San Diego, co-investigator for the research team. ?In addition to brightening by a factor of about 4, the characteristics of the mid-infrared light was like a chameleon and within five minutes of the collision it looked like an entirely new object.? Harker?s research partner Chick Woodward of the University of Minnesota speculated further, ?We are possibly seeing crystalline silicates which might even be similar to the beach sand here in Hawaii! This data will keep us busy trying to figure out the size and composition of these grains to better understand the similarities and differences between the material contained within comets and other bodies in the solar system.?

In addition to the spectroscopic observations, before-and-after images were also obtained by the Gemini telescope in thermal infrared light and can be seen in Figure 1. Gemini monitored the comet for several weeks prior to the impact and will continue to watch it through the end of July.

The Gemini observations were part of a coordinated effort between the W.M. Keck, Subaru and Gemini Observatories so that each could concentrate on different observations and provide a complete, complementary ?picture? of the impact. Astronomers anticipate that the data gathered from the largest and most sophisticated set of telescopes positioned to see the impact will add considerably to our understanding of comets as dynamic probes of our solar system?s early evolution some 4.5-5 billion years ago.

The Gemini observations were made using Michelle, the facility mid-infrared imager/spectrograph built at the Royal Observatory of Edinburgh (ROE) in the UK. The instrument has unique capabilities in the mid-infrared especially at Gemini which uses protected silver coatings on main mirrors to provide exceptional performance in the ?thermal? or mid-infrared part of the spectrum.

Original Source: Gemini Observatory News Release