Predicting Times for Clear Space Weather

Biggest solar flare recorded by SOHO. Image credit: SOHO Click to enlarge
Scientists funded by NASA have made big strides in learning how to forecast “all clear” periods, when severe space weather is unlikely. The forecasts are important because radiation from particles from the sun associated with large solar flares can be hazardous to unprotected astronauts, airplane occupants and satellites.

“We have a much better insight into what causes the strongest, most dangerous solar flares, and how to develop forecasts that can predict an ‘all clear’ for significant space weather, for longer periods,” said Dr. Karel Schrijver of the Lockheed Martin Advanced Technology Center (ATC), Palo Alto, Calif. He is lead author of a paper about the research published in the Astrophysical Journal.

Solar flares are violent explosions in the atmosphere of the sun caused by the sudden release of magnetic energy. Like a rubber band twisted too tightly, stressed magnetic fields in the sun?s atmosphere (corona) can suddenly snap to a new shape. They can release as much energy as one, 10 billion megaton nuclear bomb.

Predicting space weather is a complicated problem. Solar forecasters focus principally on the complexity of solar magnetic field patterns to predict solar storms. This method is not always reliable, because solar storms require additional ingredients to occur. It has long been known large electrical currents must be present to power flares.

Insight into the causes of the largest solar flares came in two steps. “First, we discovered characteristic patterns of magnetic field evolution associated with strong electrical currents in the solar atmosphere,” said ATC’s Dr. Marc DeRosa, co-author of the paper. “It is these strong electrical currents that drive solar flares.”

Subsequently, the authors discovered the regions most likely to flare had new magnetic fields merge into them that were clearly out of alignment with the existing field. This emerging field from the solar interior appears to induce even more current as it interacts with the existing field.

The team also found flares do not necessarily occur immediately upon the emergence of a new magnetic field. Apparently the electrical currents must build up over several hours before the fireworks start. Predicting exactly when a flare will happen is like studying avalanches. They occur only after enough snow built up. Once the threshold is reached, the avalanche can happen anytime by processes not yet completely understood.

“We found the current-carrying regions flare two to three times more often than the regions without large currents,” Schrijver said. “Also, the average flare magnitude is three times greater for the group of active regions with large current systems than for the other group.”

The researchers made the discovery by comparing data about magnetic fields on the sun?s surface to the sharpest extreme-ultraviolet images of the solar corona. The magnetic maps were from the Michelson Doppler Imager (MDI) instrument on board Solar and Heliospheric Observatory (SOHO) spacecraft. SOHO is operated under a cooperative mission between the European Space Agency and NASA.

The corona images were from the NASA Transition Region and Coronal Explorer spacecraft (TRACE). The team also used computer models of a three-dimensional solar magnetic field without electrical currents based on SOHO images. Differences between images and models indicated the presence of large electrical currents.

“This is a result that is more than the sum of two individual missions,” said Dr. Dick Fisher, Director of NASA’s Sun-Solar System Connection Division. “It’s not only interesting scientifically, but has broad implications for society.”

For imagery about the research on the Web, visit: NASA News Release

Rhea’s Southern Pole

Southern polar region of Rhea. Image credit: NASA/JPL/SSI Click to enlarge
Like the rest of Rhea’s surface, the southern polar region of this Saturn moon has been extensively re-worked by cratering over the eons. This close-up shows that most sizeable craters have smaller, younger impact sites within them. Near the left lies an intriguing gash.
The largest well-defined crater visible here is an oval-shaped impact toward the upper right. The crater is 115 by 91 kilometers (71 by 57 miles) in size.

Cassini acquired this view during a distant flyby of Rhea (1,528 kilometers, or 949 miles across) on July 14, 2005.

The image was taken in visible light with the Cassini spacecraft narrow-angle camera at a distance of approximately 239,000 kilometers (149,000 miles) from Rhea and at a Sun-Rhea-spacecraft, or phase, angle of 56 degrees. The image was obtained using a filter sensitive to wavelengths of infrared light centered at 930 nanometers. The image scale is about 1 kilometer (0.6 miles) per pixel.

The Cassini-Huygens mission is a cooperative project of NASA, the European Space Agency and the Italian Space Agency. The Jet Propulsion Laboratory, a division of the California Institute of Technology in Pasadena, manages the mission for NASA’s Science Mission Directorate, Washington, D.C. The Cassini orbiter and its two onboard cameras were designed, developed and assembled at JPL. The imaging operations center is based at the Space Science Institute in Boulder, Colo.

For more information about the Cassini-Huygens mission visit http://saturn.jpl.nasa.gov . The Cassini imaging team homepage is at http://ciclops.org .

Original Source: NASA/JPL/SSI News Release

Sea Ice May Be Increasing in the Antarctic

Antarctic Snow Depth on Sea Ice. Image credit: NASA Click to enlarge
A new NASA-funded study finds that predicted increases in precipitation due to warmer air temperatures from greenhouse gas emissions may actually increase sea ice volume in the Antarctic?s Southern Ocean. This adds new evidence of potential asymmetry between the two poles, and may be an indication that climate change processes may have different impact on different areas of the globe.

“Most people have heard of climate change and how rising air temperatures are melting glaciers and sea ice in the Arctic,” said Dylan C. Powell, co-author of the paper and a doctoral candidate at the University of Maryland-Baltimore County. “However, findings from our simulations suggest a counterintuitive phenomenon. Some of the melt in the Arctic may be offset by increases in sea ice volume in the Antarctic.”

The researchers used satellite observations for the first time, specifically from the Special Sensor Microwave/Imager, to assess snow depth on sea ice, and included the satellite observations in their model. As a result, they improved prediction of precipitation rates. By incorporating satellite observations into this new method, the researchers achieved more stable and realistic precipitation data than the typically variable data found in the polar regions. The paper was published in the June issue of the American Geophysical Union’s Journal of Geophysical Research.

“On any given day, sea ice cover in the oceans of the polar regions is about the size of the U.S.,” said Thorsten Markus, co-author of the paper and a research scientist at NASA?s Goddard Space Flight Center, Greenbelt, Md. “Far-flung locations like the Arctic and Antarctic actually impact our temperature and climate where we live and work on a daily basis.”

According to Markus, the impact of the northernmost and southernmost parts on Earth on climate in other parts of the globe can be explained by thermal haline (or saline) circulation. Through this process, ocean circulation acts like a heat pump and determines our climate to a great extent. The deep and bottom water masses of the oceans make contact with the atmosphere only at high latitudes near or at the poles. In the polar regions, the water cools down and releases its salt upon freezing, a process that also makes the water heavier. The cooler, salty, water then sinks down and cycles back towards the equator. The water is then replaced by warmer water from low and moderate latitudes, and the process then begins again.

Typically, warming of the climate leads to increased melting rates of sea ice cover and increased precipitation rates. However, in the Southern Ocean, with increased precipitation rates and deeper snow, the additional load of snow becomes so heavy that it pushes the Antarctic sea ice below sea level. This results in even more and even thicker sea ice when the snow refreezes as more ice. Therefore, the paper indicates that some climate processes, like warmer air temperatures increasing the amount of sea ice, may go against what we would normally believe would occur.

“We used computer-generated simulations to get this research result. I hope that in the future we?ll be able to verify this result with real data through a long-term ice thickness measurement campaign,” said Powell. “Our goal as scientists is to collect hard data to verify what the computer model is telling us. It will be critical to know for certain whether average sea ice thickness is indeed increasing in the Antarctic as our model indicates, and to determine what environmental factors are spurring this apparent phenomenon.”

Achim Stossel of the Department of Oceanography at Texas A&M University, College Station, Tex., a third co-author on this paper, advises that “while numerical models have improved considerably over the last two decades, seemingly minor processes like the snow-to-ice conversion still need to be better incorporated in models as they can have a significant impact on the results and therefore on climate predictions.”

Original Source: NASA News Release

New Look for the Milky Way

Artist’s impression of the Milky Way. Image credit: NASA/JPL-Caltech/R Click to enlarge
With the help of NASA’s Spitzer Space Telescope, astronomers have conducted the most comprehensive structural analysis of our galaxy and have found tantalizing new evidence that the Milky Way is much different from your ordinary spiral galaxy.

The survey using the orbiting infrared telescope provides the fine details of a long central bar feature that distinguishes the Milky Way from more pedestrian spiral galaxies.

“This is the best evidence ever for this long central bar in our galaxy,” says Ed Churchwell, a UW-Madison professor of astronomy and a senior author of a paper describing the new work in an upcoming edition of Astrophysical Journal Letters, a leading astronomy journal.

Using the orbiting infrared telescope, the group of astronomers surveyed some 30 million stars in the plane of the galaxy in an effort to build a detailed portrait of the inner regions of the Milky Way. The task, according to Churchwell, is like trying to describe the boundaries of a forest from a vantage point deep within the woods: “This is hard to do from within the galaxy.”

Spitzer’s capabilities, however, helped the astronomers cut through obscuring clouds of interstellar dust to gather infrared starlight from tens of millions of stars at the center of the galaxy. The new survey gives the most detailed picture to date of the inner regions of the Milky Way.

“We’re observing at wavelengths where the galaxy is more transparent, and we’re bringing tens of millions of objects into the equation,” says Robert Benjamin, the lead author of the new study and a professor of physics at the University of Wisconsin-Whitewater.

The possibility that the Milky Way Galaxy has a long stellar bar through its center has long been considered by astronomers, and such phenomena are not unheard of in galactic taxonomy. They are clearly evident in other galaxies, and it is a structural characteristic that adds definition beyond the swirling arms of typical spiral galaxies.

The new study provides the best estimates for the size and orientation of the bar, which are far different from previous estimates.

It shows a bar, consisting of relatively old and red stars, spanning the center of the galaxy roughly 27,000 light years in length – 7,000 light years longer than previously believed. It also shows that the bar is oriented at about a 45-degree angle relative to a line joining the sun and the center of the galaxy.

Previously, astronomers debated whether a presumed central feature of the galaxy would be a bar structure or a central ellipse – or both. The new research, the Wisconsin astronomers say, clearly shows a bar-like structure.

“To date, this is the best evidence for a long bar in our galaxy,” Benjamin asserts. “It’s hard to argue with this data.”

The Spitzer Space Telescope was lofted into orbit in August of 2003. It consists of a telescope and three science instruments, including the Infrared Array Camera, the primary instrument used for the new survey, known as GLIMPSE for Galactic Legacy Mid-Plane Survey Extraordinaire.

NASA’s Jet Propulsion Laboratory (JPL), Pasadena, Calif., manages the Spitzer Space Telescope mission for NASA’s Science Mission Directorate, Washington, D.C. Science operations are conducted at the Spitzer Science Center in Pasadena. JPL is a division of the California Institute of Technology.

Original Source: UW-Madison News Release

Xanadu on Titan

Saturn’s largest moon Titan. Image credit: NASA/JPL/SSI Click to enlarge
Titan’s equatorial latitudes are distinctly different in character from its south polar region, as this image shows.
The dark terrain, presumably lowland, seen here does not extend much farther south than about 30 degrees South. The successful Huygens probe landed in such a region. The Huygens probe is rotating into the light here, seeing the dawn of a new day.

The bright region toward the right side of Titan’s disk is Xanadu. This area is thought to consist of upland terrain that is relatively uncontaminated by the dark material that fills the lowland regions.

Near the moon’s south pole, and just eastward of the terminator, is the dark feature identified by imaging scientists as the best candidate (so far) for a past or present hydrocarbon lake on Titan (see Clouds in the Distance). Farther east of the lake-like feature, bright clouds arc around the pole. These clouds occupy a latitude range that is consistent with previously-seen convective cloud activity on Titan.

Titan is Saturn’s largest moon, at 5,150 kilometers (3,200 miles) across.

The image was taken with the Cassini spacecraft narrow angle camera on July 7, 2005, at a distance of approximately 1.3 million kilometers (800,000 miles) from Titan and at a Sun-Titan-spacecraft, or phase, angle of 60 degrees. The image was obtained using a filter sensitive to wavelengths of infrared light centered at 938 nanometers. The image scale is 7 kilometers (5 miles) per pixel.

The Cassini-Huygens mission is a cooperative project of NASA, the European Space Agency and the Italian Space Agency. The Jet Propulsion Laboratory, a division of the California Institute of Technology in Pasadena, manages the mission for NASA’s Science Mission Directorate, Washington, D.C. The Cassini orbiter and its two onboard cameras were designed, developed and assembled at JPL. The imaging operations center is based at the Space Science Institute in Boulder, Colo.

For more information about the Cassini-Huygens mission visit http://saturn.jpl.nasa.gov . The Cassini imaging team homepage is at http://ciclops.org .

Original Source: NASA/JPL/SSI News Release

Mineral Mapper Traveling to Mars

CRISM. Image credit: NASA Click to enlarge
With today?s launch of NASA?s Mars Reconnaissance Orbiter spacecraft from Cape Canaveral Air Force Station, Fla., the Compact Reconnaissance Imaging Spectrometer for Mars ? or CRISM ? joins the set of high-tech detectives seeking traces of water on the red planet.

Built by the Johns Hopkins University Applied Physics Laboratory (APL) in Laurel, Md., CRISM is the first visible-infrared spectrometer to fly on a NASA Mars mission. Its primary job: look for the residue of minerals that form in the presence of water, the ?fingerprints? left by evaporated hot springs, thermal vents, lakes or ponds on Mars when water could have existed on the surface.

With unprecedented clarity, CRISM will map areas on the martian surface down to house-sized scales ? as small as 60 feet (about 18 meters) across ? when the spacecraft is in its average orbit altitude of about 190 miles (more than 300 kilometers).

?CRISM plays a very important role in Mars exploration,? says APL?s Dr. Scott Murchie, the instrument?s principal investigator. ?Our data will identify sites most likely to have contained water, and which would make the best potential landing sites for future missions seeking fossils or even traces of life on Mars.?

Though certain landforms provide evidence that water may once have flowed on Mars, Murchie says scientists have little evidence of sites containing mineral deposits created by long-term interaction between water and rock. The NASA Rover Opportunity found evidence for liquid water in Meridian Planum ? a large plain near Mars? equator ? but that is only one of many hundreds of sites where future spacecraft could land.

Peering through a telescope with a 4-inch (10-centimeter) aperture, and with a greater capability to map spectral variations than any similar instrument sent to another planet, CRISM will read 544 ?colors? in reflected sunlight to detect minerals in the surface. Its highest resolution is about 20 times sharper than any previous look at Mars in infrared wavelengths.

?At infrared wavelengths, rocks that look absolutely the same to human eyes become very different,? Murchie says. ?CRISM has the capability to take images in which different rocks will ?light up? in different colors.?

CRISM is mounted on a gimbal, allowing it to follow targets on the surface as the orbiter passes overhead. CRISM will spend the first half of a two-year orbit mission mapping Mars at 650-foot (200-meter) scales, searching for potential study areas. Several thousand promising sites will then be measured in detail at CRISM?s highest spatial and spectral resolution. CRISM will also monitor seasonal variations in dust and ice particles in the atmosphere, supplementing data gathered by the orbiter?s other instruments and providing new clues about the Martian climate.

?CRISM will improve significantly on the mapping technology currently orbiting Mars,? says CRISM Project Manager Peter Bedini, of APL. ?We?ll not only look for future landing sites, but we?ll be able to provide details on information the Mars Exploration Rovers are gathering now. There is a lot more to learn, and after CRISM and the Mars Reconnaissance Orbiter there will still be more to learn. But with this mission we?re taking a big step in exploring and understanding Mars.?

As the Mars Reconnaissance Orbiter cruises to its destination, the CRISM operations team continues to fine-tune the software and systems it will use to command the instrument and receive, read, process, and store a wealth of data from orbit ? more than 10 terabytes when processed back on Earth, enough to fill more than 15,000 compact discs. The spacecraft is set to reach Mars next March, use aerobraking to circularize its orbit, and settle into its science orbit by November 2006.

APL, which has built more than 150 spacecraft instruments over the past four decades, led the effort to develop, integrate and test CRISM. CRISM?s co-investigators are top planetary scientists from Brown University, the Jet Propulsion Laboratory, Northwestern University, Space Science Institute, Washington University in St. Louis, University of Paris, the Applied Coherent Technology Corporation, and NASA?s Goddard Space Flight Center, Ames Research Center and Johnson Space Center.

The Jet Propulsion Laboratory, a division of the California Institute of Technology, Pasadena, manages the Mars Reconnaissance Orbiter mission for NASA’s Science Mission Directorate.

For more information on CRISM and the Mars Reconnaissance Orbiter, including instrument images, visit: http://crism.jhuapl.edu

Original Source: APL News Release

What’s Up This Week – August 15 – August 21, 2005

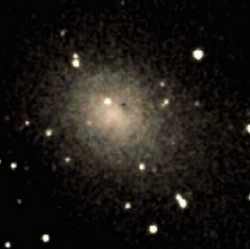
Credit: Randy Brewer
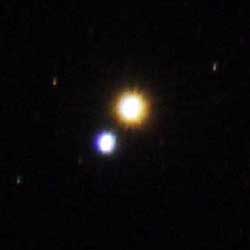
Monday, August 15 – With the constellation of Cygnus now reaching the upper third of the eastern skyline, tonight would be the perfect opportunity for us to look at a summer favourite – Albireo. As the second brightest star in Cygnus, you can locate it easily by looking slightly more than a fist’s width below (east) Vega, and about a handspan roughly south of Deneb. Your best results for color will be at minimum power for telescopes and even a steady hand with binoculars can split this pair. Now let’s have a look at this beautiful double star!

With a wonderfully rich field as a setting, you will find the third magnitude primary star to be very golden in color – a true K3 spectrum type. The secondary is close to fifth magnitude and is definitely tinged blue as its B8 V class suggests. First logged by F.W.G. Struve in 1832, they are believed to be a true physical pair although no orbital motion has yet been detected. At around 410 light years away, the primary star shows a composite spectrum and is in itself a double star too close to be split telescopically. While you look at this pair, realize their true separation is about 4400 AU. We could place our solar system, end-for-end, 55 times in this amount of “space”!

Now let’s turn our attention towards the Moon.

If you are using binoculars, tonight’s study feature will be the easy C-shape of Sinus Iridium. Known as the “Bay of Rainbows”, this 160 mile wide circular plain may very well be the result of an impact on the edge of Mare Imbrium. For telescope users, continue south to the western shore of Mare Cognitum and look along the terminator for the Riphaeus Mountains. This is the largest remainder of mare’s wall.

Tuesday, August 16 – Tonight let’s start with lunar observations and features that can be seen with both binoculars and telescopes. Just slightly north of center along the terminator, look for the bright point of Kepler. Watch as this 20 mile wide feature develops a bright ray system in the coming days. To the north you will see equally bright Aristarchus. Only about 5 miles wider, Aristarchus is quite probably one of the youngest of the prominent features – around 50 million years old – and will also develop a ray system.

Now let’s head south to the sunny shores of Mare Humorum and have a look at a much older feature – the graceful Gassendi. Making its home on the northern edge of a mare that’s around the size of the state of Arkansas, this class V crater will appear as a bright ring to binoculars, but take on special beauty in the telescope. While most of its south wall has almost disappeared thanks to lava flows, the ancient Gassendi still holds an impressive central triple mountain peak and a wonderful collection of rilles and ridges along its floor.

Wednesday, August 17 – Tonight let’s start by observing our western planets as they begin drawing nearer to each other. For the northern hemisphere, you will find Venus very low just south of west at dusk and crossing the celestial equator. Keep an eye on it for the next six weeks as it sets farther south. Less than a handspan above it to the left is bright Jupiter. This pair will put on a wonderful show in the days ahead!

If you are looking for an early evening challenge, then why not try your hand at 8.6 magnitude asteroid Ceres? On this date, it will be just slightly (around 1 degree) northeast of visual double, Nu Librae. For very accurate locator charts on the 17th, visit Heavens Above.

Tonight let’s turn our binoculars or telescopes toward the southern lunar surface as we set out to view one of the most unusually formed craters – Schiller. Near the limb, it will appear as a strange looking gash bordered in white on the southwest and in black on the northeast. This oblong depression might be the fusion of two or three craters, yet shows no evidence of crater walls on its smooth floor. Although there is a slight ridge towards the northern edge, Schiller’s formation still remains a mystery.

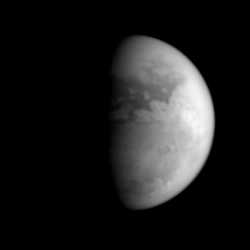
Thursday, August 18 – Today in 1868, Norman Lockyer first sees helium in the Sun’s spectrum. Just before the sun rises in the northern hemisphere, look for Mars high in the southeast. While our own summer is ending, summer has just begun in Mar’s southern hemisphere. Let’s check it out in the telescope.

Right now. Mars’ south pole is tipped 15 degrees towards Earth. Its southern polar cap is shrinking and may be hard to spot. Although its north pole is away from us, that particular polar area is normally surrounded by a haze of carbon dioxide which extends well into the visible face of the Red Planet.

Don’t go back to bed yet! Look low to the east/northeast and you’ll see Saturn a little more than a fist’s width below Pollux in Gemini. Need more? Then grab your binoculars and look about half a handspan lower than Saturn for Mercury.

Tonight the great Grimaldi around central on the terminator is the best lunar bet for binoculars. If you would like to see how far you can push your telescopic skill, then let’s start there. About one Grimaldi length to the south, you’ll see a narrow black ellipse with a bright rim. This is Rocca. Go the same distance again (and a bit east) to spot a small, shallow crater with a dark floor. This is Cruger, and its lava filled interior is very similar to previous study – Billy. Now look between them. Can you see a couple of tiny dark markings? Believe it or not, this is called Mare Aestatis. It’s not even large enough to be considered a medium-sized crater, but yet it is considered a mare!

Friday, August 19 – Born today in 1646, let’s have a look at John Flamsteed. He was a self-educated English astronomer with a passion for what he did. Despite a rather difficult childhood and no education, he went on to become the First Observer at the Royal Observatory and his catalog of 3000 stars was perhaps the most accurate ever published. Flamsteed star numbers are still in use today. Also born on this day, but in 1891 was Milton Humason. He was a colleague of Edwin Hubble at Mt. Wilson and Palomar. He was instrumental in measuring the faint spectra of galaxies, which in turn provided evidence for the expansion of the universe.

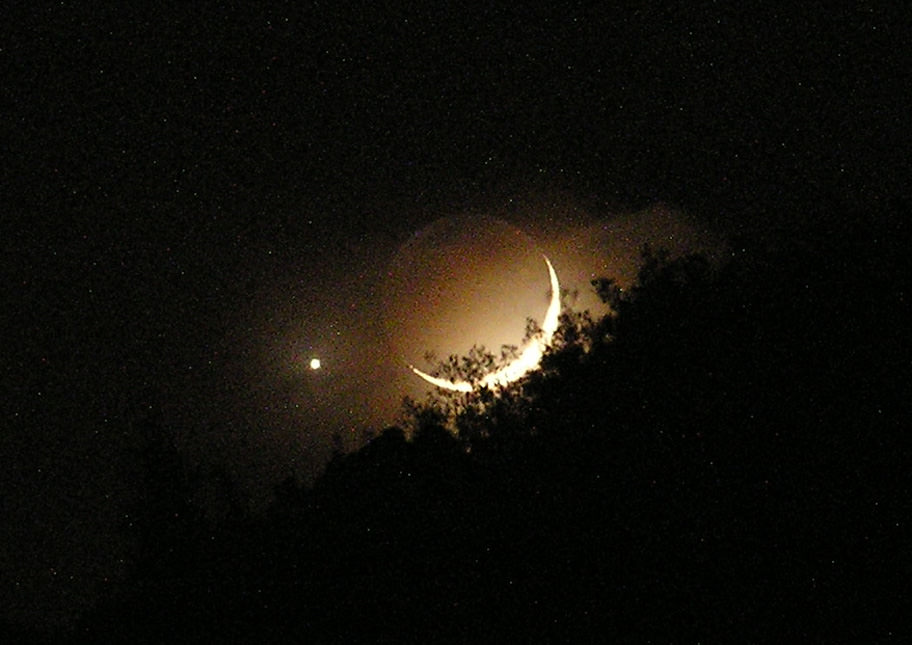
Early this morning, at 06:00, the Moon reached perigee – the closest point of its orbit – and was 357,393 km (222,074 miles) from Earth. That makes tonight’s full Moon the second closest of the year, but it’s also special for another reason.. It’s a Blue Moon.

Most people believe that a Blue Moon means two full Moons within the same month, and they would be correct. But, the traditional definition belongs to the third Full Moon in a season which has four Full Moons. The actual phrase came from the Farmer’s Almanac, which used a blue symbol to denote its date. In astronomy, each season starts according to the position of the Sun against the fixed stars, but since our Earth’s orbit is elliptical, this would give seasons unequal length. The Almanac instead uses the right ascension of the mean Sun, which gives each season the same period of time.

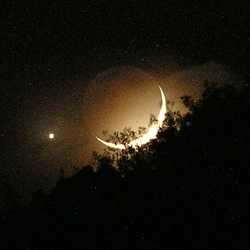
Regardless of whether you call it the Blue Moon, the Fruit Moon, or the Barley Moon, enjoy it – and Moon Illusion – tonight as it rises. For those of you with children, it would be a good time to instill a love of the night sky by having them hold a coin against the sky as comparison. Although our “colorful” Moon might look larger than life as it rises – it always stays the same size.

Saturday, August 20 – After sunset tonight, have a look at the southwestern skyline as two of the brightest planets in the sky are rapidly approaching one another. Have you noticed how quickly they are closing the gap? If you hold out your fist at arm’s length, you see that separation is just a tiny bit more that your fist’s size. Monitor them each night as they will soon dance much closer!

On the lunar surface, let’s have a look at the ancient walled plain – Gauss. Located north of Mare Crisium, this oblong crater should have the terminator running through it for most viewers tonight. Its east wall will be quite bright and the west wall will by outlined by a black arc. It is a very old crater, and if you up the magnification, you will see its ruined, cracked floor contains numerous small craters.

Tonight is the peak of the Kappa Cygnid meteor shower. Although the Moon will greatly interfere, there’s no harm in keeping an eye on the radiant area near Deneb. The average fall rate is about 12 per hour with many fireballs. Be sure to watch in the future, because its duration is around 15 days.

Sunday, August 21 – Although the Moon won’t rise for a little over an hour after tonight’s sunset in the northern hemisphere, it’s going to be a race between skydark and moonrise. How about if we take a look at a bright star cluster that’s equally great in either binoculars or telescope? Its name is M39.

Located about a fist’s width northeast of Deneb, you will easily see a couple of dozen stars in a triangular pattern. The M39 is particularly beautiful because it will seem almost three dimensional against its backdrop of fainter stars. Younger than the Coma Berenices cluster, and older than the Plieades, this loose, bright galactic cluster is around 800 light years away. Its members are all main sequence stars and the brightest of them are beginning to evolve into giants. Enjoy it tonight!

Until next week and darker skies? May all your journeys be at light speed! …~Tammy Plotner