ESO Image of Robert’s Quartet

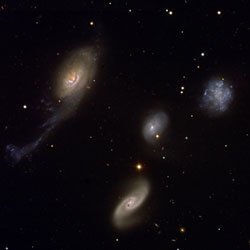
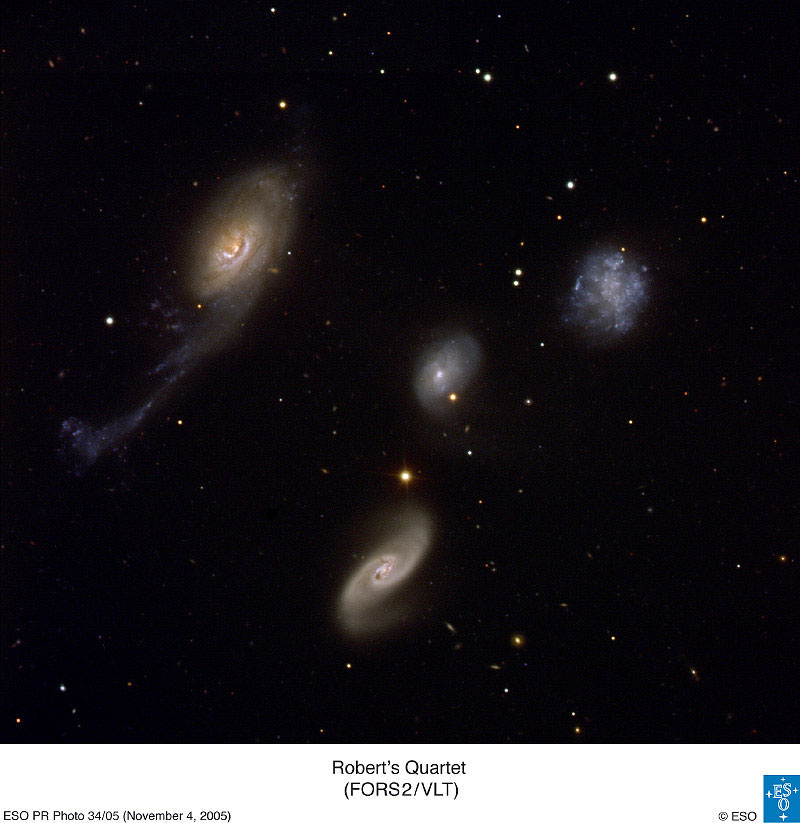
Robert’s Quartet. Image credit: ESO. Click to enlarge.
ESO PR Photo 34a/05 shows in amazing details a group of galaxies known as Robert’s Quartet [1]. The image is based on data collected with the FORS2 multi-mode instrument on ESO’s Very Large Telescope.

Robert’s Quartet is a family of four very different galaxies, located at a distance of about 160 million light-years, close to the centre of the southern constellation of the Phoenix. Its members are NGC 87, NGC 88, NGC 89 and NGC 92, discovered by John Herschel in the 1830s. NGC 87 (upper right) is an irregular galaxy similar to the satellites of our Milky Way, the Magellanic Clouds. NGC 88 (centre) is a spiral galaxy with an external diffuse envelope, most probably composed of gas. NGC 89 (lower middle) is another spiral galaxy with two large spiral arms. The largest member of the system, NGC 92 (left), is a spiral Sa galaxy with an unusual appearance. One of its arms, about 100,000 light-years long, has been distorted by interactions and contains a large quantity of dust.

The quartet is one of the finest examples of compact groups of galaxies. Because such groups contain four to eight galaxies in a very small region, they are excellent laboratories for the study of galaxy interactions and their effects, in particular on the formation of stars.

Using another set of VLT data also obtained with FORS2, astronomers [2] were able to study the properties of regions of active star formation (“HII regions” [3]) in the sister members of Robert’s Quartet. They found more than 200 of such regions in NGC 92, with a size between 500 and 1,500 light-years. For NGC 87, they detected 56 HII regions, while the two other galaxies appear to have far fewer of them. For NGC 88, however, they found two plume-like features, while NGC 89 presents a ring of enhanced stellar activity. The system is thus clearly showing increased star formation activity, most probably as the result of the interaction between its members. The sisters clearly belong to a perturbed family.

The quartet has a total visual magnitude of almost 13, i.e. it is about 600 times fainter than the faintest object that can be seen with the unaided eye. The brightest member of the group has a magnitude of about 14. On the sky, the four galaxies are all within a circle of radius of 1.6 arcmin, corresponding to about 75,000 light-years.

Notes
[1]: The group of galaxies was known as a Compact Group since 1977 by J.A. Rose, under the designation Rose 34. Robert’s Quartet is also known under the less poetic name of AM 0018-485 from the Catalogue of Southern Peculiar Galaxies and Associations, compiled in 1987 by astronomers Halton “Chip” Arp and Barry Madore. But who is Robert then? As discovered by Australian amateur astronomer Mike Kerr, Arp and Madore named Robert’s Quartet after Robert Freedman who generated many of the updated positions of galaxies in the catalogue. The astronomers clearly had a very good sense of humour as the catalogue also contains a system of galaxies called Wendy (ESO 147- 8; for Wendy Freedman) and another called the Conjugal galaxy (ESO 384- 53)!

[2]: The astronomers are S. Temporin (University of Innsbruck, Austria), S. Ciroi and P. Rafanelli (University of Padova, Italy), A. Iovino (INAF-Brera Astronomical Observatory, Italy), E. Pompei (ESO), and M. Radovich (INAF-Capodimonte Astronomical Observatory, Italy). (The article describing this result is available in PDF format at http://www.ast.cam.ac.uk/%7Esb2004/posters/files/Temporin.pdf)

[3]: The radiation of young hot stars embedded in an interstellar cloud is able to heat the surrounding gas, resulting in the apparition of an emission nebula that shines mostly in the light of ionized hydrogen (H) atoms. Such nebulae are therefore often referred to as “HII regions”. The well-known Orion Nebula is an outstanding example of that type of nebula.

Original Source: ESO News Release

Venus Mission Will Reveal Some Surprises

Artist illustration of Venus Express. Image credit: ESA. Click to enlarge.
University of Colorado at Boulder planetary scientist Larry Esposito, a member of the European Space Agency’s Venus Express science team, believes the upcoming mission to Earth’s “evil twin” planet should be full of surprises.

While its 875-degree F. surface is hot enough to make rocks glow and its atmosphere is filled with noxious carbon dioxide gases and acid rain, Venus actually is more Earth-like than Mars, said Esposito, a professor in CU-Boulder’s Laboratory for Atmospheric and Space Physics. A member of the Venus Monitoring Camera team for the $260 million now slated for launch from the Baikonur Cosmodrome in Kazakhstan on Nov. 9, Esposito said Venus is a “neglected planet” that undoubtedly harbors a number of astounding discoveries.

One question revolves around what is known as an “unknown ultraviolet absorber” high in the planet’s clouds that blocks sunlight from reaching the surface. “Some scientists believe there is the potential, at least, that life could be found in the clouds of Venus,” said Esposito. “There has been speculation that sunlight absorbed by the clouds might be involved in some kind of biological activity.”

Esposito is particularly eager to see if volcanoes on Venus are still active. In 1983 he used data from a CU-Boulder instrument that flew on NASA’s Pioneer Venus spacecraft to uncover evidence that a massive volcanic eruption there poured huge amounts of sulfur dioxide into the upper atmosphere. The eruption, which likely occurred in the late 1970s, appears to have been at least 10 times more powerful than any that have occurred on Earth in more than a century, he said.

“The spacecraft will be looking for ‘hotspots’ through the clouds in an attempt to make a positive detection of volcanoes,” said Esposito, who made the first observations of Venus with the Hubble Space Telescope in 1995. “While the Magellan mission that mapped Venus in the 1990s was not able to find evidence of volcanic activity, it did not close out the question. This will give us another shot.”

Since Venus and Earth were virtual twins at birth, scientists are puzzled how planets so similar in size, mass and composition could have evolved such different physical and chemical processes, he said. “The results from missions like this have major implications for our understanding of terrestrial planets as a whole, and for comparable processes occurring on Earth and Mars,” said Esposito.

Esposito has been involved in a number of planetary exploration missions at CU-Boulder. He currently is science team leader for the UltraViolet Imaging Spectrograph, a $12.5 million CU-Boulder instrument on the Cassini spacecraft now exploring the rings and moons of Saturn.

He also was an investigator for a CU-Boulder instrument that visited Jupiter and its moons in the 1990s aboard NASA’s Galileo spacecraft, and was an investigator for NASA’s Voyager 2 spacecraft that toted a CU-Boulder instrument on a tour of the solar system’s planets in the 1970s and 1980s.

Esposito was a science team member on two failed Russian missions to Mars — the 1988 Phobos mission that exploded in space and the Mars 96 mission that crashed in Earth’s ocean. Five of the science instruments on Venus Express are “spares” from the Mars Express and Rosetta comet mission, according to ESA.

In addition to the camera, the Venus Express spacecraft also is carrying two imaging spectrometers, a spectrometer to measure atmospheric constituents, a radio science experiment and a space plasma and atom-detecting instrument. The spacecraft is expected to arrive at Venus in April 2006 and orbit the planet for about 16 months.

The Venus Express mission originally was scheduled to launch Oct. 26, but a thermal-insulation problem discovered in the upper-stage booster rocket caused a two-week delay. The launch window closes on Nov. 24.

Original Source: UC Boulder News Release

Greenland’s Ice Sheet is Growing

Map of Greenland with temperature changes. Image credit: ESA. Click to enlarge.
Researchers have utilised more than a decade’s worth of data from radar altimeters on ESA’s ERS satellites to produce the most detailed picture yet of thickness changes in the Greenland Ice Sheet.

A Norwegian-led team used the ERS data to measure elevation changes in the Greenland Ice Sheet from 1992 to 2003, finding recent growth in the interior sections estimated at around six centimetres per year during the study period. The research is due to be published by Science Magazine in November, having been published in the online Science Express on 20 October.

ERS radar altimeters work by sending 1800 separate radar pulses down to Earth per second then recording how long their echoes take to bounce back 800 kilometres to the satellite platform. The sensor times its pulses’ journey down to under a nanosecond to calculate the distance to the planet below to a maximum accuracy of two centimetres.

ESA has had at least one working radar altimeter in polar orbit since July 1991, when ERS-1 was launched. ESA’s first Earth Observation spacecraft was joined by ERS-2 in April 1995, then the ten-instrument Envisat satellite in March 2002.

The result is a scientifically valuable long-term dataset covering Earth’s oceans and land as well as ice fields – which can be used to reduce uncertainty about whether land ice sheets are growing or shrinking as concern grows about the effects of global warming.

The ice sheet covering Earth’s largest island of Greenland has an area of 1 833 900 square kilometres and an average thickness of 2.3 kilometres. It is the second largest concentration of frozen freshwater on Earth and if it were to melt completely global sea level would increase by up to seven metres.

The influx of freshwater into the North Atlantic from any increase in melting from the Greenland Ice Sheet could also weaken the Gulf Stream, potentially seriously impacting the climate of northern Europe and the wider world.

Efforts to measure changes in the Greenland Ice Sheet using field observations, aircraft and satellites have improved scientific knowledge during the last decade, but there is still no consensus assessment of the ice sheet’s overall mass balance. There is however evidence of melting and thinning in the coastal marginal areas in recent years, as well as indications that large Greenland outlet glaciers can surge, possibly in response to climate variations.

Much less known are changes occurring in the vast elevated interior area of the ice sheet. Therefore an international team of scientists – from Norway’s Nansen Environmental and Remote Sensing Center (NERSC), Mohn-Sverdrup Center for Global Ocean Studies and Operational Oceanography and the Bjerknes Centre for Climate Research, Russia’s Nansen International Environmental and Remote Sensing Center and the United States’ Environmental Systems Analysis Research Center – were compelled to derive and analyse the longest continuous dataset of satellite altimeter observations of Greenland Ice Sheet elevations.

By combining tens of millions of data points from ERS-1 and ERS-2, the team determined spatial patterns of surface elevation variations and changes over an 11-year period.

The result is a mixed picture, with a net increase of 6.4 centimetres per year in the interior area above 1500 metres elevation. Below that altitude, the elevation-change rate is minus 2.0 cm per year, broadly matching reported thinning in the ice-sheet margins. The trend below 1500 metres however does not include the steeply-sloping marginal areas where current altimeter data are unusable.

The spatially averaged increase is 5.4 cm per year over the study area, when corrected for post-Ice Age uplift of the bedrock beneath the ice sheet. These results are remarkable because they are in contrast to previous scientific findings of balance in Greenland’s high-elevation ice.

The team, led by Professor Ola M. Johannessen of NERSC, ascribe this interior growth of the Greenland Ice Sheet to increased snowfall linked to variability in regional atmospheric circulation known as the North Atlantic Oscillation (NAO). First discovered in the 1920s, the NAO acts in a similar way to the El Niño phenomenon in the Pacific, contributing to climate fluctuations across the North Atlantic and Europe.

Comparing their data to an index of the NAO, the researchers established a direct relationship between Greenland Ice Sheet elevation change and strong positive and negative phases of the NAO during winter, which largely control temperature and precipitation patterns over Greenland.

Professor Johannessen commented: “This strong negative correlation between winter elevation changes and the NAO index, suggests an underappreciated role of the winter season and the NAO for elevation changes – a wildcard in Greenland Ice Sheet mass balance scenarios under global warming.”

He cautioned that the recent growth found by the radar altimetry survey does not necessarily reflect a long-term or future trend. With natural variability in the high-latitude climate cycle that includes the NAO being very large, even an 11-year long dataset remains short.

“There is clearly a need for continued monitoring using new satellite altimeters and other observations, together with numerical models to calculate the Greenland Ice Sheet mass budget,” Johannessen added.

Modelling studies of the Greenland Ice Sheet mass balance under greenhouse global warming have shown that temperature increases up to about 3ºC lead to positive mass balance changes at high elevations – due to snow accumulation – and negative at low elevations – due to snow melt exceeding accumulation.

Such models agree with the new observational results. However after that threshold is reached, potentially within the next hundred years, losses from melting would exceed accumulation from increases in snowfall – then the meltdown of the Greenland Ice Sheet would be on.

A paper published in Science in June this year detailed the results of a similar analysis of the Antarctic Ice Sheet based on ERS radar altimeter data, carried out by a team led by Professor Curt Davis of the University of Missouri-Columbia.

The results showed thickening in East Antarctica on the order of 1.8 cm per year, but thinning across a substantial part of West Antarctica. Data were unavailable for much of the Antarctic Peninsula, subject to recent ice sheet thinning due to regional climate warming, again because of limitations in current radar altimeter performance.

ESA’s CryoSat mission, lost during launch on 8 October, carried the world’s first radar altimeter purpose-built for use over both land and sea ice. In the context of land ice sheets, CryoSat would have been capable of acquiring data over steeply-sloping ice margins which remain invisible to current radar altimeters – these being the very regions where the greatest loss is taking place.

Efforts are currently underway to investigate the possibility of building and flying a CryoSat-2, with a decision to be taken by the end of the year. In the meantime, the valuable climatological record of ice sheet change established by ERS and Envisat will continue to be extended.

Original Source: ESA News Release

Two of Saturn’s Moons Split By the Rings

Tethys and Dione. Image credit: NASA/JPL/SSI. Click to enlarge.
Saturn’s expansive rings separate the moon’s Tethys (at the top) from Dione (at the bottom). Even in this distant view, it is easy to see that the moons’ surfaces, and likely their evolutionary histories, are very different.

Both moons are on the far side of the rings in this scene, which shows their Saturn-facing hemispheres (terrain centered on 0 degrees longitude). The dark shadow across the rings is cast by Saturn’s southern hemisphere.

The diameter of Tethys is 1,071 kilometers (665 miles) and the diameter of Dione is 1,126 kilometers (700 miles).

This image was taken in visible light with the Cassini spacecraft narrow-angle camera on Sept. 12, 2005, at a distance of approximately 2.4 million kilometers (1.5 million miles) from Saturn. The image scale is about 17 kilometers (11 miles) per pixel on the two moons.

The Cassini-Huygens mission is a cooperative project of NASA, the European Space Agency and the Italian Space Agency. The Jet Propulsion Laboratory, a division of the California Institute of Technology in Pasadena, manages the mission for NASA’s Science Mission Directorate, Washington, D.C. The Cassini orbiter and its two onboard cameras were designed, developed and assembled at JPL. The imaging operations center is based at the Space Science Institute in Boulder, Colo.

For more information about the Cassini-Huygens mission visit http://saturn.jpl.nasa.gov. The Cassini imaging team homepage is at http://ciclops.org.

Original Source: NASA/JPL/SSI News Release

Hubble Sees a Dust Storm on Mars

Mars photographed by Hubble. Image credit: Hubble. Click to enlarge.
NASA’s Hubble Space Telescope snapped this picture of Mars on October 28, within a day of its closest approach to Earth on the night of October 29. Hubble astronomers were also excited to have captured a regional dust storm on Mars that has been growing and evolving over the past few weeks.

The dust storm, which is nearly in the middle of the planet in this Hubble view is about 930 miles (1500 km) long measured diagonally, which is about the size of the states of Texas, Oklahoma, and New Mexico combined. No wonder amateur astronomers with even modest-sized telescopes have been able to keep an eye on this storm. The smallest resolvable features in the image (small craters and wind streaks) are the size of a large city, about 12 miles (20 km) across. The occurrence of the dust storm is in close proximity to the NASA Mars Exploration Rover Opportunity’s landing site in Sinus Meridiani. Dust in the atmosphere could block some of the sunlight needed to keep the rover operating at full power.

On October 29/30, Mars and Earth reached the point in their orbits where the two planets were the closest they have been since August of 2003. The red planet, named after the Roman god of war, won’t be this close again to Earth until 2018. At the 2005 closest approach Mars was at a distance of 43 million miles (69 million km), comparatively a stone’s throw across the solar system. Mars goes through a 26-month cycle where its distance from Earth changes. At times when the distance is smallest between the two planets, Mars appears brighter in the sky and larger through telescopes for Earth viewers.

This image of 2005 Mars closest approach was taken with Hubble’s Advanced Camera for Surveys. Different filters show blue, green, and red (250, 502 and 658 nanometer wavelengths). North is at the top of the image. Mars is now in its warmest months, closest to the Sun in its orbit, resulting in a smaller than normal south polar ice cap which has largely sublimated with the approaching summer.

The large regional dust storm appears as the brighter, redder cloudy region in the middle of the planet’s disk. This storm has been churning in the planet’s equatorial regions for several weeks now, and it is likely responsible for the reddish, dusty haze and other dust clouds seen across this hemisphere of the planet in views from Hubble, ground based telescopes, and the NASA and ESA spacecraft studying Mars from orbit. Bluish water-ice clouds can also be seen along the limbs and in the north (winter) polar region at the top of the image.

Original Source: Hubble News Release

Look Up, You Might See a Fireball

Taurid fireball photographed Oct. 28, 2005. Image credit: Hiroyuki Iida. Click to enlarge.
“I thought some wise guy was shining a spotlight at me,” says Josh Bowers of New Germany, Pennsylvania. “Then I realized what it was: a fireball in the southern sky. I was doing some backyard astronomy around 9 p.m. on Halloween (Oct. 31, 2005), and this meteor was so bright it made me lose my night vision.”

Bowers wasn’t the only one who saw the fireball. Lots of people were outdoors Trick or Treating. They saw what Bowers saw … and more. Before the night was over, reports of meteors “brighter than a full moon” were streaming in from coast to coast.

Astronomers have taken to calling these the “Halloween fireballs.” But there’s more to it than Halloween. The display has been going on for days.

On Oct. 30, for example, Bill Plaskon of Jonesport, Maine, was “observing Mars through a 10-inch telescope at 10:04 p.m. EST when a brilliant fireball lit up the sky and left a short corkscrew-like smoke trail that lasted about 1 minute.”

On Oct 28, Lance Taylor of Edmonton, Alberta, woke up early to go fishing with five friends. At about 6 a.m. they “noticed a nice fireball. Then 20 minutes later there was another,” he says.

On Nov. 2 in the Netherlands, “The sky lit up very bright,” reports Koen Miskotte. “In the corner of my eye I saw a fireball about as bright [as a crescent moon].”

And so on?.

What’s happening? “People are probably seeing the Taurid meteor shower,” says meteor expert David Asher of the Armagh Observatory in Northern Ireland.

Every year in late October and early November, he explains, Earth passes through a river of space dust associated with Comet Encke. Tiny grains hit our atmosphere at 65,000 mph. At that speed, even a tiny smidgen of dust makes a vivid streak of light–a meteor–when it disintegrates. Because these meteors shoot out of the constellation Taurus, they’re called Taurids.

Most years the shower is weak, producing no more than five rather dim meteors every hour. But occasionally, the Taurids put on quite a show. Fireballs streak across the sky, ruining night vision and interrupting fishing trips.

Asher thinks 2005 could be such a year.

According to Asher, the fireballs come from a swarm of particles bigger than the usual dust grains. “They’re about the size of pebbles or small stones,” he says. (It may seem unbelievable that a pebble can produce a fireball as bright as the Moon, but remember, these things hit the atmosphere at very high speed.) The rocky swarm moves within the greater Taurid dust stream, sometimes hitting Earth, sometimes not.

“In the early 1990s, when Victor Clube was supervising my PhD work on Taurids,” recalls Asher, “we came up with this model of a swarm within the Taurid stream to explain enhanced numbers of bright Taurid meteors being observed in particular years.” They listed “swarm years” in a 1993 paper in the Quarterly Journal of the Royal Astronomical Society and predicted an encounter in 2005.

It seems to be happening.

When should you look? You might see a fireball flitting across the sky any time Taurus is above the horizon. At this time of year, the Bull rises in the east at sunset. The odds of seeing a bright meteor improve as the constellation climbs higher. By midnight, Taurus is nearly overhead, so that is a particularly good time.

According to the International Meteor Organization, the Taurid shower peaks between Nov. 5th and Nov. 12th. “Earth takes a week or two to traverse the swarm,” notes Asher. “This comparatively long duration means you don’t get spectacular outbursts like a Leonid meteor storm.” It’s more of a slow drizzle–“maybe one every few hours,” says Asher.

A drizzle of fireballs, however, is nothing to sneeze at. So keep an eye on the sky this month for Taurids.

Original Source: Science@NASA Story

Cosmic Cloudshine

Cloudshine in L1448. Image credit: CfA. Click to enlarge.
Hubble’s iconic images include many shots of cosmic clouds of gas and dust called nebulae. For example, the famous “Pillars of Creation” mark the birthplace of new stars within the Eagle Nebula. Yet despite their beauty, visible-light images show only the nebulae surfaces. Baby stars may hide beneath, invisible even to Hubble’s powerful gaze.

Harvard astronomers have pioneered a new way to peer below the surface using near-infrared light that is invisible to the human eye. The resulting images are both beautiful and scientifically valuable because they can be used to map the structure of interstellar matter.

“We can now see the structure of gigantic star-forming regions over vast distances with a resolution 50 times better than before,” said Alyssa Goodman of the Harvard-Smithsonian Center for Astrophysics (CfA). “This technique will revolutionize the way we map stellar birthplaces.”

While Hubble’s NICMOS instrument and NASA’s Spitzer Space Telescope also use infrared light to study nebular interiors, ground-based images at near-infrared wavelengths provide an unparalleled combination of wide-field coverage and high resolution.

“Images like these will give astronomers new insight into what those giant complexes of gas and dust really look like,” added Jonathan Foster, a graduate student at Harvard University and the paper’s first author.

The researchers took long-exposure photographs of a star-forming region in the constellation Perseus and were surprised to see something they had never seen before. Just as earthly clouds shine orange at night as they reflect light from streetlights below, they discovered that clouds in outer space show a similar effect. In space, otherwise “dark” clouds of dust and gas are illuminated by faint starlight washing over them.

Goodman and Foster dubbed the new celestial phenomenon “cloudshine.” Their long-exposure, near-infrared images uncovered the faintly shining billows of material. Recent advances in infrared detectors, combined with longer than usual imaging times, led to the discovery.

“Other astronomers have seen hints of cloudshine in their images, but our new photographs are the most spectacular evidence of cloudshine to date,” said Goodman.

Reflection nebulae such as the wisps surrounding the Pleiades star cluster have been observed for decades. Importantly, the Pleiades and other famous “nebulae” are illuminated from within, by the stars associated with them, as a cloud is when fireworks explode inside of it. Cloudshine is the result of the illumination of otherwise “dark” clouds from “without,” by the faint, and nearly uniform, ambient light produced by the sum of all the stars outside the cloud. Simple modeling in Foster & Goodman’s paper demonstrates that there is enough of this faint ambient light to illuminate the clouds at the levels observed.

The cloudshine images were obtained as part of the COMPLETE survey (Coordinated Molecular Probe Line Extinction Thermal Emission) of star-forming regions. COMPLETE involves making wide-field, high-resolution studies of three nearby star-forming regions. COMPLETE will allow for detailed analysis and understanding of the physics of star formation on scales ranging from one-hundredth of a light-year up to 30 light-years.

A companion paper by astronomer Paolo Padoan (UC San Diego) and colleagues describes theoretical modeling of the cloudshine effect in turbulent clouds of gas. They showed that the near-infrared “color” of a nebula correlates to the nebula’s density, and can therefore be used to map its structure.

“By using cloudshine, astronomers can study star-forming regions at a very small scale,” said Padoan. “We will be able to learn much more about the physics of star formation.”

Foster and Goodman anticipate gathering many additional images of cloudshine as the COMPLETE survey continues.

“We can cover wide areas of the sky at high resolution relatively quickly,” said Foster. “We expect that this will become the best technique for mapping the density of `dark’ clouds with very high resolution.”

Foster and Goodman’s paper reporting the cloudshine observations has been submitted for publication to The Astrophysical Journal Letters and is available online at http://arxiv.org/abs/astro-ph/0510624.

A paper on the theory of cloudshine by Padoan, Mika Juvela and Veli-Matti Pelkonen (University of Helsinki) also has been submitted for publication to The Astrophysical Journal Letters and is available online at http://arxiv.org/abs/astro-ph/0510600.

Foster and Goodman’s work, and the COMPLETE Survey, are supported by the National Science Foundation, NASA, and Harvard University.

Headquartered in Cambridge, Mass., the Harvard-Smithsonian Center for Astrophysics (CfA) is a joint collaboration between the Smithsonian Astrophysical Observatory and the Harvard College Observatory. CfA scientists, organized into six research divisions, study the origin, evolution and ultimate fate of the universe.

Original Source: CfA News Release

Best View of the Milky Way’s Core

The Milky Way’s nucleus. Sagittarius A* is the bright white dot at center. Image credit: NRAO/AUI/NSF, Jun-Hui Zhao, W.M. Goss. Click to enlarge.
Astronomers have gotten their deepest glimpse into the heart of our Milky Way Galaxy, peering closer to the supermassive black hole at the Galaxy’s core then ever before. Using the National Science Foundation’s continent-wide Very Long Baseline Array (VLBA), they found that a radio-wave-emitting object at the Galaxy’s center would nearly fit between the Earth and the Sun. This is half the size measured in any previous observation.

“We’re getting tantalizingly close to being able to see an unmistakable signature that would provide the first concrete proof of a supermassive black hole at a galaxy’s center,” said Zhi-Qiang Shen, of the Shanghai Astronomical Observatory and the Chinese Academy of Sciences. A black hole is a concentration of mass so dense that not even light can escape its powerful gravitational pull.

The astronomers used the VLBA to measure the size of an object called Sagittarius A* (pronounced “A-star”) that marks the exact center of our Galaxy. Last year, a different team announced that their measurements showed the object would fit inside the complete circle of Earth’s orbit around the Sun. Shen and his team, by observing at a higher radio frequency, measured Sagittarius A* as half that size.

A mass equal to four million Suns is known to lie within Sagittarius A*, and the new measurement makes the case for a black hole even more compelling than it was previously. Scientists simply don’t know of any long-lasting object other than a black hole that could contain this much mass in such a small area. However, they would like to see even stronger proof of a black hole.

“The extremely strong gravitational pull of a black hole has several effects that would produce a distinctive ‘shadow’ that we think we could see if we can image details about half as small as those in our latest images,” said Fred K.Y. Lo, Director of the National Radio Astronomy Observatory and another member of the research team. “Seeing that shadow would be the final proof that a supermassive black hole is at the center of our Galaxy,” Lo added.

Many galaxies are believed to have supermassive black holes at their centers, and many of these are much more massive than the Milky Way’s black hole. The Milky Way’s central black hole is much less active than that of many other galaxies, presumably because it has less nearby material to “eat.” Astronomers believe that the radio waves they see coming from Sagittarius A* are either generated by particle jets that have been detected in many more-active galaxies or from accretion flows that are spiraling into the central black hole. By observing the object at higher radio frequencies, scientists have detected a region of radiation ever closer to the black hole. The results announced last year were based on observations at 43 GigaHertz (GHz), and the latest observations were made at 86 GHz.

“We believe that if we can double the frequency again, we will see the black-hole shadow produced by effects of Einstein’s General Relativity theory,” Lo said.

In a few years, when the Atacama Large Millimeter Array (ALMA) comes on line, it may be used in conjunction with other millimeter-wave telescopes to make the higher-frequency observations that will reveal the telltale black-hole shadow.

At a distance of 26,000 light-years, the Milky Way’s central black hole is the closest such supermassive object. That makes it the most likely one to finally reveal the concrete evidence for a black hole that astronomers have sought for years.

Shen and Lo worked with Mao-Chang Liang of Caltech, Paul Ho of the Harvard-Smithsonian Center for Astrophysics (CfA) and the Institute of Astronomy & Astrophysics of the Academia Sinica in Taiwan, and Jun-Hui Zhao of CfA. The astronomers published their findings in the November 3 issue of the scientific journal Nature.

The National Radio Astronomy Observatory is a facility of the National Science Foundation, operated under cooperative agreement by Associated Universities, Inc.

Original Source: NRAO News Release

First Light of the Universe?

Artist illustration of the early Universe. Image credit: NASA/JPL-Caltech/R. Hurt (SSC). Click to enlarge.
Scientists using NASA’s Spitzer Space Telescope say they have detected light that may be from the earliest objects in the universe. If confirmed, the observation provides a glimpse of an era more than 13 billion years ago when, after the fading embers of the theorized Big Bang gave way to millions of years of pervasive darkness, the universe came alive.

This light could be from the very first stars or perhaps from hot gas falling into the first black holes. The science team, based at NASA Goddard Space Flight Center in Greenbelt, Md., describes the observation as seeing the glow of a distant city at night from an airplane. The light is too distant and feeble to resolve individual objects.

“We think we are seeing the collective light from millions of the first objects to form in the universe,” said Dr. Alexander Kashlinsky, Science Systems and Applications scientist and lead author on the Nature article that appeared in the Nov. 3 issue. “The objects disappeared eons ago, yet their light is still traveling across the universe.”

Scientists theorize that space, time and matter originated 13.7 billion years ago in a Big Bang. Another 200 million years would pass before the era of first starlight. A 10-hour observation by Spitzer’s infrared array camera in the constellation Draco captured a diffuse glow of infrared light, lower in energy than optical light and invisible to us. The Goddard team says that this glow is likely from Population III stars, a hypothesized class of stars thought to have formed before all others. (Population I and II stars, named by order of their discovery, comprise the familiar types of stars we see at night.)

Theorists say the first stars were likely over a hundred times more massive than Earth’s sun and extremely hot, bright, and short-lived, each one burning for only a few million years. The ultraviolet light that Population III stars emitted would be redshifted, or stretched to lower energies, by the universe’s expansion. That light should now be detectable in the infrared.

“This deep observation was filled with familiar-looking stars and galaxies,” said Dr. John Mather, senior project scientist for JWST and a co-author on the Nature article. “We removed everything we knew—all the stars and galaxies both near and far. We were left with a picture of part of the sky with no stars or galaxies, but it still had this infrared glow with giant blobs that we think could be the glow from the very first stars.”

This new Spitzer discovery agrees with observations from the NASA Cosmic Background Explorer (COBE) satellite from the 1990s that suggested there may be an infrared background that could not be attributed to known stars. It also supports observations from the NASA Wilkinson Microwave Anisotropy Probe from 2003, which estimated that stars first ignited 200 million to 400 million years after the Big Bang.

“This difficult measurement pushes the instrument to performance limits that were not anticipated in its design,” said team member Dr. S. Harvey Moseley, instrument scientist for Spitzer. “We have worked very hard to rule out other sources for the signal we observed.”

The low noise and high resolution of Spitzer’s infrared array camera enabled the team to remove the fog of foreground galaxies, made of later stellar populations, until the cumulative light from the first light dominated the signal on large angular scales. The team, which also includes Dr. Richard Arendt, Science Systems and Applications scientist, noted that future missions, such as NASA’s James Webb Space Telescope, will find the first individual clumps of these stars or the individual exploding stars that might have made the first black holes.

This analysis was partially funded through the National Science Foundation. The Jet Propulsion Laboratory, Pasadena, Calif., manages the Spitzer mission for NASA. Science operations are conducted at the Spitzer Science Center at the California Institute of Technology in Pasadena. NASA Goddard built Spitzer’s infrared array camera which took the observations. The instrument’s principal investigator is Dr. Giovanni Fazio, Smithsonian Astrophysical Observatory, Cambridge, Mass.

Original Source: Spitzer News Release

Methane Producing Bacteria Found in the Desert

View of the desert in Utah. Image credit: Mars Desert Research Station. Click to enlarge.
Evidence of methane-producing organisms can be found in inhospitable soil environments much like those found on the surface of Mars, according to experiments undertaken by scientists and students from the Keck School of Medicine of USC and the University of Arkansas and published online in the journal Icarus.

The results, they said, provide ample impetus for similar “biodetection experiments” to be considered for future missions to Mars.

“Methane-producing organisms are the ones most likely to be found on Mars,” noted Joseph Miller, associate professor of cell and neurobiology in the Keck School and one of the study’s lead researchers. “And, in fact, methane was detected on Mars last year.”

Methane is considered to be a biological signature for certain living organisms that metabolize organic matter under conditions of low or no oxygen.

Terrestrial methanogens (methane-producers) are typically found in environments largely protected from atmospheric oxygen, such as peat bogs, oceanic methane ices and anoxic levels of the ocean. But they previously had not been detected in an arid desert environment.

To see if methane could be found in Mars-like soil, the investigators collected soil and vapor samples from the arid environment of the Mars Desert Research Station in Utah and then compared them with vapor samples taken from the Idaho High Desert and soil samples from Death Valley, the Arctic and the Atacama desert in Chile.

Three of five vapor samples from the Utah site showed the presence of methane; there was no methane found in any of the vapor samples from Idaho. Similarly, while five of 40 soil samples from Utah produced methane after the addition of growth medium to the samples – indicating that the methane was being given off by a biological organism, most likely a bacterium – none of the other soil samples showed signs of methane production.

Finding methane in the Utah desert is no guarantee that methane-producers exist on Mars, said Miller, who previously has analyzed data from the Viking Lander missions and found that soil samples taken in the 1970s from the Martian surface exhibited a circadian rhythm in what appeared to be nutrient metabolism, much like that present in terrestrial microbes.

However, Miller said, this recent experiment does provide “proof of principle [in that] it improves the case that such bacteria can and might exist on the Martian surface.” And, he added, that surely warrants further investigation during future missions to Mars.

In conclusion, the researchers wrote, “The detection of methane, apparently of biological origin, in terrestrial desert regolith bodes well for future biodetection experiments in at least partially analogous Martian environments.”

Original Source: USC News Release