Titan’s Sandy Oceans

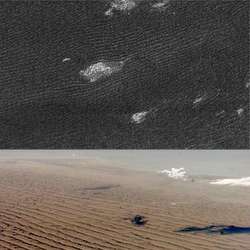
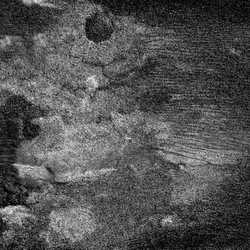
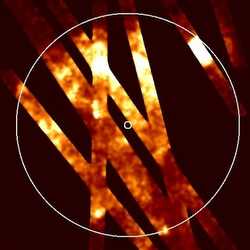
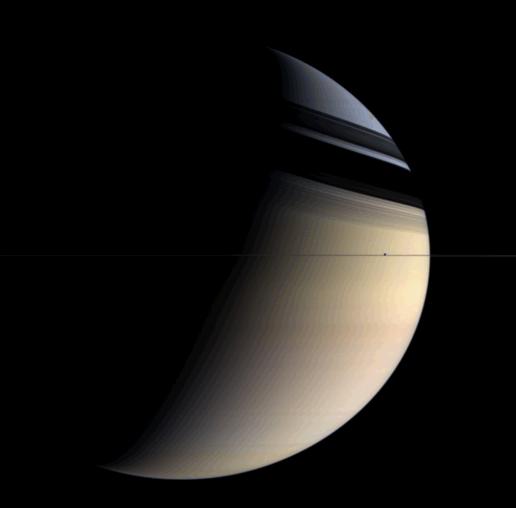
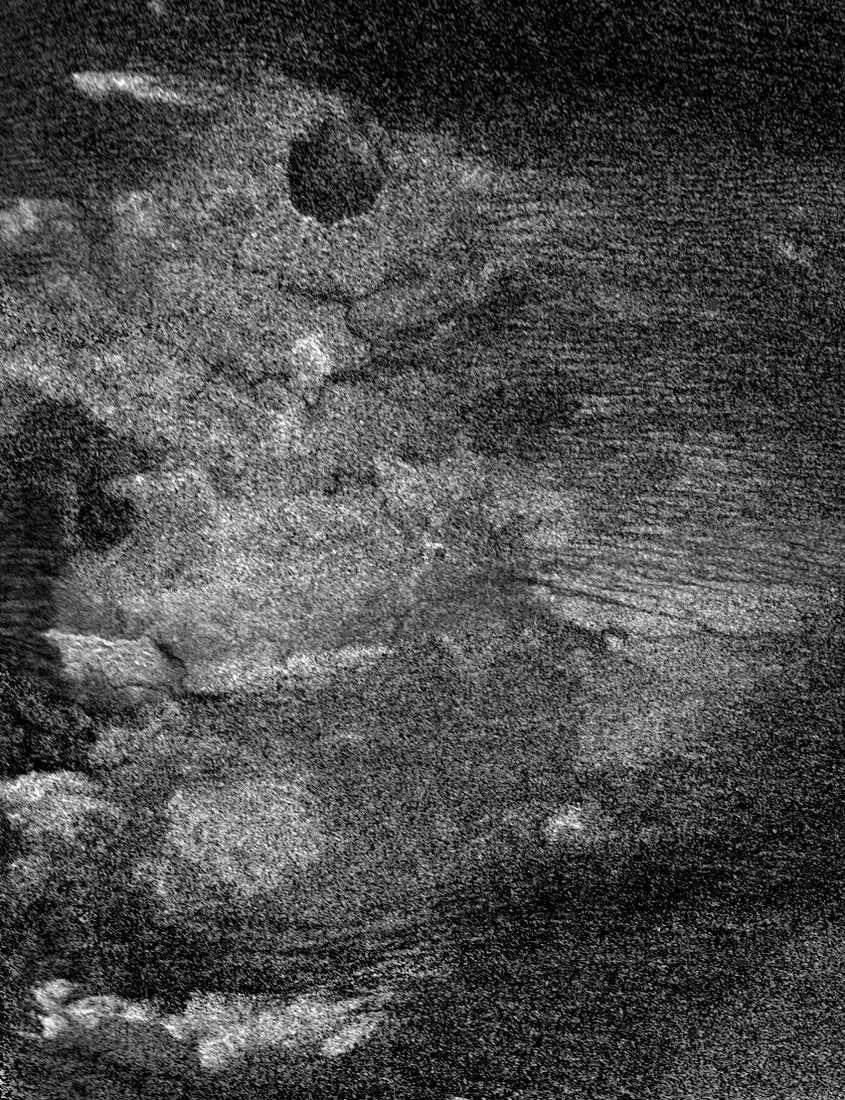
Titan’s sand dunes. Image credit: NASA/JPL. Click to enlarge
When they first noticed the dark equatorial regions on Titan, researchers thought they could be looking at oceans of liquid methane. But new radar images taken by NASA’s Cassini spacecraft has provided the answer: sand dunes. The images show enormous dunes that run parallel to each other for hundreds of kilometers. Saturn’s powerful gravity causes gentle winds on Titan, possibly transporting sand from across the moon and depositing it around the equator.

Until a couple of years ago, scientists thought the dark equatorial regions of Titan might be liquid oceans.

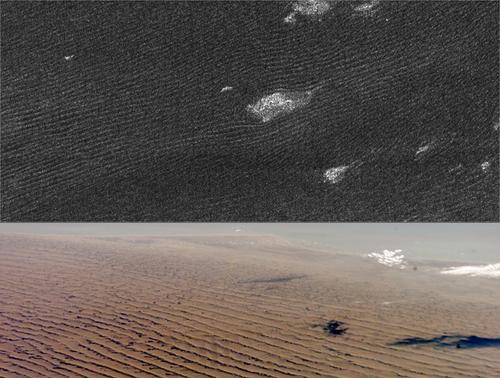
New radar evidence shows they are seas — but seas of sand dunes like those in the Arabian or Namibian Deserts, a University of Arizona member of the Cassini radar team and colleagues report in Science (May 5).

Radar images taken when the Cassini spacecraft flew by Titan last October show dunes 330 feet (100 meters) high that run parallel to each other for hundreds of miles at Titan’s equator. One dune field runs more than 930 miles (1500 km) long, said Ralph Lorenz of UA’s Lunar and Planetary Laboratory.

“It’s bizarre,” Lorenz said. “These images from a moon of Saturn look just like radar images of Namibia or Arabia. Titan’s atmosphere is thicker than Earth’s, its gravity is lower, its sand is certainly different — everything is different except for the physical process that forms the dunes and resulting landscape.”

Ten years ago, scientists believed that Saturn’s moon Titan is too far from the sun to have solar-driven surface winds powerful enough to sculpt sand dunes. They also theorized that the dark regions at Titan’s equator might be liquid ethane oceans that would trap sand.

But researchers have since learned that Saturn’s powerful gravity creates significant tides in Titan’s atmosphere. Saturn’s tidal effect on Titan is roughly 400 times greater than our moon’s tidal pull on Earth.

As first seen in circulation models a couple of years ago, Lorenz said, “Tides apparently dominate the near-surface winds because they’re so strong throughout the atmosphere, top to bottom. Solar-driven winds are strong only high up.”

The dunes seen by Cassini radar are a particular linear or longitudinal type that is characteristic of dunes formed by winds blowing from different directions. The tides cause wind to change direction as they drive winds toward the equator, Lorenz said.

And when the tidal wind combines with Titan’s west-to-east zonal wind, as the radar images show, it creates dunes aligned nearly west-east except near mountains that influence local wind direction.

“When we saw these dunes in radar it started to make sense,” he said. “If you look at the dunes, you see tidal winds might be blowing sand around the moon several times and working it into dunes at the equator. It’s possible that tidal winds are carrying dark sediments from higher latitudes to the equator, forming Titan’s dark belt.”

The researchers’ model of Titan suggests tides can create surface winds that reach about one mile per hour (a half-meter per second). “Even though this is a very gentle wind, this is enough to blow grains along the ground in Titan’s thick atmosphere and low gravity,” Lorenz said. Titan’s sand is a little coarser but less dense than typical sand on Earth or Mars. “These grains might resemble coffee grounds.”

The variable tidal wind combines with Titan’s west-to-east zonal wind to create surface winds that average about one mile per hour (a half meter per second). Average wind speed is a bit deceptive, because sand dunes wouldn’t form on Earth or Mars at their average wind speeds.

Whether the grains are made of organic solids, water ice, or a mixture of both is a mystery. Cassini’s Visual and Infrared Mapping Spectrometer, led by UA’s Robert Brown, may get results on sand dune composition.

How the sand formed is another peculiar story.

Sand may have formed when liquid methane rain eroded particles from ice bedrock. Researchers previously thought that it doesn’t rain enough on Titan to erode much bedrock, but they thought in terms of average rainfall.

Observations and models of Titan show that clouds and rain are rare. That means that individual storms could be large and still yield a low average rainfall, Lorenz explained.

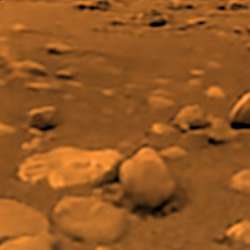
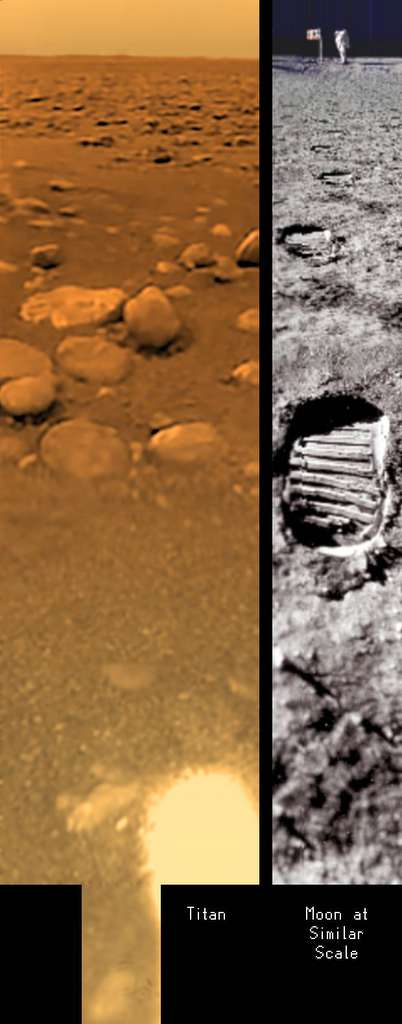
When the UA-led Descent Imager/Spectral Radiometer (DISR) team produced images taken during the Huygens probe landing on Titan in January 2005, the world saw gullies, streambeds and canyons in the landscape. These same features on Titan have been seen with radar.

These features show that when it does rain on Titan, it rains in very energetic events, just as it does in the Arizona desert, Lorenz said.

Energetic rain that triggers flash floods may be a mechanism for making sand, he added.

Alternatively, the sand may come from organic solids produced by photochemical reactions in Titan’s atmosphere.

“It’s exciting that the radar, which is mainly to study the surface of Titan, is telling us so much about how winds on Titan work,” Lorenz said. “This will be important information for when we return to Titan in the future, perhaps with a balloon.”

An international group of scientists are co-authors on the Science article, “The Sand Seas of Titan: Cassini Observations of Longitudinal Dunes.” They are from the Jet Propulsion Laboratory, California Institute of Technology, U.S. Geological Survey – Flagstaff, Planetary Science Institute, Wheeling Jesuit College, Proxemy Research of Bowie, Md., Stanford University, Goddard Institute for Space Studies, Observatoire de Paris, International Research School of Planetary Sciences, Universita’ d’Annunzio, Facolt di Ingegneria, Universit La Sapienza, Politecnico di Bari and Agenzia Spaziale Italiana. Jani Radebaugh and Jonathan Lunine of UA’s Lunar and Planetary Laboratory are among the co-authors.

The Cassini-Huygens mission is a cooperative project of NASA, the European Space Agency and the Italian Space Agency. The Jet Propulsion Laboratory, a division of the California Institute of Technology in Pasadena, manages the mission for NASA’s Science Mission Directorate, Washington. The Cassini orbiter was designed, developed and assembled at JPL.

Original Source: UA News Release

New Technique for Finding Organic Molecules in Meteorites

Tiny particles of meteorites with portions of nitrogen and hydrogen. Image credit: Henner Busemann. Click to enlarge
When the Solar System first formed billions of years ago, organic molecules – the building blocks of life – were churned into the mix that went on to create the planets. Scientists from the Carnegie Institution have developed a technique to find these tiny organic particles hidden inside meteorites. These meteorites have survived since the formation of the Solar System, so it allows scientists to track the distribution of organic material and the processes they went through as the planets formed.

Like an interplanetary spaceship carrying passengers, meteorites have long been suspected of ferrying relatively young ingredients of life to our planet. Using new techniques, scientists at the Carnegie Institution’s Department of Terrestrial Magnetism have discovered that meteorites can carry other, much older passengers as well-primitive, organic particles that originated billions of years ago either in interstellar space, or in the outer reaches of the solar system as it was beginning to coalesce from gas and dust. The study shows that the parent bodies of meteorites-the large objects from the asteroid belt-contain primitive organic matter similar to that found in interplanetary dust particles that might come from comets. The finding provides clues about how organic matter was distributed and processed in the solar system during this long-gone era. The work is published in the May 5, 2006, issue of Science.

“Atoms of different elements come in different forms, or isotopes, and the relative proportions of these depend on the environmental conditions in which their carriers formed, such as the heat encountered, chemical reactions with other elements, and so forth,” explained lead author Henner Busemann. “In this study we looked at the relative amounts of different isotopes of hydrogen (H) and nitrogen (N) associated with tiny particles of insoluble organic matter to determine the processes that produced the most pristine type of meteorites known. The insoluble material is very hard to break down chemically and survives even very harsh acid treatments.”

The researchers used a microscopic imaging technique to analyze the isotopic composition of insoluble organic matter from six carbonaceous chondrite meteorites-the oldest type known. The relative proportion of isotopes of nitrogen and hydrogen associated with the insoluble organic matter act as “fingerprints” and can reveal how and when the carbon was formed. The isotope of nitrogen that is most often found in nature is 14N; its heavier sibling is 15N. Differing amounts of 15N, in addition to a heavier form of hydrogen called deuterium, (D), allow researchers to tell if a particle is relatively unaltered from the time when the solar system was first forming.

“The tell-tale signs are lots of deuterium and 15N chemically bonded to carbon,” commented co-author Larry Nittler. “We have known for some time, for instance, that interplanetary dust particles (IDP), collected from high-flying airplanes in the upper atmosphere, contain huge excesses of these isotopes, probably indicating vestiges of organic material that formed in the interstellar medium. The IDPs have other characteristics indicating that they originated on bodies-perhaps comets-that have undergone less severe processing than the asteroids from which meteorites originate.”

The scientists found that some meteorite samples, when examined at the same tiny scales as interplanetary dust particles, actually have similar or even higher abundances of 15N and D than those reported for IDPs. “It’s amazing that pristine organic molecules associated with these isotopes were able to survive the harsh and tumultuous conditions present in the inner solar system when the meteorites that contain them came together,” reflected co-author Conel Alexander. “It means that the parent bodies-the comets and asteroids-of these seemingly different types of extraterrestrial material are more similar in origin than previously believed.”

“Before, we could only explore minute samples from IDPs. Our discovery now allows us to extract large amounts of this material from meteorites, which are large and contain several percent of carbon, instead of from IDPs, which are on the order of a million million times less massive. This advancement has opened up an entirely new window on studying this elusive period of time,” concluded Busemann.

Original Source: Carnegie Institution

Hubble Pictures of Red Spot Jr.

Jupiter’s junior red spot. Image credit: NASA/ESA. Click to enlarge
The Hubble Space Telescope has snapped a picture of “Red Spot Jr.”, the newly forming storm on Jupiter. This new spot is half the size of Jupiter’s Great Red Spot, and formed after three white storms merged together. But when viewed in near-infrared wavelengths, the spot is as prominent as the Great Red Spot, so this is a big storm too. Scientists think that Jupiter might be in the midst of a global climate change, warming up a few degrees in some latitudes.

NASA’s Hubble Space Telescope is giving astronomers their most detailed view yet of a second red spot emerging on Jupiter. For the first time in history, astronomers have witnessed the birth of a new red spot on the giant planet, which is located half a billion miles away. The storm is roughly one-half the diameter of its bigger and legendary cousin, the Great Red Spot. Researchers suggest that the new spot may be related to a possible major climate change in Jupiter’s atmosphere.

Dubbed by some astronomers as “Red Spot Jr.,” the new spot has been followed by amateur and professional astronomers for the past few months. But Hubble’s new images provide a level of detail comparable to that achieved by NASA’s Voyager 1 and 2 spacecraft as they flew by Jupiter a quarter-century ago.

Before it mysteriously changed to the same color as the Great Red Spot, the smaller spot was known as the White Oval BA. It formed after three white oval-shaped storms merged during 1998 to 2000. At least one or two of the progenitor white ovals can be traced back to 90 years ago, but they may have been present earlier. A third spot appeared in 1939. (The Great Red Spot has been visible for the past 400 years, ever since earthbound observers had telescopes to see it).

When viewed at near-infrared wavelengths (specifically 892 nanometers – a methane gas absorption band) Red Spot Jr. is about as prominent in Jupiter’s cloudy atmosphere as the Great Red Spot. This may mean that the storm rises miles above the top of the main cloud deck on Jupiter just as its larger cousin is thought to do. Some astronomers think the red hue could be produced as the spots dredge up material from deeper in Jupiter’s atmosphere, which is then chemically altered by the Sun’s ultraviolet light.

Researchers think the Hubble images may provide evidence that Jupiter is in the midst of a global climate change that will alter its average temperature at some latitudes by as much as 10 degrees Fahrenheit. The transfer of heat from the equator to the planet’s south pole is predicted to nearly shut off at 34 degrees southern latitude, the latitude where the second red spot is forming. The effects of the shut-off were predicted by Philip Marcus of the University of California, Berkeley (UCB) to become apparent approximately seven years after the White Oval collisions in 1998 to 2000.

Two teams of astronomers were given discretionary time on Hubble to observe the new red spot.

Original Source: HubbleSite News Release

Measuring a Day on Saturn

Dreamy colours of Saturn. Image credit: NASA/JPL/SSI. Click to enlarge
With solid planets, like the Earth and Mars, it’s easy to track the length of their days. Just watch for a surface feature to rotate into view again. With gas giants, however, it’s a tricky business. Scientists have used features of Saturn’s magnetic field to act like objects on its surface; tracking the amount of time it takes for that point in the magnetic field to rotate around again. Cassini has determined that Saturn’s day is 10 hours, 47 minutes, 6 seconds (+- 40 seconds).

We all know Earth rotates every 24 hours, but scientists have long had difficulty pinpointing how long the day is on Saturn. The magnetometer onboard the Cassini spacecraft has, for the first time ever, measured a periodic signal in Saturn’s magnetic field, key information to finally understanding the length of a Saturn day and the evolution of this gaseous planet.

The latest research suggests a Saturn day is 10 hours, 47 minutes, 6 seconds (plus or minus 40 seconds). That’s 8 minutes slower than NASA Voyager results from the early 1980s, and slower than previous estimates from another Cassini instrument. The magnetometer results provide the best estimate of the Saturn day to date, because it can see deep inside Saturn. These Cassini results are in the May 4 issue of the journal Nature.

“Measuring the rotation period of a rocky planet like Earth is easy, but measurements for planets made of gas, such as Saturn, pose problems,” said the lead author of the paper, Dr. Giacomo Giampieri, a researcher at NASA’s Jet Propulsion Laboratory, Pasadena, Calif.

Planets rotate around their “spin” axes as they orbit about the sun. Rocky planets like Earth and Mars have rotation periods that are easy to measure because we can see surface features as they go by, such as the continents as viewed from space. Gaseous planets do not have a solid surface to track.

The magnetic field is generated deep inside Saturn’s liquid metallic core by flowing electric currents. By measuring the field, researchers can determine the length of the day on Saturn.

“Making this measurement has been one of the most important science goals for the mission,” said Professor Michele Dougherty of Imperial College London. “Finding a distinct periodic rhythm in the magnetic field helps us understand the internal structure of Saturn that in turn will help us understand how it formed.”

Knowing the length of a day or how fast the planet rotates is critical to understanding the internal structure of the planet and modelling the weather patterns on Saturn.

On approach to Saturn, Cassini’s radio and plasma wave instrument measured radio signals and predicted that the day on Saturn was 10 hours, 45 minutes, 45 seconds. That was considered a very good estimate at the time.

Since the Voyager days scientists have been seeing changes in the period of radio observations. They knew that it was virtually impossible to slow down or speed up a mass as large as Saturn. As Cassini’s measurements of the rhythms of natural radio signals from the planet continued to vary, scientists began to realize these signals were probably not a direct measurement of the internal rotation rate. Suddenly the length of Saturn’s day became uncertain. Measurements of the magnetic field help scientists “see” deep inside Saturn and may have finally solved this puzzle.

“Our magnetic field measurements have remained constant since Cassini entered orbit almost two years ago, while radio measurements since the Voyager era have shown large variability. By monitoring the magnetic field over the rest of the mission, we will be able to solve this puzzle,” Giampieri.

In addition to Giampieri the other authors are: Michele Dougherty, from Imperial College, London; Edward Smith also from JPL; and Christopher Russell from the University of California, Los Angeles.

The Cassini-Huygens mission is a cooperative project of NASA, the European Space Agency and the Italian Space Agency. The Jet Propulsion Laboratory, a division of the California Institute of Technology in Pasadena, manages the Cassini-Huygens mission for NASA’s Science Mission Directorate, Washington. The Cassini orbiter was designed, developed and assembled at JPL. The magnetometer team is based at Imperial College in London, working with team members from the United States and several European countries.

For images and more information, visit: http://www.nasa.gov/cassini and http://saturn.jpl.nasa.gov.

Original Source: NASA News Release

Huygens Landing Movie

Titan’s surface. Image credit: ESA. Click to enlarge
Researchers from NASA, ESA and the University of Arizona have put together a new animation that shows what the Huygens probe saw as it landed on Titan on January 14, 2005. The 5-minute video was put together with data collected by Huygen’s Descent Imager/Spectral Radiometer instrument. The scene below the lander is a mosaic, updated piece by piece as the instrument captured new images.

New views of the most distant touchdown ever made by a spacecraft are being released today by NASA, the European Space Agency and the University of Arizona. The movies show the dramatic descent of the Huygens probe to the surface of Saturn’s moon Titan on Jan. 14, 2005.

The movies were put together with data collected by the Descent Imager/Spectral Radiometer instrument during the probe’s 147-minute plunge through Titan’s thick orange-brown atmosphere to a soft sandy riverbed. The Descent Imager/Spectral Radiometer was funded by NASA.

The data were analyzed for months after the landing and represent the best visual product obtained from the Huygens mission. It is the most realistic way yet to experience the Huygens probe landing. The movie “View from Huygens on Jan. 14, 2005,” provides in 4 minutes and 40 seconds of what the probe actually “saw” during the 2.5 hours of the descent and touchdown.

“At first, the Huygens camera just saw fog over the distant surface,” said Erich Karkoschka, team member at the University of Arizona, Tucson, and creator of the movies. “The fog started to clear only at about 60 kilometers [37 miles] altitude, making it possible to resolve surface features as large as 100 meters [328 feet],” he said. “But only after landing could the probe’s camera resolve little grains of sand millions and millions of times smaller than Titan. A movie is a perfect medium to show such a huge change of scale.”

For the second movie, scientists used artistic license and added sound to represent the different data sets collected. They re-created a scientifically accurate representation of the mission life in less than five minutes.

“These movies really demonstrate that the Huygens camera was very well designed for the job,” said Jean-Pierre Lebreton, Huygens project scientist and mission manager at the European Space Agency. “They show so many different details of a landscape that covers only a tiny fraction — one-thousandth — of Titan’s surface. This makes me dream of what a possible future mission to Titan may return of this wonderful and fascinating Earth-like world,” he said.

The Huygens probe was delivered to Saturn’s moon Titan by the Cassini spacecraft, which is managed by NASA’s Jet Propulsion Laboratory, Pasadena, Calif. NASA supplied two instruments on the probe, the Descent Imager/Spectral Radiometer and the Gas Chromatograph Mass Spectrometer.

The Cassini spacecraft continues orbiting Saturn in its second year of its four-year tour. Cassini’s next Titan flyby is on May 20, 2006. Twenty-two flybys of Titan are planned this year by Cassini, with 45 total flybys of Titan in the full tour.

The new movies and images are available at: http://saturn.jpl.nasa.gov, http://www.nasa.gov/cassini, http://saturn.esa.int and http://www.lpl.arizona.edu/DISR/.

The Cassini-Huygens mission to Saturn and Titan is a joint mission of NASA, the European Space Agency and the Italian Space Agency. ESA supplied and manages the Huygens probe that descended to Titan’s surface. NASA’s Jet Propulsion Laboratory, a division of the California Institute of Technology in Pasadena, manages the mission for NASA’s Science Mission Directorate in Washington. NASA funded the Descent Imager/Spectral Radiometer, which was built by Lockheed Martin. University of Arizona Lunar and Planetary Laboratory scientist Martin Tomasko leads the Descent Imager/Spectral Radiometer team. Team members are based throughout the United States and Europe.

Original Source: NASA/JPL/SSI News Release

Jupiter Will Be Closest on May 6th

Jupiter and its moon Ganymede. Image credit: Alan Friedman. Click to enlarge
Look east in the early evening and you’ll see a very bright star. Well, that’s not a star, it’s Jupiter – and now’s the best time to go take a look at it. Jupiter will reach its closest approach to the Earth on May 6th. Even in small backyard telescopes, many features of the planet are visible, including its bands and 4 larger moons. If you’ve got a larger telescope, you might be able to pick out the newly formed storm dubbed “Red Spot Jr.”.

If you feel the urge to look up at the sky this month, you might be feeling the pull of Jupiter.

The giant planet is having a close encounter with Earth all month long. On May 6th, the date of closest approach, Jupiter will be 410 million miles away, which is almost 200 million miles closer than it was just six months ago in October. This makes Jupiter unusually big and bright.

Look for it rising in the east at sunset. Jupiter is unmistakable, shining ten times brighter than any star around it. The view through a backyard telescope is dynamite. You can see Jupiter’s cloud belts, the Great Red Spot and four large moons (Io, Europa, Ganymede and Callisto) circling the planet.

When you look at Jupiter through a telescope, you might notice something odd: the planet looks squashed. Your eyes are okay. Jupiter truly bulges around the middle because it spins so fast. One complete turn of the planet takes only 10 hours. That’s more than 300 Earth masses (almost enough to make a star) spinning like a nimble asteroid.

This spinning allows you to see the entire planet in a single night. On May 6th, Jupiter is “up” for more than 10 hours, or one complete turn. Judo astronomers will attempt a Jupiter marathon: In 10 hours you can see the innermost moons of Jupiter move from one side of the planet to the other. You can watch the Great Red Spot, a hurricane twice as wide as Earth, churn across Jupiter’s cloudtops. You might even see “Red Jr.,” a baby Great Red Spot trailing the original by about 2 hours: full story.

Although closest approach is May 6th, the best night to look is May 11th when the full Moon and Jupiter appear side by side. The pair will rise in tandem at sunset and remain beautifully close together all night long. With a telescope you can quickly scan back and forth: The lunar Alps. The moons of Jupiter. The Sea of Tranquillity. The Great Red Spot.

This is a sky map.

Do you feel the pull yet?

Let’s calculate: Jupiter is 318 times more massive than Earth and 410 million miles away. According to Newton’s Law of Universal Gravitation, Jupiter pulls you up 34 million times less than Earth pulls you down. Jupiter’s “pull” is utterly feeble.

So it’s all in your mind. But don’t let that stop you: give in to the pull!

Original Source: NASA News Release

Companion Star Changed Supernova’s Appearance

The Galaxy NGC 7424 as imaged by Gemini. Image credit: Gemini South GMOS. Click to enlarge
When a supernova was discovered in December 2001, astronomers immediately tagged it as a Type II – when a gigantic star runs out of fuel and explodes. But then the tell tale hydrogen surrounding it disappeared, and astronomers had to re-classify it as a Type I supernova – when a white dwarf steals matter from a companion. Astronomers using the Gemini telescope in Chile think they’ve solved the mystery. They found a companion star left behind when the supernova exploded; this was providing the hydrogen, and masking the original supernova.

Using the Gemini South telescope in Chile, Australian astronomers have found a predicted “companion” star left behind when its partner exploded as a very unusual supernova. The presence of the companion explains why the supernova, which started off looking like one kind of exploding star, seemed to change its identity after a few weeks.

The Gemini observations were originally intended to be reconnaissance for later imaging with the Hubble Space Telescope. “But the Gemini data were so good we got our answer straight away,” said lead investigator, Dr. Stuart Ryder of the Anglo-Australian Observatory (AAO).

Renowned Australian supernova hunter Bob Evans first spotted supernova 2001ig in December 2001. It lies in the outskirts of a spiral galaxy NGC 7424, which is about 37 million light-years away in the southern constellation of Grus (the Crane).

The supernova was monitored over the next month by optical telescopes in Chile. Supernovae are classified according to the features in their optical spectra. SN2001ig initially showed the telltale signs of hydrogen, which had it tagged as a Type II supernova, but the hydrogen later disappeared, which put it into the Type I category.

But how could a supernova change its type? Only a handful of such supernovae, classified as “Type IIb” to indicate their curious change of identity, have ever been seen. Only one (called SN 1993J) was closer than SN 2001ig.

Astronomers studying SN1993J had suggested an explanation: the supernova’s progenitor had a companion star that stripped material off the star before it exploded. This would leave only a little hydrogen on the progenitor-so little that it could disappear from the supernova spectrum within a few weeks.

A decade later observations with the orbiting Hubble Space Telescope and one of the Keck telescopes in Hawaii confirmed that SN 1993J did indeed have a companion. Ryder and colleagues wondered if SN2001ig might have had a companion as well.

Soon after SN2001ig was discovered, Ryder and his colleagues began monitoring it with a radio telescope, the CSIRO (Commonwealth Scientific and Industrial Research Organisation) Australia Telescope Compact Array in eastern Australia. The radio emission did not fall off smoothly over time but instead showed regular bumps and dips. This suggested that the material in space around the star that exploded-which must have been shed late in its life-was unusually lumpy.

Although the lumps might have represented matter periodically shed from the convulsing star, their spacing was such that another explanation seemed more likely: that they were generated by a companion in an eccentric orbit. As it orbited, the companion would have swept material shed by the progenitor into a spiral (pinwheel) pattern, with denser lumps at the point in the orbit-periastron-where the two stars approached most closely.

Such spirals have been imaged around hot, massive stars called Wolf-Rayet stars by Dr Peter Tuthill of the University of Sydney, using the Keck telescopes. The bumps in the radio light-curve of SN2001ig were spaced in a way consistent with the curvature of one of the spirals Tuthill has imaged.

“Stellar evolution theory suggests that a Wolf-Rayet star with a massive companion could produce this unusual kind of supernova,” said Ryder.

If the supernova progenitor had a companion, it might be visible when the supernova debris had cleared. So the astronomers put in a request to observe with the GMOS (Gemini Multi-Object Spectrograph) camera on the 8-meter Gemini South telescope.

When the time came to observe, the “seeing conditions” (stability of the atmosphere) were excellent. Just an hour and a half was needed to image the supernova field-and reveal a yellow-green point-like object at the location of the supernova explosion.

“We believe this is the companion,” said Ryder. “It’s too red to be a patch of ionized hydrogen, and too blue to be part of the supernova remnant itself.”

The companion has a mass of between 10 and 18 times that of the Sun. The astronomers hope to use GMOS again in coming months to get a spectrum of the companion, to refine this estimate.

Binary companions could explain much of the diversity seen in supernovae, Ryder suggests. “We’ve been able to show the chameleon-like behaviour of SN2001ig has a surprisingly simple explanation,” he said.

This is only the second time a companion star to a Type IIb supernova has been imaged, and the first time the imaging has been done from the ground.

A paper on the observations, “A post-mortem investigation of the Type IIb supernova 2001ig”, co-authored by Ryder, University of Tasmania graduate student Clair Murrowood and former AAO astronomer Dr Raylee Stathakis, was published online in Monthly Notices of the Royal Astronomical Society on May 2. It is also available HERE.

Original Source: Gemini Observatory

Cassini Sees New Craters on Titan

Shikoku Facula region on Titan. Image credit: NASA/JPL/SSI. Click to enlarge
Cassini recently swept past two previously unexplored regions of Titan, and returned radar images of its surface. Cassini made its flyby on April 30, targeting the Xanadu region – one of the most prominent features on Titan, which is even visible from Earth. It revealed strange curving features that could indicate flowing fluids. There are also two large craters that could be from meteor impacts or volcanic calderas. This was Cassini’s 14th Titan flyby, with the next on May 20.

Saturn’s moon Titan continued to surprise scientists during a flyby that took Cassini into regions previously unexplored by radar. Two very noticeable circular features, possible impact craters or calderas, appear in the latest radar images taken during the flyby on April 30, 2006.

The flyby targeted Xanadu, one of the most prominent features on Titan, visible even from telescopes on Earth. The origin of Xanadu is still unknown, but the radar images reveal details previously unseen, such as numerous curvy features that may indicate fluid flows. Scientists speculate that two prominent circular features are probably impact craters but they don’t rule out the possibility that they might be calderas or volcanoes. Sand dunes, discovered in previous flybys, continue to crisscross Titan’s surface.

Communication from the spacecraft was temporarily interrupted for nearly five hours during the data playback following the flyby. The most important science data from the flyby were protected by a contingency plan put in place in advance of the flyby. The flight team believes the outage was likely due to a galactic cosmic-ray hit on a power switch in the spacecraft communications subsystem. The anomaly resulted in the loss of some science data. However, the spacecraft is now performing normally.

This was the 14th Titan flyby for Cassini, with nine more remaining this year. The next will be May 20, 2006. During the nominal four-year mission Cassini will perform 45 Titan flybys.

The Cassini-Huygens mission is a cooperative project of NASA, the European Space Agency and the Italian Space Agency. JPL, a division of Caltech, manages the mission for NASA’s Science Mission Directorate. The Cassini orbiter was designed, developed and assembled at JPL.

For images and more information, visit: http://www.nasa.gov/cassini and http://saturn.jpl.nasa.gov .

Original Source: NASA/JPL/SSI News Release

Book Review: Galaxy Formation and Evolution


Digital cameras are all the rage today, but one that’s limited to a 12 by 12 array isn’t going to carry much weight. Such slight detail prevents distinguishing people’s faces or much else. Yet as Hyron Spinrad describes in his book Galaxy Formation and Evolution, often this is the broadest amount of information available for whole galaxies. In spite of this, he shows that there’s no shortage of interpretations, even with such slight references.

Our solar system lies in an adjunct arm of the Milky Way galaxy. Our galaxy spans many light years in all directions and not long ago it was thought to define the limits to our universe. Thanks to better instrumentation and advances in the knowledge of physics, we know that our galaxy is one of countless others that expand to no known limit in extent. As far as we see, galaxies in a myriad of shapes sprinkle the darkness between stars. But with humankind’s aptitude for classification, we’ve been busy searching for and sorting galaxies as they make themselves known. Using Hubble’s tuning fork diagram, galactic emission lines, and our understanding of nucleosynthesis, we can group galaxies and postulate their evolution. That is, having seen the beginning of time via COBE and WMAP, we can guess on the sequence of events that led to the night skies we see today.

Spinrad’s aim in his book is to summarize recent discoveries and physically-based theories for the research professional or learned amateur. As such he delivers. He starts with an assessment of nearby galaxies. From these, he sets expectations on size, shape, speed and emission types and rate. Then, from a copious selection of papers and presentations, he extends the review to the farther reaches. Reciting a potpourri of techniques and tricks, he presents the works of many other researchers. Each section of each chapter takes a new look at the challenge. From baryon density to the Lyman alpha optical depth to the luminosity of active galactic nuclei, he considers how measurements and expectations combine together to build a plausible galactic morphology.

This book is not for the scientific faint of heart. It has a wealth of detailed information written with the assumption that the reader has strong knowledge of the field. Classifications are key and most seem to consider results from statistical binning. Often the statistics is based upon little data, whether images are 12 by 12 pixels or only ten’s of images appear for a given z redshift value. Thus, Spinrad makes judicious use of the word ‘probably’. But building on experience and using the results of ever more detailed sky surveys by ever more capable instruments he shows how a certain sense or rhythm occurred as high density regions evolved into stars, galaxies and clusters. As well, from this we can see where we in the Milky Way Galaxy are heading to.

Spinrad does bring a broad range of detail into the question of galactic formation, but his book isn’t smooth. Reading it is like reading conference proceedings; the topics are relevant but a storyline is missing. All his references come from recognized astronomy journals and most referrals are to editions from within the previous six years. This lends the belief that the content is recent, applicable and valid. Perhaps the targeted research professional would find this book of value, but it’s hard to see how it adds to the information already presented in the journals.

The expectations of the reader’s knowledge also quickly becomes apparent. Acronym’s abound but no ready list aids the reader to recover their meaning. Equations are sprinkled throughout but are seldom used or explored. Further, with a few striking editorial errors and an index that is on occasion incorrect, the book gives the impression of having been rushed to publication. In a sense, it is more like a collection of review notes that the author made and then quickly submitted to the publisher perhaps in the hopes of besting others. If the reader is looking for a particular viewpoint of this data, this book would be of value, but don’t expect a detached, well planned perspective.

Astronomy is a demanding research field. Instrumentation from all over the Earth’s surface and positioned high above our planet detect the slight emissions from far away sources. Hyron Spinrad in his book Galaxy Formation and Evolution summarizes much of the current work of scientists who analyze the received data and then use results to piece together likely processes. Though far away, the galaxies in our universe are becoming clearer.

Review by Mark Mortimer

Read more reviews online or purchase a copy from Amazon.com

XMM-Newton Finds Objects in its Spare Time

XMM-Newton slew survey of the Vela supernova remnant. Image credit: ESA. Click to enlarge
For most of its time, ESA’s XMM-Newton observatory is staring intently at a single object. But astronomers have figured out how to use the time the observatory spends turning from object to object – called “slewing”. Over the past 4 years, the observatory has actually imaged 25% of the sky in this way. A newly released sky survey contains this “spare time” data, which includes thousands of objects, many of which were previously unknown.

For the past four years, while ESA’s XMM-Newton X-ray observatory has been slewing between different targets ready for the next observation, it has kept its cameras open and used this spare time to quietly look at the heavens. The result is a ‘free-of-charge’ mission spin-off ? a survey that has now covered an impressive 25 percent of the sky.

The rapid slewing of the satellite across the sky means that a star or a galaxy passes in the field of view of the telescope for ten seconds only. However, the great collecting area of the XMM-Newton mirrors, coupled with the efficiency of its image sensors, is allowing thousands of sources to be detected.

Furthermore, XMM-Newton can pinpoint the position of X-rays coming from the sky with a resolution far superior to that available for most previous all-sky surveys. This is sufficient to allow the source of these X-rays to be found in many cases.

By comparing XMM-Newton survey’s data with those obtained over a decade ago by the international ROSAT mission, which also performed an all-sky survey, scientists can now check the long-term stability, or the evolution, of about two thousand objects in the sky.

An initial look shows that some sources have changed their brightness level by an incredible amount. The most extreme of these are variable stars and more surprisingly galaxies, whose unusual volatility may be due to large quantities of matter being consumed by an otherwise dormant central black hole.

The slew survey is particularly sensitive to active galactic nuclei (AGN) – galaxies with an unusually bright nucleus ? which can be traced out to a distance of ten thousand million light years.

While most stars and galaxies look like points in the sky, about 15 percent of the sources catalogued by XMM-Newton have an extended X-ray emission. Most of these are clusters of galaxies – gigantic conglomerations of galaxies which trap hot gas that emit X-rays over scales of a million light years.

Eighty-one of these clusters are already famous from earlier work but many other clusters, previously unknown, appear in this new XMM-Newton sky catalogue.

Scientists hope that the newly detected sources of this kind also include very distant clusters which are highly luminous in X-rays, as these objects are invaluable for investigating the evolution of the Universe. Follow-up observations by large optical telescopes are now needed to determine the distances of the individual galaxies in the newly discovered clusters.

Using traditional pointed observations, it takes huge amounts of telescope-time to image very large sky features, such as old supernova remnants, in their entirety. The slewing mechanism provides a very efficient method of mapping these objects, and several have been imaged including the 20 000 year-old Vela supernova remnant, which occupies a sky area 150 times larger than the full moon.

Extraordinarily bright, low-mass X-ray binary systems of stars (called ‘LMXB’) ? either powered by matter pulled from a normal star, or exploding onto the surface of a neutron star, or being consumed by a black hole – are observed with sufficient sensitivity to record their detailed light spectrum. Passes across these intense X-ray sources can help astronomers to understand the long-term physics of the interaction between the two stars of the binary system.

Many areas of astronomy are expected to be influenced by the XMM-Newton sky survey. Today, 3 May 2006, the XMM-Newton scientist have released a part of the catalogue resulting from the initial processing of the highest quality data obtained so far.

Such data correspond to a sky coverage of about 15 percent, and include more than 2700 very bright sources and a further 2000 sources of lower significance. Currently, about 55 percent of the catalogue entries have been identified with known stars, galaxies, quasars and clusters of galaxies.

A faster turn-around of slew-data processing is now planned to catch interesting transient (or temporary) targets in the act, before they have a chance to fade. This will give access to rare, energetic events, which only a sensitive wide-angle survey such as XMM-Newton’s can achieve.

It is planned to continually update the catalogue as XMM-Newton charts its way through the stars. This will cover at least 80 percent of the sky, leaving a tremendous legacy for the future.

Original Source: ESA Portal