What is Cherenkov Radiation?

How the CANGAROO Imaging Cherenkov Air Telescope works

Cherenkov radiation is named after the Russian physicist who first worked it out in detail, in 1934, Pavel Alekseyevich Cherenkov (he got a Nobel for his work, in 1958; because he’s Russian, it’s also sometimes called Cerenkov radiation).

Nothing’s faster than c, the speed of light … in a vacuum. In the air or water (or glass), the speed of light is slower than c. So what happens when something like a cosmic ray proton – which is moving way faster than the speed of light in air or water – hits the Earth’s atmosphere? It emits a cone of light, like the sonic boom of a supersonic plane; that light is Cherenkov radiation.

The Cherenkov radiation spectrum is continuous, and its intensity increases with frequency (up to a cutoff); that’s what gives it the eerie blue color you see in pictures of ‘swimming pool’ reactors.

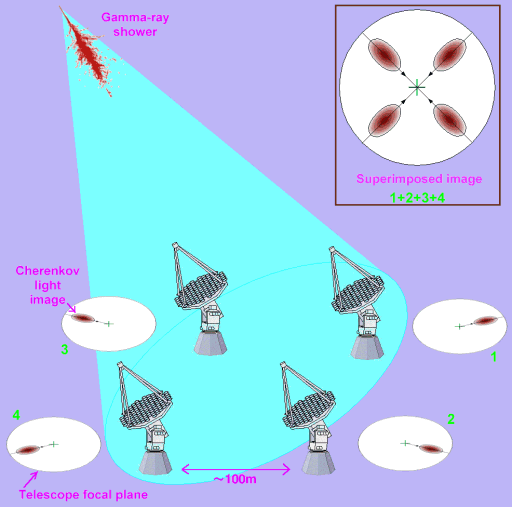
Perhaps the best known astronomical use of Cherenkov radiation is in ICATs such CANGAROO (you guessed it, it’s in Australia!), H.E.S.S. (astronomers love this sort of thing, that’s a ‘tribute’ to Victor Hess, pioneer of cosmic rays studies), and VERITAS (see if you can explain the pun in that!). As a high energy gamma ray, above a few GeV, enters the atmosphere, it creates electron-positron pairs, which initiate an air shower. The shower creates a burst of Cherenkov radiation lasting a few nanoseconds, which the ICAT detects. Because Cherenkov radiation is well-understood, the bursts caused by gamma rays can be distinguished from those caused by protons; and by using several telescopes, the source ‘on the sky’ can be pinned down much better (that’s what one of the Ss in H.E.S.S. stands for, stereoscopic).

The more energetic a cosmic ray particle, the bigger the air shower it creates … so to study really energetic cosmic rays – those with energies above 10^18 ev (which is 100 million times as energetic as what the LHC will produce), which are called UHECRs (see if you can guess) – you need cosmic ray detectors spread over a huge area. That’s just what the Pierre Auger Cosmic Ray Observatory is; and its workhorse detectors are tanks of water with photomultiplier tubes in the dark (to detect the Cherenkov radiation of air shower particles).

However I think the coolest use of Cherenkov radiation in astronomy is IceCube, which detects the Cherenkov radiation produced by muons in Antarctic ice … traveling upward. These muons are produced by rare interactions of muon neutrinos with hydrogen or oxygen nuclei (in the ice), after they have traveled through the whole Earth, from the Artic (and before that perhaps a few hundred megaparsecs from some distant blazer).

ICAT: imaging Cherenkov Air Telescope
CANGAROO: Collaboration of Australia and Nippon (Japan) for a Gamma Ray Observatory in the Outback
H.E.S.S.: High Energy Stereoscopic System
VERITAS: Very Energetic Imaging Telescope Array System
UHECR: ultra-high-energy cosmic ray

This NASA webpage gives more details of how ICATs work.

Quite a few Universe Today stories are about Cherenkov radiation; for example Astronomers Observe Bizarre Blazar with Battery of Telescopes, and High Energy Gamma Rays Go Slower Than the Speed of Light?.

Examples of Astronomy Casts which include this topic: Cosmic Rays, and Gamma Ray Astronomy.

Sources:
http://en.wikipedia.org/wiki/Cherenkov_radiation
http://abyss.uoregon.edu/~js/glossary/cerenkov_radiation.html

Composite Volcano

Mount Fuji - a composite volcano

[/caption]
Geologists have identified 3 major types of volcanoes. There’s the shield volcano, formed from low viscosity lava that can flow long distances. There are cinder cone volcanoes, which are made by the eruption of lava, ash and rocks that build up around a volcanic vent. But the last type is the composite volcano, and these are some of the most famous volcanoes (and most dangerous) in the world.

A composite volcano is formed over hundreds of thousands of years through multiple eruptions. The eruptions build up the composite volcano, layer upon layer until it towers thousands of meters tall. Some layers might be formed from lava, while others might be ash, rock and pyroclastic flows. A composite volcano can also build up large quantities of thick magma, which blocks up inside the volcano, and causes it to detonate in a volcanic explosion.

Composite volcanoes are fed by a conduit system which taps into a reservoir of magma deep within the Earth. This magma can erupt out of several vents across the composite volcano’s flanks, or from a large central crater at the summit of the volcano.

Some of the most famous volcanoes in the world are composite volcanoes. And some of the most devastating eruptions in history came from them. For example, Mount St. Helens, Mount Pinatubo, and Krakatoa are just examples of composite volcanoes that have erupted. Famous landmarks like Mount Fuji in Japan, Mount Ranier in Washington State, and Mount Kilimanjaro in Africa are composite volcanoes that just haven’t erupted recently.

When large composite volcanoes explode, they can leave behind a collapsed region called a caldera. These are deep, steep-walled depressions which marked the location of the volcano. And it’s in this region that a new composite volcano will build back up again.

Another name for composite volcanoes are stratovolcanoes.

We have written many articles about composite volcanoes for Universe Today. Here’s an article about the recent eruption of Mount Redoubt in Alaska, and here’s an article about Mount Etna.

You can learn more about composite volcanoes from the USGS.

And we have recorded an entire episode of Astronomy Cast just about volcanoes. Listen to it here, Episode 141: Volcanoes, Hot and Cold.

Barred Spiral Galaxy

A barred spiral galaxy, from the Galaxy Zoo 2 tutorial (How to Take Part)

[/caption]
As its name implies, a barred spiral galaxy is a spiral galaxy with a bar through the center.

Hubble introduced the ‘tuning fork’ scheme for describing the shapes of galaxies (“morphologies” in astronomer-speak) in 1936. In this, the two arms of the fork are barred spirals (from SBa to SBc) and spirals without bars (from Sa to Sc); the S stands for spiral, B for ‘it’s got a bar’, and a/b/c for how tightly wound the spiral arms are. This was later extended to a fourth type, SBm and Sm, for irregular barred spiral galaxies which have no bulge.

In 1959, Gérard de Vaucouleurs extended the scheme to the one perhaps the most commonly used by astronomers today (though there’ve been some mods since). In this scheme spirals without bars are SA, and those which have really weak bars are SAB; barred spirals remain SB. He also added a ‘d’ (SAd, SBd), and a few other things, like rings.

About half of spiral galaxies are barred; examples include M58 (SBc), M61 (SABbc), the Large Magellanic Cloud (LMC, Sm), … and our own Milky Way galaxy!

The bars are mostly stars (usually), unlike spiral arms (which have lots of gas and dust besides stars). The formation and evolution of bars is an active area of research in astronomy today; they seem to form from close encounters of the galaxy kind (galaxy near-collisions), funnel gas into the central bulge (where the super-massive black holes there snack on it), and are sustained by the same density waves which keep the arms alive.

Why not join the Galaxy Zoo project, and have some fun classifying spiral galaxies into whether they have bars or not (and getting to see some amazing sights too)?

Hubble Early Release Observation of Barred Spiral NGC 6217, Two Galaxies Walk Into a Bar…, and The Milky Way Has Only Two Spiral Arms; just some of the Universe Today stories on barred spiral galaxies.

Astronomy Casts featuring barred spiral galaxies include The Story of Galaxy Evolution, and Galaxies.

Satellite Map of the World

World satellite map. Image credit: NASA

There’s no better way to appreciate the planet you live on than to have a great big picture of it on your wall. Here are some ways you can get your hands on a satellite map of the world.

If you’ve got a nice printer and you’d like to save yourself some money, why not download a satellite map of the world for free from NASA. You can get free satellite images from the NASA Earth Observatory.

[/caption]

Each month NASA releases a new composite satellite image of the entire planet. This lets you track changes from month to month. You can view the full images on this page.

NASA satellite map of the Earth

You can also get a free satellite map of the world captured at night. This photo shows whole planet Earth, but now you’re seeing it at night. The bright spots are cities and populated areas. It’s easy to see the differences between 1st world countries and more developing nations.

Earth lights at night.

If you want to just buy a poster that you can put on your wall, you can find a bunch of satellite world maps from Amazon.com. Here’s a link to buy the Earth at night poster. And here’s an image of the whole Earth by day.

Hubble’s Law

velocity vs distance, from Hubble's 1929 paper

[/caption]
“The distance to objects beyond the Local Group is closely related to how fast they seem to be receding from us,” that’s Hubble’s law in a nutshell.

Edwin Hubble, the astronomer the Hubble Space Telescope is named after, first described the relationship which later bore his name in a paper in 1929; here is one of the ways he described it, in that paper: “The data in the table [of “nebulae”, i.e. galaxies] indicate a linear correlation between distances and velocities“; in numerical form, v = Hd (v is the speed at which a distant object is receding from us, d is its distance, and H is the Hubble constant).

Today the Hubble law is usually expressed as a relationship between redshift and distance, partly because redshift is what astronomers can measure directly.

Hubble’s Law, which is an empirical relationship, was the first concrete evidence that Einstein’s theory of General Relativity applied to the universe as a whole, as proposed only two years earlier by Georges Lemaître (interestingly, Lemaître’s paper also includes an estimate of the Hubble constant!); the universal applicability of General Relativity is the heart of the Big Bang theory, and the way we see the predicted expansion of space is as the speed at which things seem to be receding being proportional to their distance, i.e. Hubble’s Law.

Although other astronomers, such as Vesto Silpher, did much of the work needed to measure the galaxy redshifts, Hubble was the one who developed techniques for estimating the distance to the galaxies, and who pulled it all together to show how distance and speed were related.

Hubble’s Law is not exact; the measured redshift of some galaxies is different from what Hubble’s Law says it should be, given their distances. This is particularly noticeable for galaxy clusters, and is explained as the motion of galaxies within their local groups or clusters, due to their mutual gravitation.

Because the exact value of the Hubble constant, H, is so important in extragalactic astronomy and cosmology – it leads to an estimate of the age of the universe, helps test theories of Dark Matter and Dark Energy, and much more – a great deal of effort has gone into working it out. Today it is estimated to be 71 kilometers per second per megaparsec, plus or minus 7; this is about 21 km/sec per million light-years. What does this mean? An object a million light-years away would be receding from us at 21 km/sec; an object 10 million light-years away, 210 km/sec, etc.

Perhaps the most dramatic revision to the Hubble Law came in 1998, when two teams independently announced that they’d discovered that the rate of expansion of the universe is accelerating; the shorthand name for this observation is Dark Energy.

Harvard University’s Professor of Cosmology John Huchra maintains a webpage on the history of the Hubble constant, and this page from Ned Wright’s Cosmology Tutorial explains how the Hubble law and cosmology are related.

There are several Universe Today stories about the Hubble relationship and the Hubble constant; for example Astronomers Closing in on Dark Energy with Refined Hubble Constant, and Cosmologists Improve on Standard Candles Measurement.

And we have done some Astronomy Casts on it too, How Old is the Universe? and, How Big is the Universe?

Sources:
UT-Knoxville
NASA
Cornell Astronomy

Albedo Effect

Stains on the ice visible on this satellite image. Credit: British Antarctic Survey

Astronomers define the reflectivity of an object in space using a term called albedo. This is the amount of electromagnetic radiation that reflects away, compared to the amount that gets absorbed. A perfectly reflective surface would get an albedo score of 1, while a completely dark object would have an albedo of 0. Of course, it’s not that black and white in nature, and all objects have an albedo score that ranges between 0 and 1.

Here on Earth, the albedo effect has a significant impact on our climate. The lower the albedo, the more radiation from the Sun that gets absorbed by the planet, and temperatures will rise. If the albedo is higher, and the Earth is more reflective, more of the radiation is returned to space, and the planet cools.

An example of this albedo effect is the snow temperature feedback. When you have a snow covered area, it reflects a lot of radiation. This is why you can get terrible sunburns when you’re skiing. But then when the snow covered area warms and melts, the albedo goes down. More sunlight is absorbed in the area and the temperatures increase. Climate scientists are concerned that global warming will cause the polar ice caps to melt. With these melting caps, dark ocean water will absorb more sunlight, and contribute even more to global warming.

Earth observation satellites are constantly measuring the Earth’s albedo using a suite of sensors, and the reflectivity of the planet can actually be measured through Earthshine – light from the Earth that reflects off the Moon.

Different parts of the Earth contribute to our planet’s overall albedo in different amounts. Trees are dark and have a low albedo, so removing trees might actually increase the albedo of an area; especially regions typically covered in snow during the winter.

Clouds can reflect sunlight, but they can also trap heat warming up the planet. At any time, about half the Earth is covered by clouds so their effect is significant.

Needless to say, the albedo effect is one of the most complicated factors in climate science, and scientists are working hard to develop better models to estimate its impact in the future.

We have written many articles about the albedo effect for Universe Today. Here’s an article discussing the albedo of the Earth, and how decreasing Earthshine could be tied to global warming.

There are some great resources out on the Internet as well. Check out this article from Scientific American Frontiers, and some cool photos of different colors of ice.

We have recorded a whole episode of Astronomy Cast just about the Earth. Listen to it here, Episode 51: Earth.

Reference:
Encyclopedia of Earth

What is Sagittarius A*?

Detection of an unusually bright X-Ray flare from Sagittarius A*, a supermassive black hole in the center of the Milky Way galaxy. Credit: NASA/CXC/Stanford/I. Zhuravleva et al.

At the very heart of the Milky Way is a region known as Sagittarius A*. This region is known the be the home of a supermassive black hole with millions of times the mass of our own Sun. And with the discovery of this object, astronomers have turned up evidence that there are supermassive black holes at the centers most most spiral and elliptical galaxies.

The best observations of Sagittarius A*, using Very Long Baseline Interferometry (VLBI) radio astronomy have determined that it’s approximately 44 million km across (that’s just the distance of Mercury to the Sun). Astronomers have estimated that it contains 4.31 million solar masses.

Of course, astronomers haven’t actually seen the supermassive black hole itself. Instead, they have observed the motion of stars in the vicinity of Sagittarius A*. After 10 years of observations, astronomers detected the motion of a star that came within 17 light-hours distance from the supermassive black hole; that’s only 3 times the distance from the Sun to Pluto. Only a compact object with the mass of millions of stars would be able to make a high mass object like a star move in that trajectory.

The discovery of a supermassive black hole at the heart of the Milky Way helped astronomers puzzle out a different mystery: quasars. These are objects that shine with the brightness of millions of stars. We now know that quasars come from the radiation generated by the disks of material surrounding actively feeding supermassive black holes. Our own black hole is quiet today, but it could have been active in the past, and might be active again in the future.

Some astronomers have suggested other objects that could have the same density and gravity to explain Sagittarius A, but anything would quickly collapse down into a supermassive black hole within the lifetime of the Milky Way.

We have written many articles about Sagittarius A. Here’s an article about how the Milky Way’s black hole is sending out flares, and even more conclusive evidence after 16 years of observations.

Here’s an article from NASA back in 1996 showing how astronomers already suspected it was a supermassive black hole, and the original ESO press release announcing the discovery.

We have recorded an episode of Astronomy Cast all about the Milky Way. Give it a listen: Episode: 99 – The Milky Way

Source: Wikipedia

When Was Mars Discovered?

This full-circle view from the panoramic camera (Pancam) on NASA's Mars Exploration Rover Spirit shows the terrain surrounding the location called "Troy," where Spirit became embedded in soft soil during the spring of 2009. Credit: NASA/JPL

[/caption]
It is impossible to know the answer to ”when was Mars discovered”. It is bright enough to be seen in the night sky without binoculars or a telescope and has been documented for at least 4,000 years.

If you were to change the question a little to ”who first theorized that Mars was a planet”, then an answer can be found. Nicolaus Copernicus is the first astronomer to postulate that Mars and a few other bodies known at the time were planets. The heliocentric theory that he published in 1543 marked the first time that astronomers widely considered the possibility that the Sun was the center of the Solar System instead of the Earth.

While no one knows who first discovered Mars, we do know who made many of the discoveries about the planet. It is known that Tycho Brahe, a Danish astronomer made accurate calculations of the position of Mars as early as 1576. Johannes Kepler theorized that the orbit of Mars was elliptical in contradiction to what astronomers believed at the time. He soon expanded that theory to encompass all planets. In 1659, Christian Huygens, a Dutch astronomer drew Mars with the observations he made using a telescope he designed himself. He also discovered a strange feature on the planet that became known as Syrtis Major.

On November 28, 1964, Mariner 4 was launched successfully on an eight-month voyage to the Red Planet. It made its first flyby on July 14, 1965, collecting the first close-up photographs of another planet. The pictures showed many impact craters, some of them touched with frost in the chill Martian evening. The Mariner 4 spacecraft was able to function for about three years in solar orbit, continuing long-term studies of the solar wind environment and making coordinated measurements with Mariner 5.

There are currently six spacecraft in orbit around Mars or on its surface and several more are in the planning or design stages. Five are gathering data at an amazing rate, the other(Phoenix) is non-functioning. New discoveries like subsurface water ice and methane plumes in the atmosphere are being made on a regular basis. Scientists may not be able to give an answer to ”when was Mars discovered”, but they can offer answers to thousands of other questions and the list is growing as we speak.

We have written many articles about the study of Mars. Here an article about how methane is being produced on Mars, and the possible discovery of life on Mars.

Here are some additional articles about the early observations of Mars, and here’s a whole book about observing Mars.

We have recorded an entire episode of Astronomy Cast about the planet Mars. Listen to it here, Episode 52: Mars.

Source: NASA

K-T Boundary

Chicxulub Crater

[/caption]
What killed the dinosaurs? That’s a question that has puzzled paleontologists since dinosaurs were first discovered. Maybe the global climate changed, maybe they were killed by disease, volcanoes, or the rise of mammals. But in the last few decades, a new theory has arisen; an asteroid strike millions of years ago drastically changed the Earth’s environment. It was this event that pushed the dinosaurs over the edge into extinction. What’s the evidence for this asteroid impact? A thin dark line found in layers of sediment around the world; evidence that something devastating happened to the planet 65 million years ago. This line is known as the K-T boundary.

What is the K-T boundary? K is actually the traditional abbreviation for the Cretaceous period, and T is the abbreviation for the Tertiary period. So the K-T boundary is the point in between the Cretaceous and Tertiary periods. Geologists have dated this period to about 65.5 million years ago.

When physicist Luis Alvarez and geologist Walter Alvarez studied the K-T boundary around the world, they found that it had a much higher concentration of iridium than normal – between 30-130 times the amount of iridium you would expect. Iridium is rare on Earth because it sank down into the center of the planet as it formed, but iridium can still be found in large concentrations in asteroids. When they compared the concentrations of iridium in the K-T boundary, they found it matched the levels found in meteorites.

The researchers were even able to estimate what kind of asteroid must have impacted the Earth 65.5 million years ago to throw up such a consistent layer of debris around the entire planet. They estimated that the impactor must have been about 10 km in diameter, and release the energy equivalent of 100 trillion tons of TNT.

When that asteroid struck the Earth 65.5 million years ago, it destroyed a region thousands of kilometers across, but also threw up a dust cloud that obscured sunlight for years. That blocked photosynthesis in plants – the base of the food chain – and eventually starved out the dinosaurs.

Researchers now think that the asteroid strike that created the K-T boundary was probably the Chicxulub Crater. This is a massive impact crater buried under Chicxulub on the coast of Yucatan, Mexico. The crater measures 180 kilometers across, and occurred about 65 million years ago.

Geologists aren’t completely in agreement about the connection between the Chicxulub impact and the extinction of the dinosaurs. Some believe that other catastrophic events might have helped push the dinosaurs over the edge, such as massive volcanism, or a series of impact events.

We have written many articles about the K-T boundary for Universe Today. Here’s an article about how the dinosaurs probably weren’t wiped out by a single asteroid, and here’s an article about how asteroids and volcanoes might have done the trick.

Here’s more information from the USGS, and an article from NASA.

We have recorded an episode of Astronomy Cast all about asteroid impacts. Listen to it here: Episode 29: Asteroids Make Bad Neighbors.

Reference:
USGS

How Long is a Light Year?

This visible-light image shows the galaxy dubbed UGC 3789, which is 160 million light-years from Earth. Credit: STScI

A light year is the distance light can travel in vacuum in one year’s time. This distance is equivalent to roughly 9,461,000,000,000 km or 5,878,000,000,000 miles. This is such a large distance. For comparison, consider the circumference of the Earth when measured at the equator: 40,075 km.

You can even throw in the center to center distance between the Earth and the Moon, 384,403 km, and that value would still pale in comparison to 1 light year. Pluto, at its farthest orbit distance from the Sun, is only about 7,400,000,000 km from the center of our Solar System.

Because of its great scale, the light year is one of the units of distance used for astronomical objects. For example, Andromeda Galaxy, which is the nearest spiral galaxy from the Milky Way, is approximately 2.5 million light years away. Alpha Centauri, the nearest star system from our own Solar System is only 4.37 light years away.

Imagine using miles or kilometers when describing the diameter of the Milky Way Galaxy, some 100,000 light years. Expressed in km or mi in expanded notation, that could occupy a lot of space on this page. Just look at the first paragraph, wherein we described 1 light year, to see what I mean. Of course, one may argue that we can still use scientific notation. But well, some people easily get daunted by the mere sight of exponents.

Although the light year has a more familiar ring to us, having perhaps heard about it quite often in sci-fi films or in magazines, it is not the most widely used unit of distance in astrometry, the branch of astronomy that deals with measurements and positions of celestial bodies. That assignment is given to the parsec. 1 parsec is approximately equal to 3.26 light years.

Another commonly used unit of distance is the astronomical unit or AU, wherein 1 AU is the average distance between the Earth and the Sun, and is roughly equivalent to 150,000,000 km. It is normally used when describing distances within the Milky Way.

Always remember that the ‘year’ we have been referring to here is not based in the internationally-accepted Gregorian Calendar. Instead, ‘year’ here refers to the Julian year. 1 Julian year is equivalent to 365.25 days or 31,557,600 seconds. The Julian calendar does not designate dates, hence is different from the Gregorian Calendar.

We have some related articles here in Universe Today. Here are the links:

Here are the links of two more articles from NASA:

Here are two episodes at Astronomy Cast that you might want to check out as well:

Source: NASA