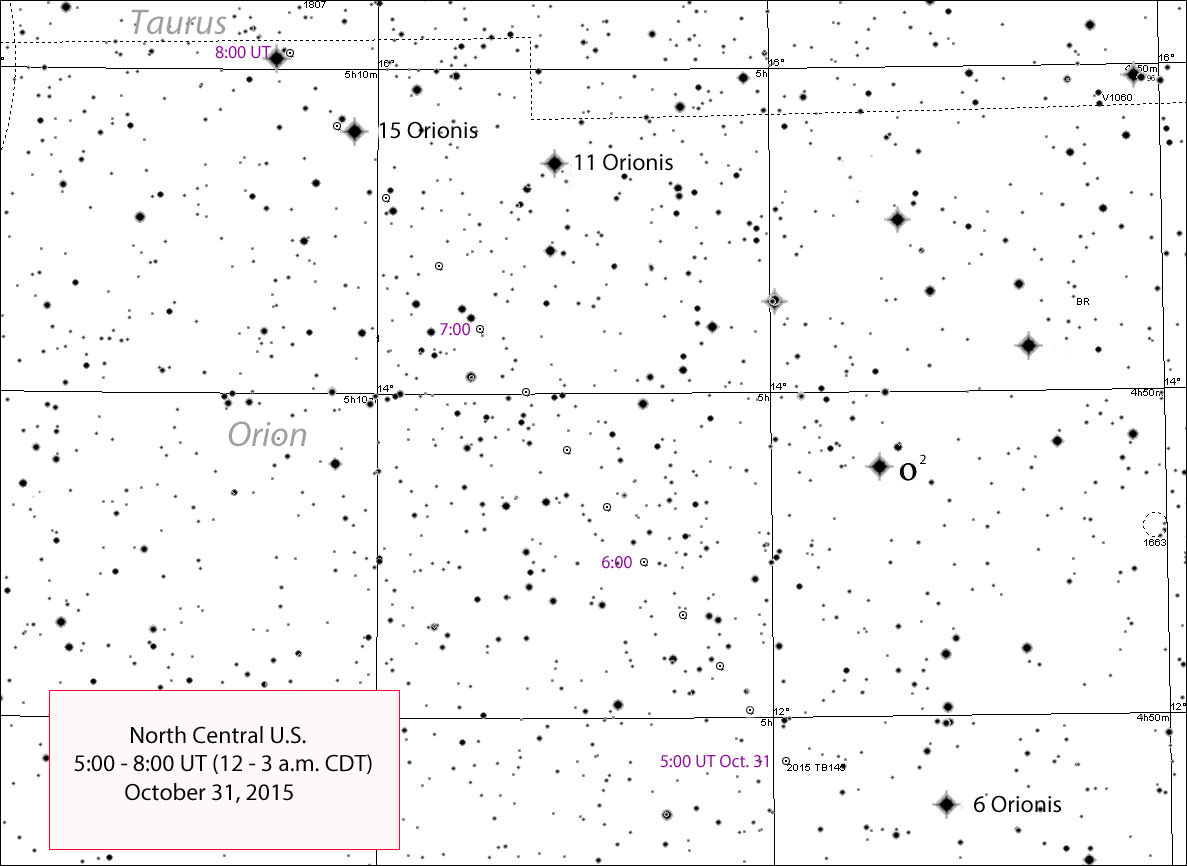
Map showing TB145's position for an observer in the north central U.S. at 15-minute intervals starting at 5:00 UT. Subtract 4 hours from UT for EDT, 5 hours for CDT, 6 for MDT and 7 for PDT. Stars are shown to magnitude +12 and north is up. Credit: Chris Marriott's SkyMap
This simulation by Tom Ruen shows the trajectory of 2015 TB145 across the sky, showing tracer spheres spaced at one hour intervals along its path.
Halloween fireballs, a Supermoon and now a near-Earth asteroid flyby. What a week! While 2015 TB145 won’t be visible in binoculars because of its relative faintness and glare from a nearby waning gibbous Moon, you should be able to see it in an 8-inch telescope or larger telescope without too much difficulty.
Determined amateurs might even catch it in instruments as small as 4.5 inches especially tomorrow morning when the fleeing space mountain will brighten to around magnitude +10.
For western hemisphere observers, TB145 begins the evening in Orion’s Shield not far below the Hyades Cluster looking like a magnitude +11.5 star crawling northeast through the star field. By dawn on Halloween, it will top out around magnitude +10.2 as it zips through Taurus and Auriga traveling around 3-5° per hour depending on the time you look. For most of the night, TB145 will move swiftly enough to notice its motion in real time, resembling an Earth-orbiting satellite. Closest approach occurs around 17:00 UT (noon CDT) when it pass along bottom of the Big Dipper Bowl at around 10° hour. Amazing!
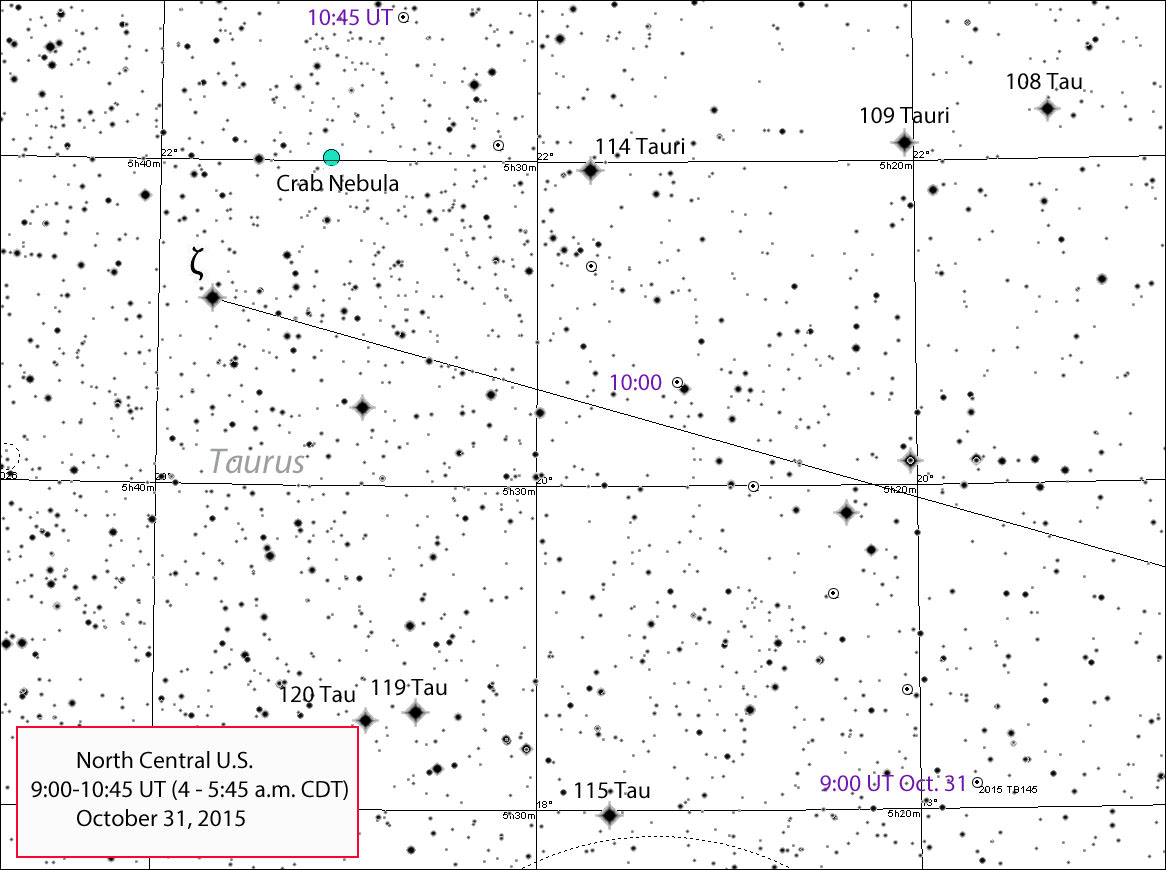
Map showing the asteroid’s progress across the horns of Taurus from 9-10:45 UT (4 – 5:45 a.m.) October 31st. It passes about 1° northwest of the Crab Nebula around 10:30 UT. Credit: Chris Marriott’s SkyMap
My hope is that these maps will help you spot and follow this zippy, aircraft carrier-sized boulder. Three of the four maps cover most of the time between 5:00 and 11:45 UT, equivalent to midnight CDT tonight to 6:45 a.m. tomorrow morning. I used the very latest orbital elements and hand plotted the positions (a tedious exercise but worth it!) at 15-minute intervals. For convenience, when you print them out, I’d suggest using a straight edge to draw a line connecting the position dots.
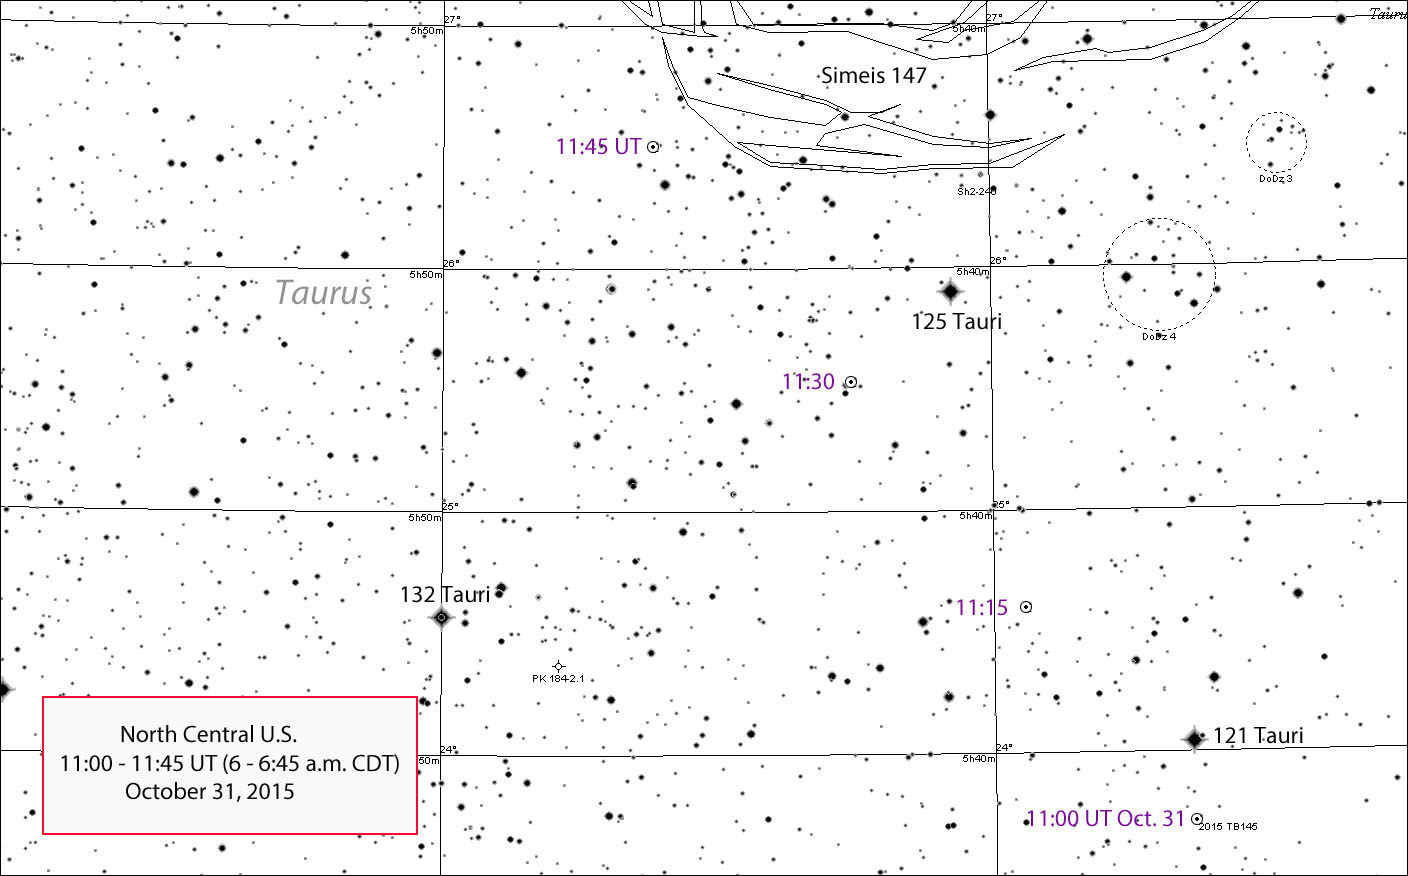
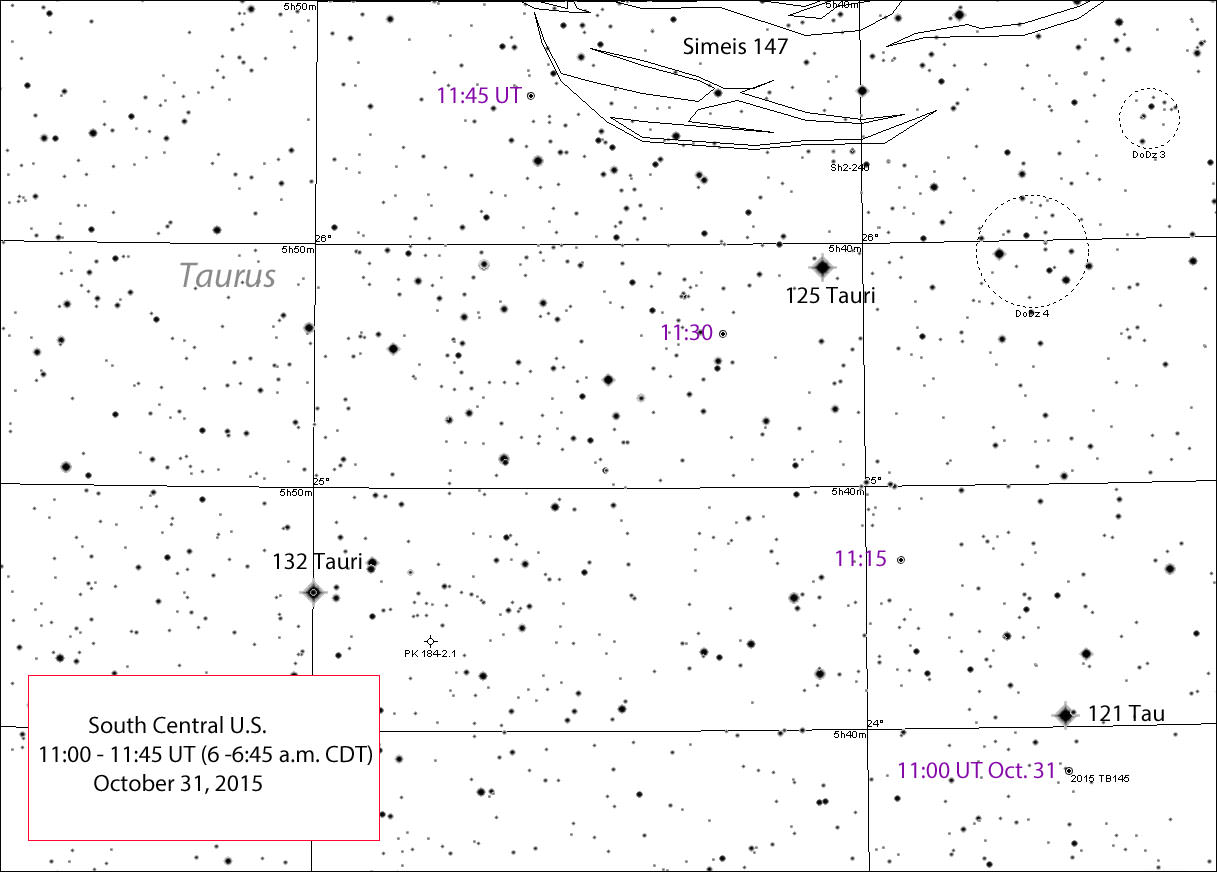
As we discussed in the previous Universe Today story, parallax comes into play when viewing any nearby Solar System object. Three of the maps show the asteroid’s position from the North Central U.S. One depicts the view from the South Central U.S. from 11-11:45 UT. Parallax is minor early on from midnight to 2 or 3 a.m. but becomes more significant near closest approach. This is based on comparisons I made between latitudes 47°-32° North.
By this time, TB145 will be around magnitude +10.4 and easier to see than at the start our run. The map covers the time from 11-11:45 UT (6 – 6:45 a.m. CDT). Credit: Chris Marriott’s SkyMap
I apologize for the limited number of maps in this article but hope these and the do-it-yourself approach described in the earlier article will be enough to set you on TB145’s trail.
The view from the southern U.S. (about 32° latitude) from 11-11:45 UT. Compared to the northern U.S., the asteroid’s path lies about 5 arc minutes further to the north. Credit: Chris Marriott’s SkyMap
As always when trying to spot asteroids on the move, pick a time and camp out at that spot with your telescope five minutes before the expected arrival time. Take the time to casually memorize the star patterns, so when the interloper arrives, you’ll pick it out straightaway. Again, depending on your location both east-west and north-south of the paths charted, TB145 may arrive a couple minutes earlier or later, but once you spot it, hold on tight. You’ll be going on a most exciting ride!
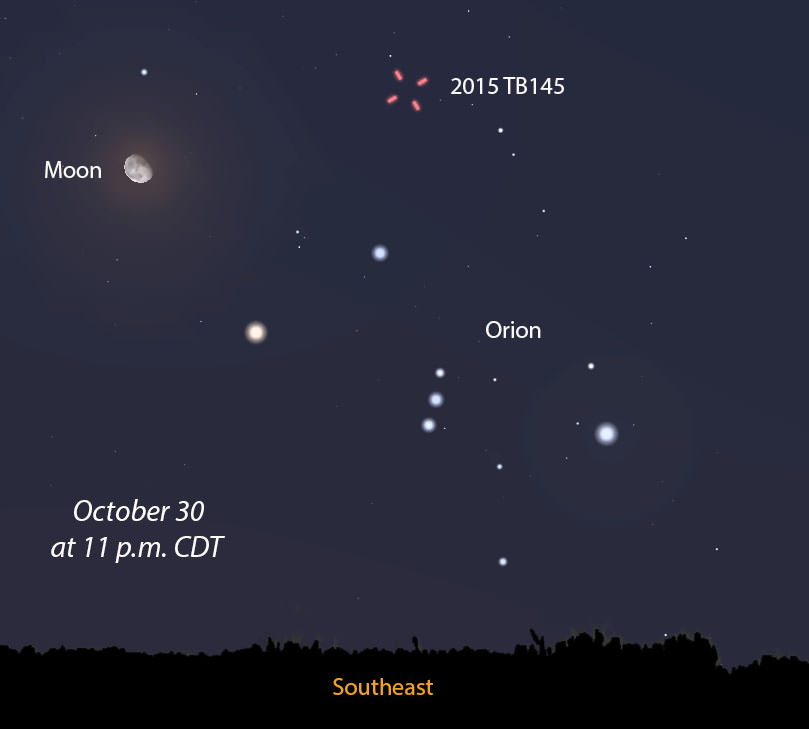
Map showing TB145’s approximate path starting at 4 hours UT on Oct. 31 (11 p.m. CDT Oct. 30). This view faces east. Tick marks show its hourly position. This map provides context for the detailed maps above. Credit: Chris Marriott’s SkyMap
We’d love to hear from you whether or not you were successful seeing it. If the weather’s uncooperative or you don’t have a telescope, Gianluca Masi’s got your back. He’ll webcast the flyby live on his Virtual Telescope site starting at 7 p.m. CDT (0:00 UT) tonight Oct. 30-31.
Now let’s see the flyby of Earth from the asteroid’s point of view, also by Tom Ruen. Enjoy!
Map showing TB145's approximate path starting at 4 hours UT on Oct. 31 (11 p.m. CDT Oct. 30). This view faces east. Tick marks show its hourly position. This map provides context for the detailed maps above. Credit: Chris Marriott's SkyMap
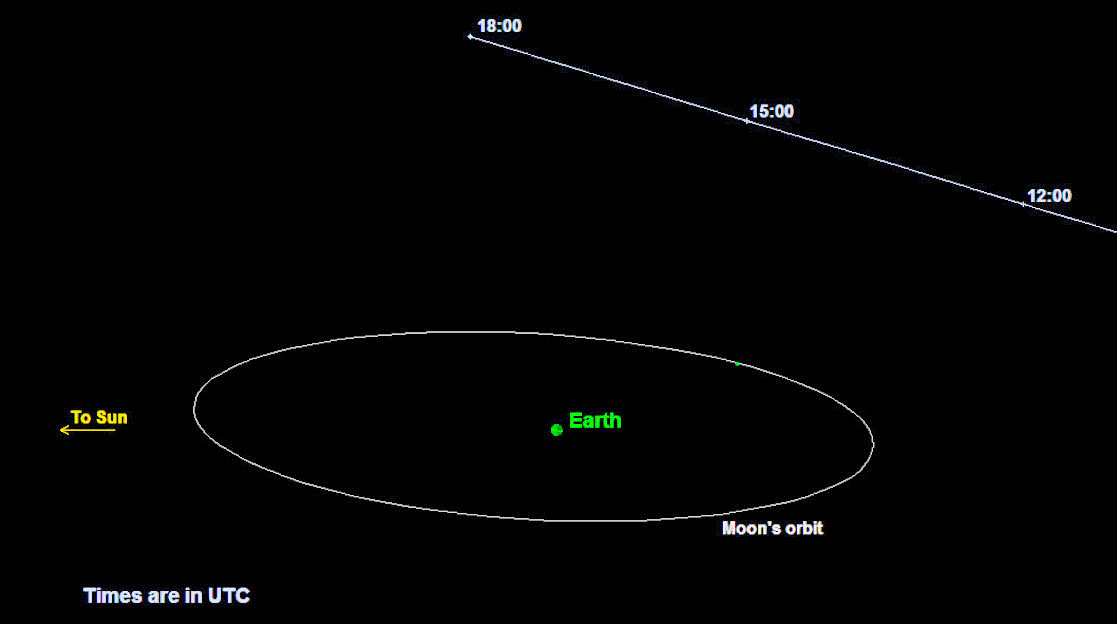
Trick or treat! I think we’re definitely in for a treat. 2015 TB145 will fly past Earth at a safe distance slightly farther than the moon’s orbit on Oct. 31 at 12:05 p.m. CDT (17:05 UT). Estimated at 1,300 feet (400-meters) across, this Great Pumpkin of an asteroid will be big enough and close enough to show in small telescopes.
Do I hear the doorbell ringing already?
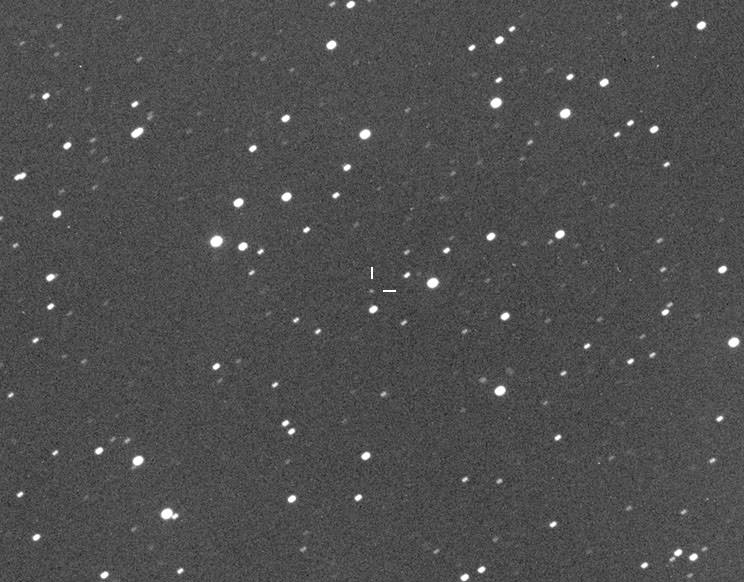
Shining faintly at 18th magnitude on October 22, 2015 TB145 is already under study by amateur and professional astronomers. Its close approach will make for an excellent opportunity to learn a great deal about its surface properties and orbit. Watch for it to brighten up to magnitude +10.1 at peak, bright enough to see in a 4.5-inch telescope. Credit: Gianluca Masi
The close approach of such of TB145 will make for great science opportunities, too. Several optical observatories and the radar capabilities of the agency’s Deep Space Network at Goldstone, California will be tracking this flying mountain as will many amateur astronomers. The 110-foot (34-meter) Goldstone antenna will ping the asteroid with radio waves; the returning echoes will be collected by dishes in West Virginia and Puerto Rico and used to construct images showing the object’s surface features, shape and dimensions. NASA scientists hope to obtain radar images of the asteroid as fine as about 7 feet (2 meters) per pixel.
“The close approach of 2015 TB145 at about 1.3 times the distance of the moon’s orbit, coupled with its size, suggests it will be one of the best asteroids for radar imaging we’ll see for several years,” said Lance Benner, of JPL, who leads NASA’s asteroid radar research program. “We plan to test a new capability to obtain radar images with two-meter resolution for the first time and hope to see unprecedented levels of detail.”
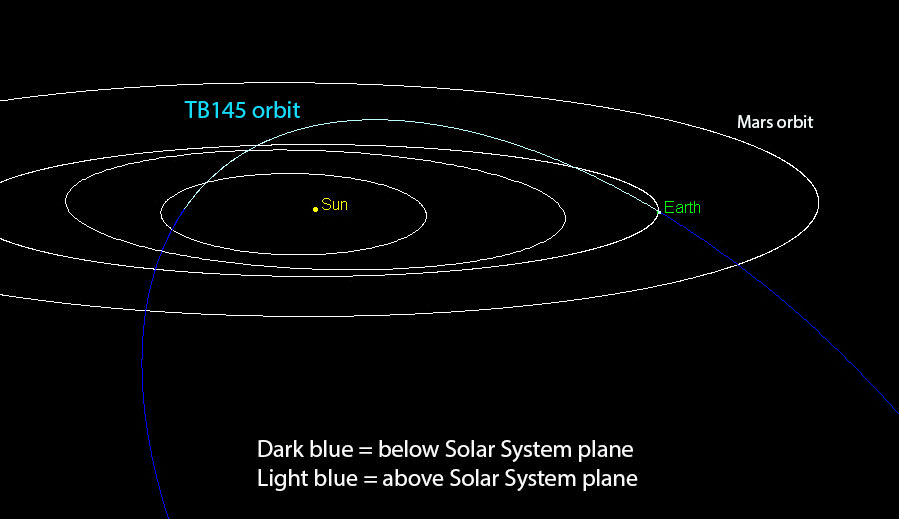
View of the orbit of asteroid 2015 TB145. Its orbit is inclined about 39° to the plane of the Solar System. Credit: P. Chodas (NASA/JPL – Caltech)
Astronomers first nabbed asteroid 2015 TB145 on Oct. 10, 2015, using the University of Hawaii’s Pan-STARRS-1 (Panoramic Survey Telescope and Rapid Response System) telescope atop Mt. Haleakala in Maui. According to the catalog of near-Earth objectskept by the Minor Planet Center, this is the closest currently known approach by an object this large until asteroid 1999 AN10 (about 2,600 feet or 800-m in size) zips by at about 1 lunar distance in August 2027.
The gravitational influence of the asteroid is so small it will have no detectable effect on the Moon or anything here on Earth, including our planet’s tides or tectonic plates. But the planet will certainly have an effect on the asteroid. Earth’s gravity will deflect TB145’s path during the close approach, making it tricky this far out to create an accurate map of its flight across the sky. That’s why the two maps I’ve included with this article are only approximate. As we get closer to Halloween, further refinements in the asteroid’s orbit will allow for more accurate path-making.
TB145’s path starting at 4 hours UT on Oct. 31 (11 p.m. CDT Oct. 30). This view faces east. Tick marks show its hourly position. At the start of the path, the asteroid will shine around magnitude 11.4 but will gradually brighten through the night. To convert from UT, subtract 4 hours for EDT, 5 for CDT, 6 for MDT and 7 for PDT. Click for a large version. Credit: Chris Marriott’s SkyMap
Because the asteroid passes so near Earth, parallax will shift its path north or south up to 1/2°. Parallax is the apparent shift in an object’s position against the more distant background stars depending on the observer’s location on Earth. You can see how parallax works using your eyes and a finger. Stick your arm straight out in front of you and hold up your index finger. Open and close your right and then your left eye in a back and forth blinking pattern and watch your finger jump back and forth across the more distant background. Each eye sees the thumb from a slightly different perspective, causing it to shift position against the distant scene.
Graphic depicting the orbit of asteroid 2015 TB145. The asteroid will safely fly past Earth slightly farther out than the moon’s orbit on Halloween. Credit: P. Chodas (NASA/JPL – Caltech)
This happens all the time with the Moon. You might see it conjunct with a bright planet where skywatchers on the opposite side of the planet see an occultation. That’s why it’s best to make your own map of TB145’s wild ride across the sky. When closest to Earth, the asteroid will cover a Full Moon diameter about every 3 minutes as it tears by us at 22 miles per second (35 km/sec). Without a good map, it’ll get away from you.
Method #1: Using Stellarium
Download the free sky-plotting program Stellarium. Once you’ve set your location, either hit F2 or click on the Configuration icon in the lower left corner of your screen. Now select the Plugins tab then Solar System Editor. Click on Configure at the bottom of the tab, choose Solar System and click Import orbital elements in MPC format.
Next, select the Asteroids option and then from the bookmarks list, choose MPCORB: near-Earth asteroids (NEAs) and then Get orbital elements. Allow the list — a very large one — to load then scroll through it until you find 2015 TD145 and put a check mark in the box. Then click Add objects.
Stellarium view of the sky and featured asteroid seen from northern, Minnesota at 11:55 p.m. October 30, 2015. Notice that a bright, waning gibbous Moon will be nearby during the best viewing opportunities for the Americas, which will make 2015 TB145 a little harder to spot.
Still with me? OK, close the Solar System editor and press F3 or select the magnifying glass icon in the lower left corner of your screen, then type in the asteroid’s name exactly as 2015 TD145. Hit enter and you’ll see a set of rotating red crosshairs. Bingo! This where the asteroid will be at the time you chose. You can adjust your magnitude range, field of view and even download additional files of fainter stars and deep sky objects. Unfortunately, Stellarium can’t draw an arc showing TB145’s changing position with time. Cross your fingers that appears in the next iteration.
Method #2: Download up-to-date orbital elements into your sky-charting program
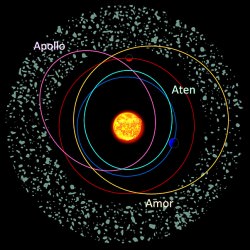
2015 TB145 belongs to the Apollo family of asteroids, whose orbits cross that of Earth. Amor asteroids approach but don’t cross, while Atens also cross Earth’s path but spend most of their time inside our orbit. Credit: ESA
Let’s say you already have a sky-charting program like Guide, Dance of the Planets, MegaStar or Starry Night. Go to the Minor Planet &Comet Ephemeris Serviceand type in 2015 TB145 in the big, blank box. Next, scroll down and select your program from the list and click on Get Ephemerides/HTML page. Save the file of orbital elements that pops up and place into the appropriate folder in your program. Open your program, select 2015 TB145 and make a chart!
Method #3: Manually input orbital elements into your program
You can also go to JPL’s Horizons site for the very latest orbital elements you can manually input in your program. 2015 TB145 is expected to be as bright as magnitude +10.1 (no problem in a 4.5-inch scope) but that occurs during the afternoon for the Americas. The Middle East and Asia are the place to be for closest approach. Peak brightness over the U.S. will occur before dawn on Halloween, so you can begin observation around 11 p.m. local time Friday evening October 30 when Orion comes up in the east. The asteroid starts shines at around magnitude +11-11.5 that evening and brightens overnight to around +10.3-10.5 before dawn for the Americas.
A word about tracking fast-moving asteroids. I’ve found that the best way to catch sight of one is to “camp” at the place they’ll pass at a certain time. Say you want to see TB145 at 1:15 a.m. October 31. Make a chart that shows its position every 15 minutes. Five minutes before it arrives at the 1:15 a.m. spot, point your telescope there and wait for a “moving star” to enter the field of view. If you don’t see it right way, wait a few minutes and pan around to the north and south of the location. By the way, the asteroid will pass less than a degree northwest of the Crab Nebula (M1) in Taurus around 10:30 UT (5:30 a.m. CDT).
Be aware that the bright, waning gibbous Moon will be within 10° of the asteroid when it’s best visible in the Americas. While this will make observing the asteroid more challenging, don’t let it stop you from trying. If bad weather gets in the way, Gianluca Masi has you covered. He’ll live-stream the flyby on his Virtual Telescope sitebeginning at 0:00 UT (7 p.m CDT) on October 31st.
One way or another, we’ll all have a shot at seeing the Great Pumpkin asteroid this Halloween.
2015 TB145 looks stellar in this photo taken on October 24th when it glowed at only 16th magnitude. Credit: Peter Lake
UPDATE Oct. 27, 2015: There’s been some discussion about TB145’s orbit resembling that of a comet along with speculation it might be a dead or dormant comet. Amateur and professional astronomers have been watching it closely, looking for hints of activity such as a fuzzy coma. So far, photos show the asteroid as completely stellar.
I also wanted to update you on its visibility. Those with 10-inch or larger telescopes can begin looking for the object Thursday night Oct. 29th when it reaches magnitude +13.5. The following night it leaps to +11.5 with a peak brightness of +10.0 occurring around 14:00 UT (9 a.m. CDT) on Halloween. TB145 fades rapidly thereafter – down to 15th magnitude just 8 hours later.
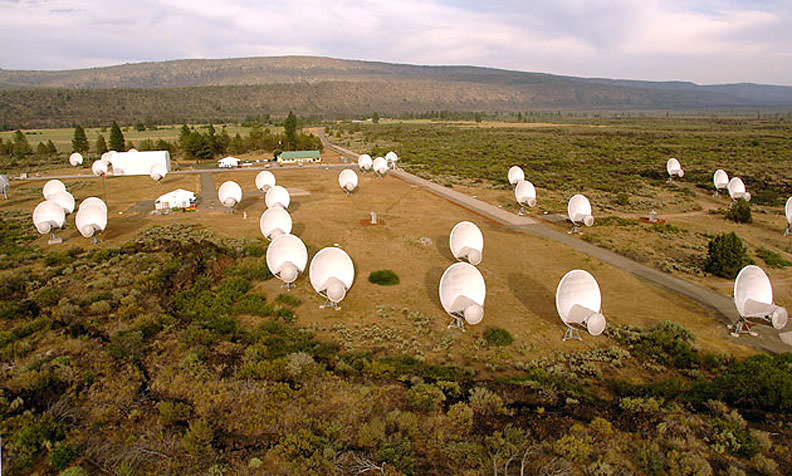
One of the 42 dishes in the Allen Telescope Array that searches for signals from space. Credit: Seth Shostak / SETI Institute.
“We either caught something shortly after an event like two planets crashing together or alien intelligence,” said Dr. Gerald Harp, senior scientist at the SETI Institute in Mountain View, California, referring to the baffling light variations seen by the Kepler Observatory in the star KIC 8462852 .
And he and a team from the Institute are working hard at this moment to determine which of the two it is.
Gerald Harp of the SETI Institute is involved in gathering and studying data from the mysterious Kepler star. Credit: SETI Institute
Beginning last Friday (Oct. 16), the Institute’s Allen Telescope Array (ATA) was taken off its normal survey schedule and instead focused on KIC 8462852, one of the 150,000-plus stars studied by NASA’s Kepler Mission to detect Earth-sized exoplanets orbiting distant stars.. The array of 42 dishes comprises a fully automated system that can run day and night, alerting staff whenever an unusual or interesting signal has been detected.
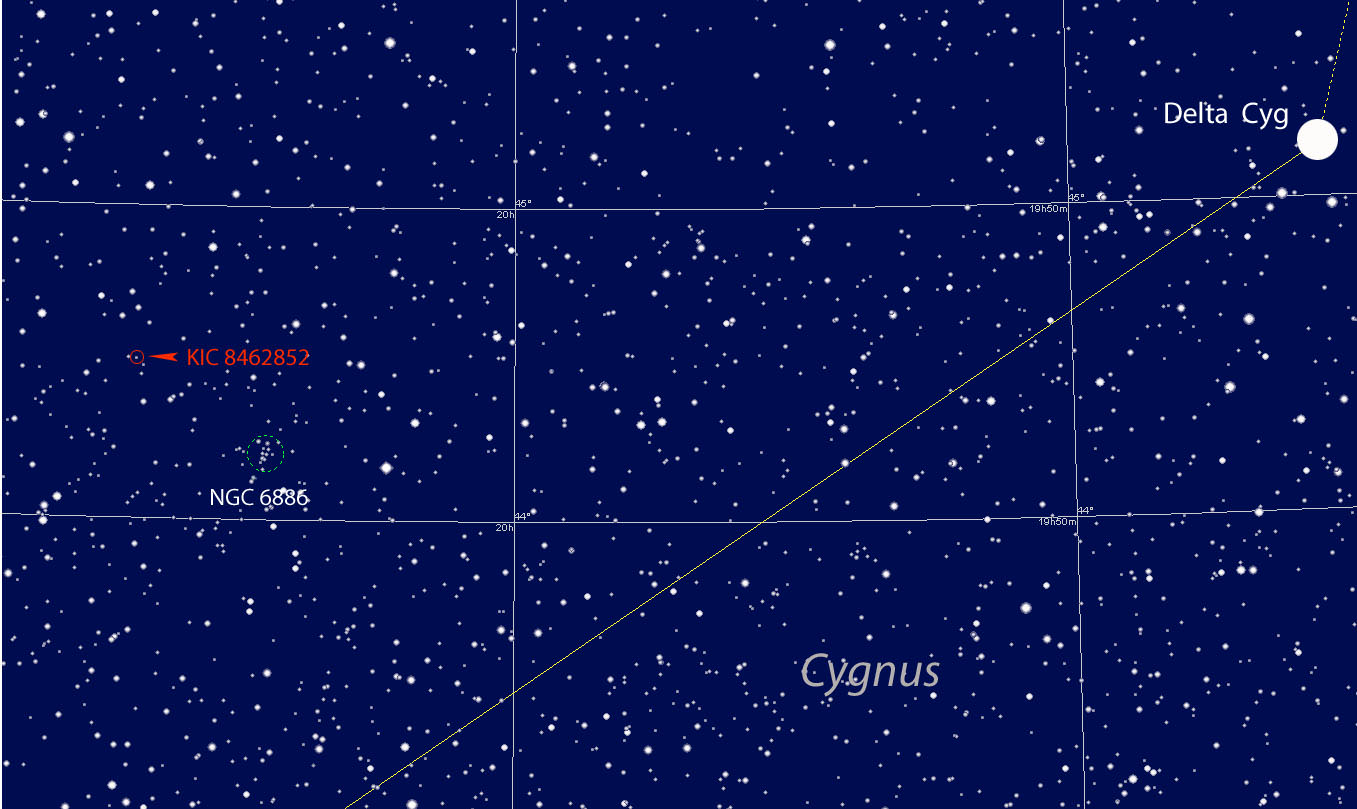
A swarm of comets has been proposed to explain the erratic and non-repeating light variations seen in the star located nearly 1,500 light years from Earth in the constellation Cygnus the Swan. But no one really seems satisfied with the explanation, and the chances that we’d catch a huge event like a comet breakup or planetary collision in the short time the star has been under observation seems unlikely. Collisions also generate dust. Warmed by the star, that dust would glow in infrared light, but none beyond what’s expected has been detected.
The Allen Telescope Array (ATA) is a “Large Number of Small Dishes” (LNSD) array designed to be highly effective for simultaneous surveys undertaken for SETI projects (Search for Extraterrestrial Intelligence) at centimeter wavelengths. Credit: Seth Shostak / SETI Institute
The ATA picks up radio frequencies in the microwave range from 1-10 gigahertz. For comparison, your kitchen microwave oven produces microwaves at around 2 gigahertz. Although Harp couldn’t reveal the team’s results yet — that will come soon when a paper is submitted in few weeks in a science journal — he did share the excitement of a the hunt in a phone interview Tuesday.
The array normally looks for a very narrow wave or specific frequency when hunting for potential “ET” signals. But not this time.
“This is a special target,” said Harp. “We’re using the scope to look at transmissions that would produce excess power over a range of wavelengths.” Perhaps from a potential alien power source? Maybe. Harp believes the star’s peculiar, a-periodic light variations seen by Kepler are “probably natural and definitely worth looking at” but considers an intelligent source a possibility, however remote.
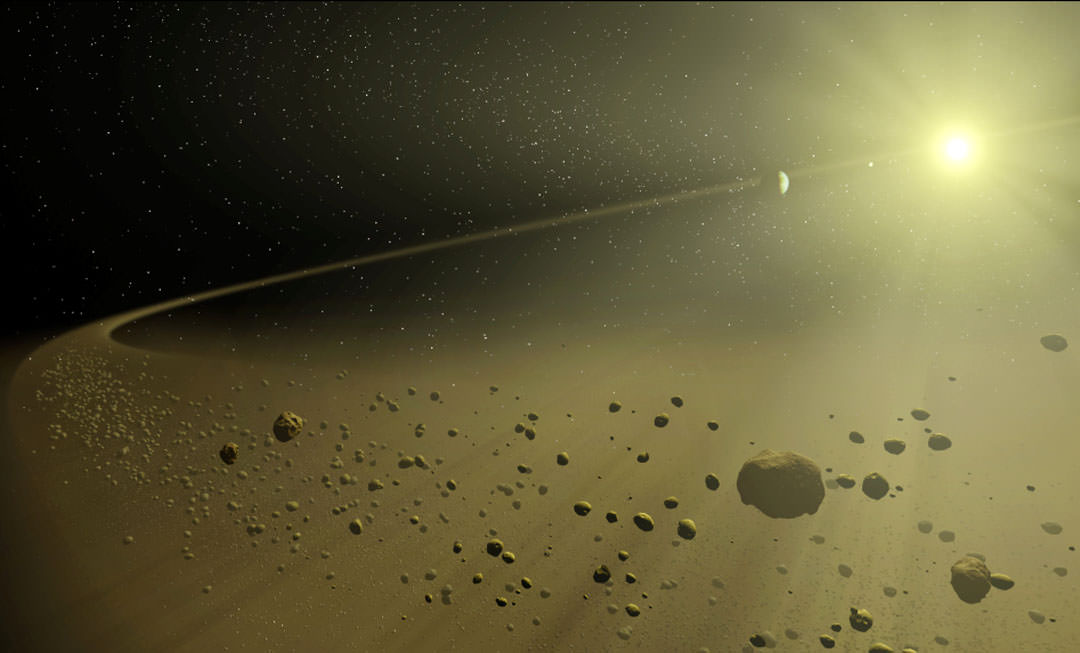
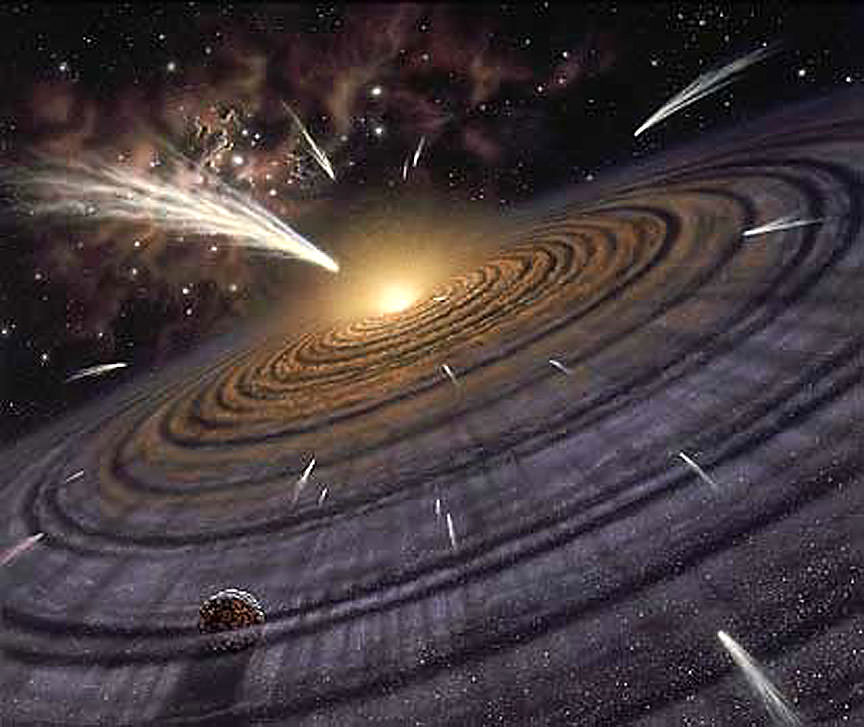
This artist concept illustrates how two large, planet-sized objects could collide to create clumps of material in orbit around a star. They’d also create a lot of dust, which would glow in infrared light, something not seen around the Kepler star. Credit: NASA/JPL-Caltech/T. Pyle (SSC)
During our conversation, he emphasized how special the light variations from the star were, adding how the “big gob” of material orbiting KIC (stands for Kepler Input Catalog) 8462852 is unusual in that it’s “clumped”. “We expect it to spread into a ring,” he said.
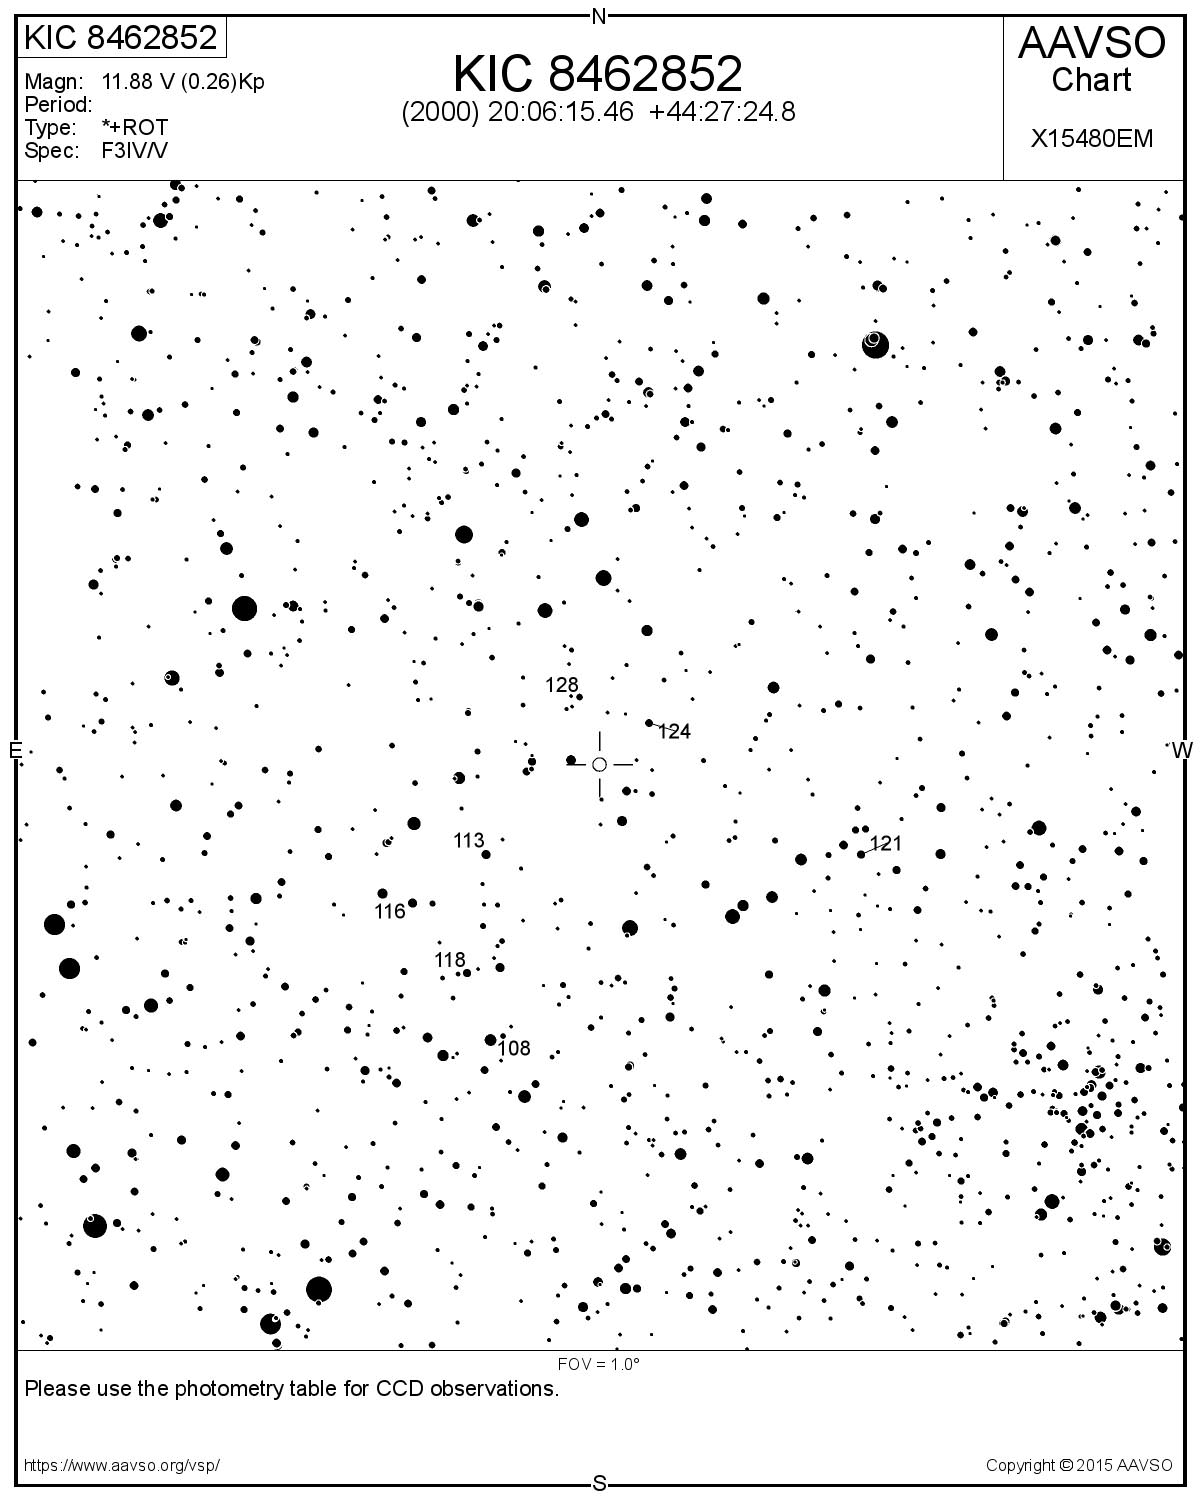
AAVSO chart of KIC 8462852. Click to enlarge or go to the website to make your own customized version. Credit: AAVSO
Meanwhile, the American Association of Variable Star Observers (AAVSO) published an Alert Notice this week requesting amateurs and professional astronomers around the world to immediately begin observing KIC 8462852 now through the end of the current observing season. To locate the star, you can either use the charts provided in our previous story or go to the AAVSO site and type in KIC 8462852 in the “Pick a Star” box to create a chart of your own.
I’m a variable star observer, so naturally I thought of variables with irregular fluctuations in light when I first heard about this stellar mystery. Time to talk to an expert. According to Elizabeth Waagen, senior technical assistant for science operations at the AAVSO, KIC 8462852 is different.
“Based on the information so far, it doesn’t seem to fit the criteria for an irregular variable,” said Waagen in a phone interview this morning. “It’s doesn’t add up.”
She encouraged an open mind. “It’s a big puzzle, so we sent out the notice,” referring to the alert described above.
All quite exciting, and I’m as eager as you to see the published results on the signals, which Harp said would appear or link from the SETI website soon. Stay tuned …
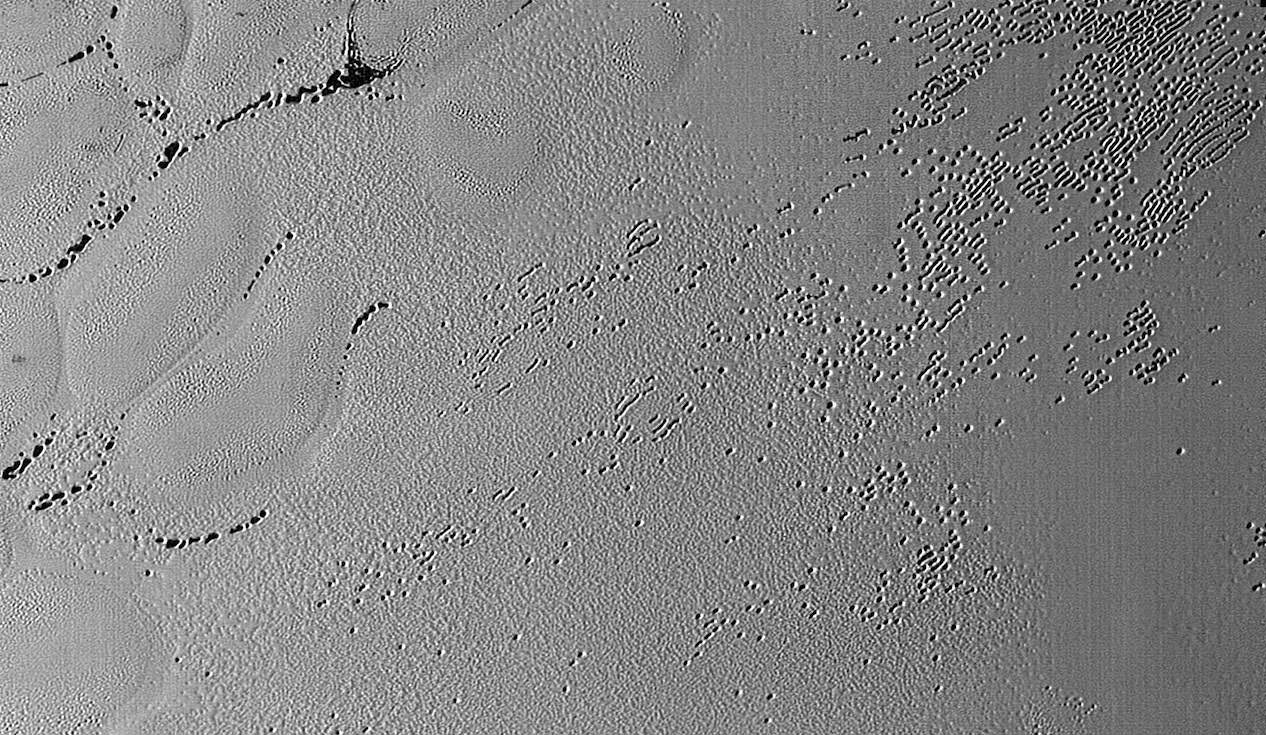
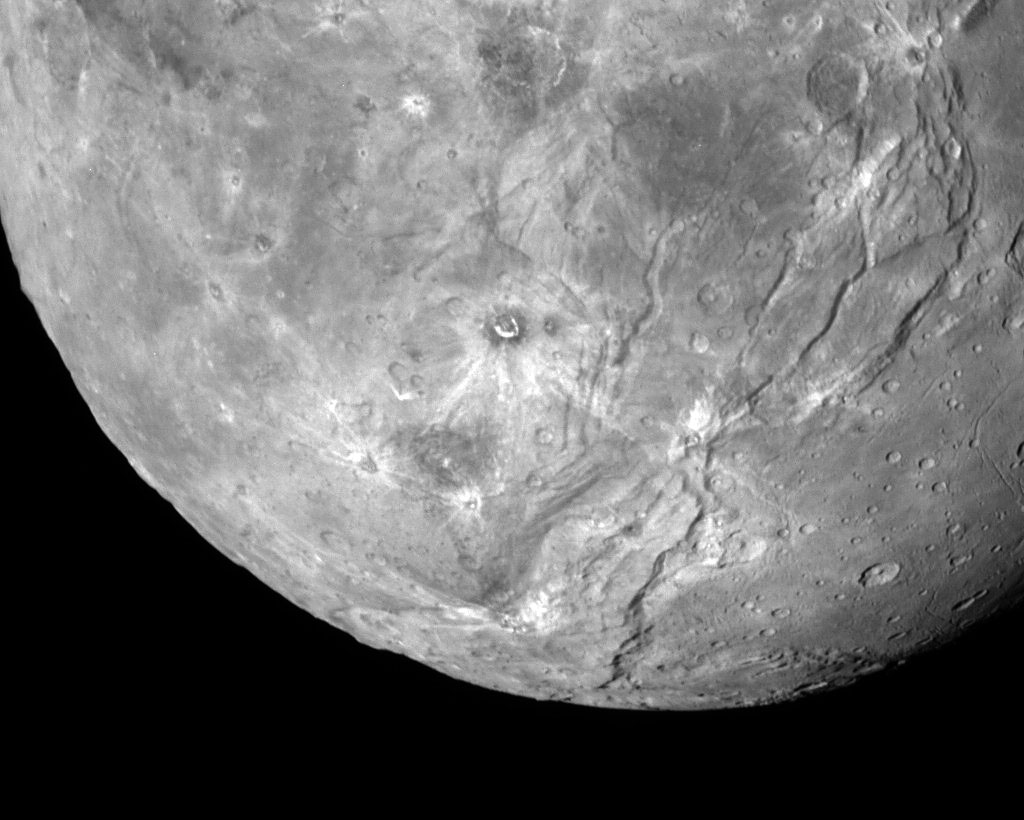
This image was taken by the Long Range Reconnaissance Imager (LORRI) on NASA's New Horizons spacecraft shortly before closest approach to Pluto on July 14, 2015; it resolves details as small as 270 yards (250 meters). The scene shown is about 130 miles (210 kilometers) across. The sun illuminates the scene from the left, and north is to the upper left.
Credits: NASA/JHUAPL/SwRI
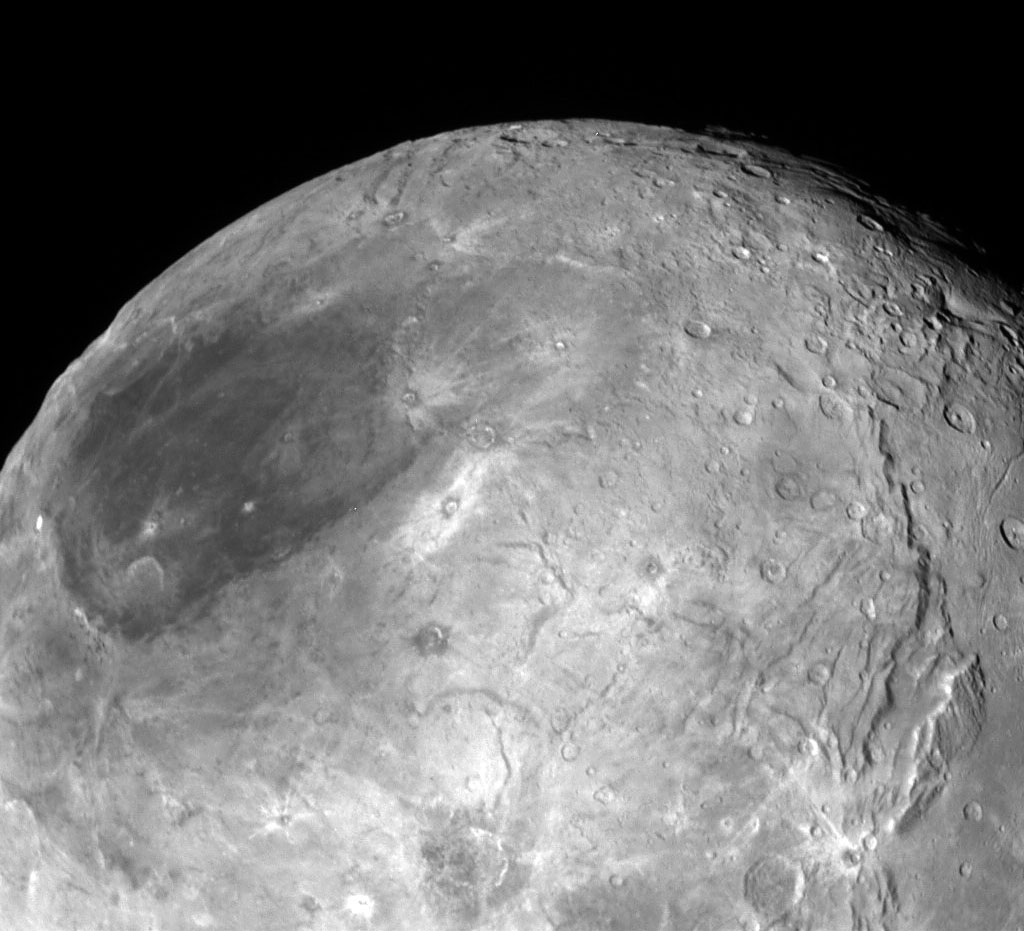
A brand new batch of Pluto and Charon photos showed up today on the New Horizons LORRI (LOng-Range Reconnaissance Imager) site. The photos were taken during the close flyby of the system on July 14, 2015 and show rich detail including craters and parallel cracks on Charon and thousands of small pits punctuating Pluto’s nitrogen ice landscape. Have at ’em!
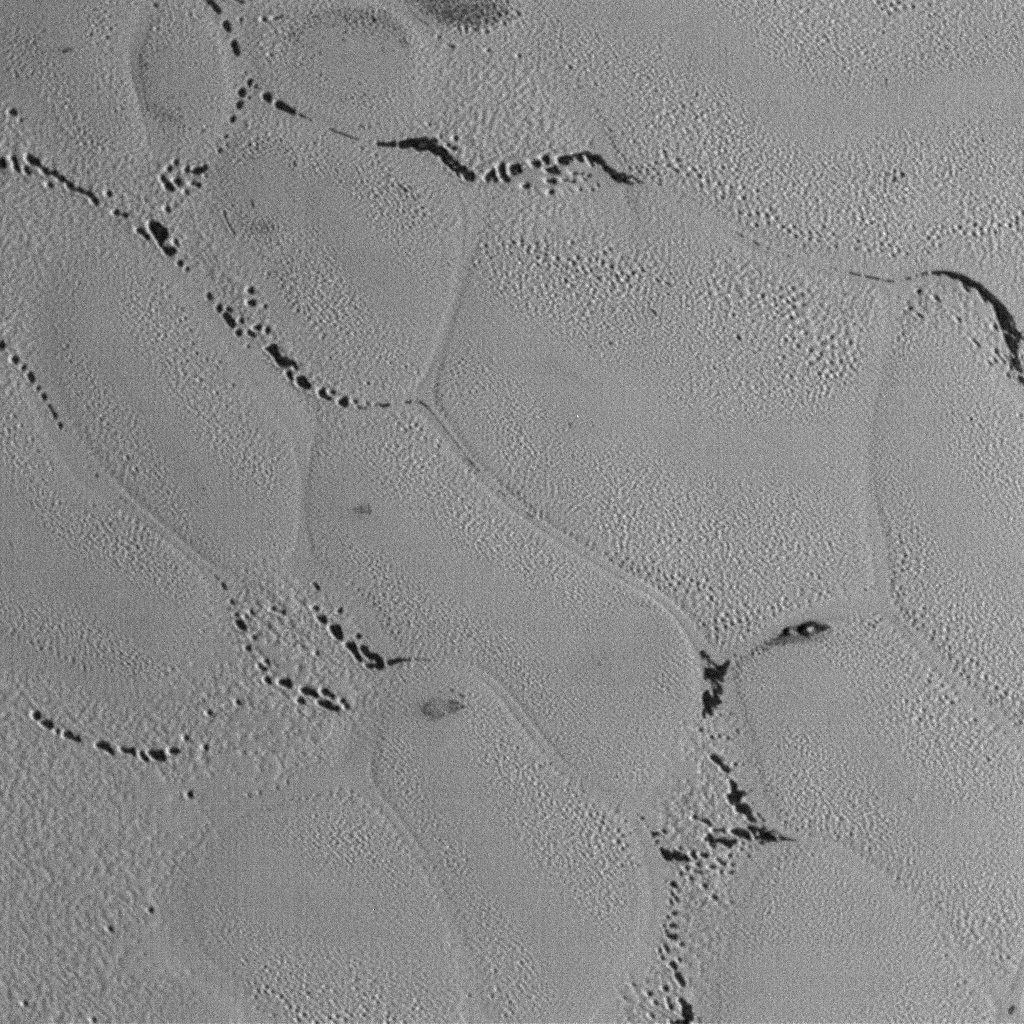
This wider view shows the snakeskin-like textured surface of Pluto’s icy plains riddled with small pits. It almost looks like the dark areas in the sinuous channels between the mounds were once covered with frost or ice that has since sublimated away. They look similar to the polar regions on Mars where carbon dioxide frost burns off in the spring to reveal darker material beneath. Credit: NASA/JHUAPL/SwRI
The first couple images feature the region informally known as Sputnik Planum. According to a releasefrom NASA today, scientists think the region is composed of volatile ices such as solid nitrogen. They theorize that the pits and troughs – typically hundreds of meters across and tens of meters deep – are possibly formed by sublimation or evaporation of these ices in Pluto’s thin atmosphere. Still, their curious shapes and alignments remain a mystery. Adding to the intrigue is that even when seen up close, no impact craters are visible, testifying to the icy plain’s extreme geologic youth.
By the way, there are more images at the LORRI link at top. I picked a representative selection but I encourage you to visit and explore.
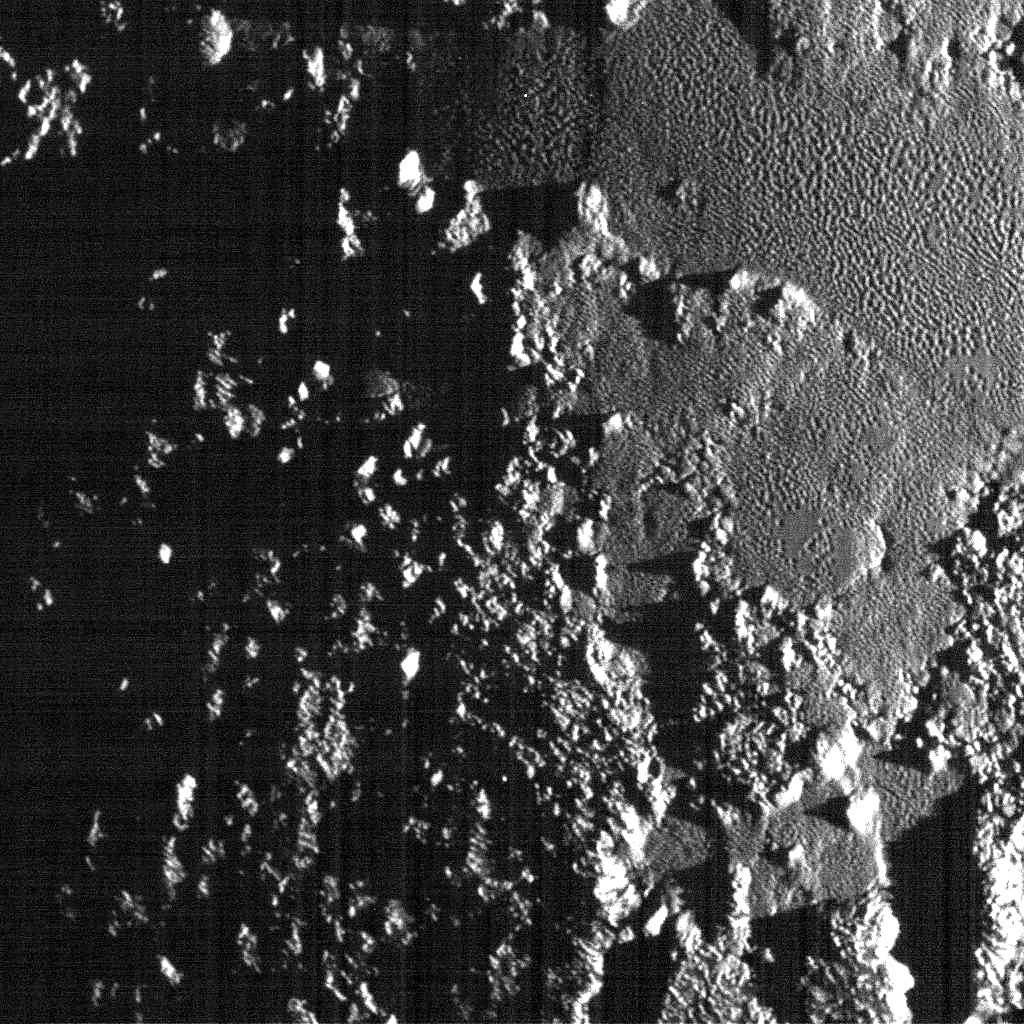
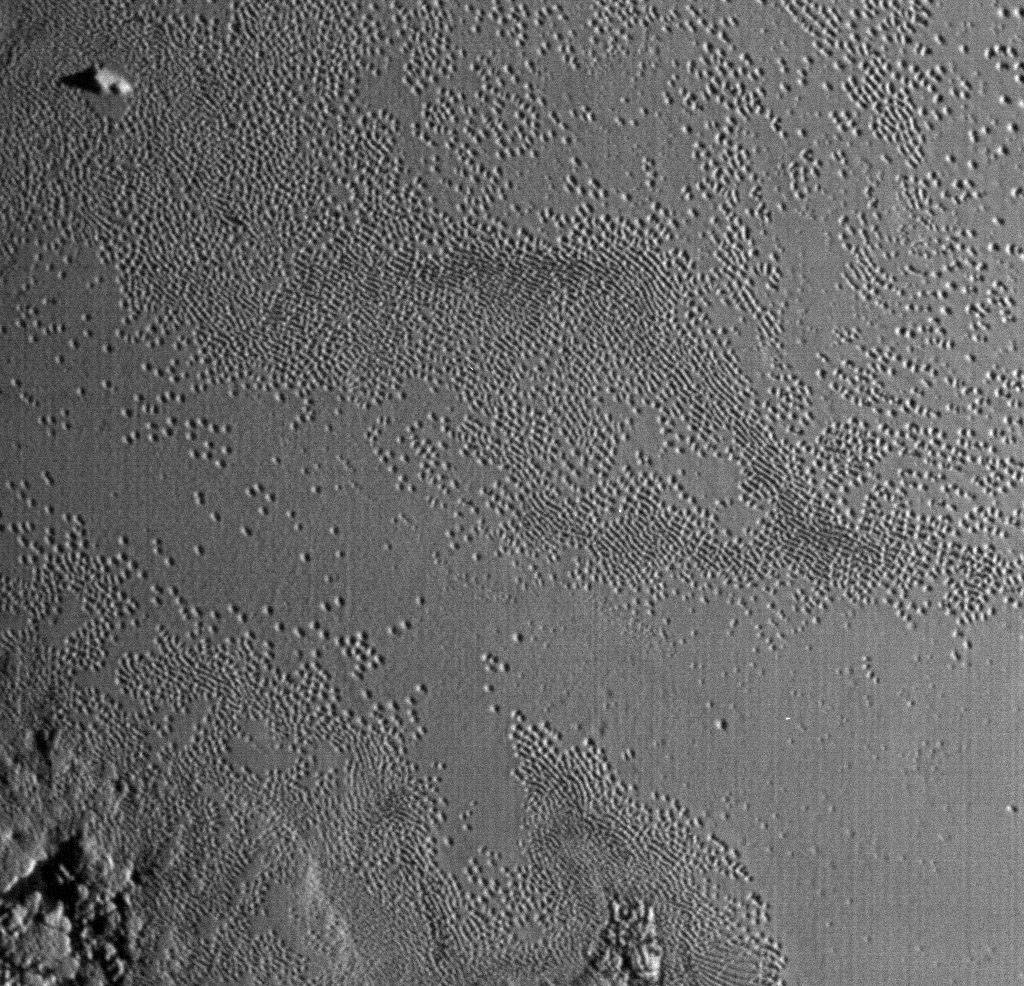
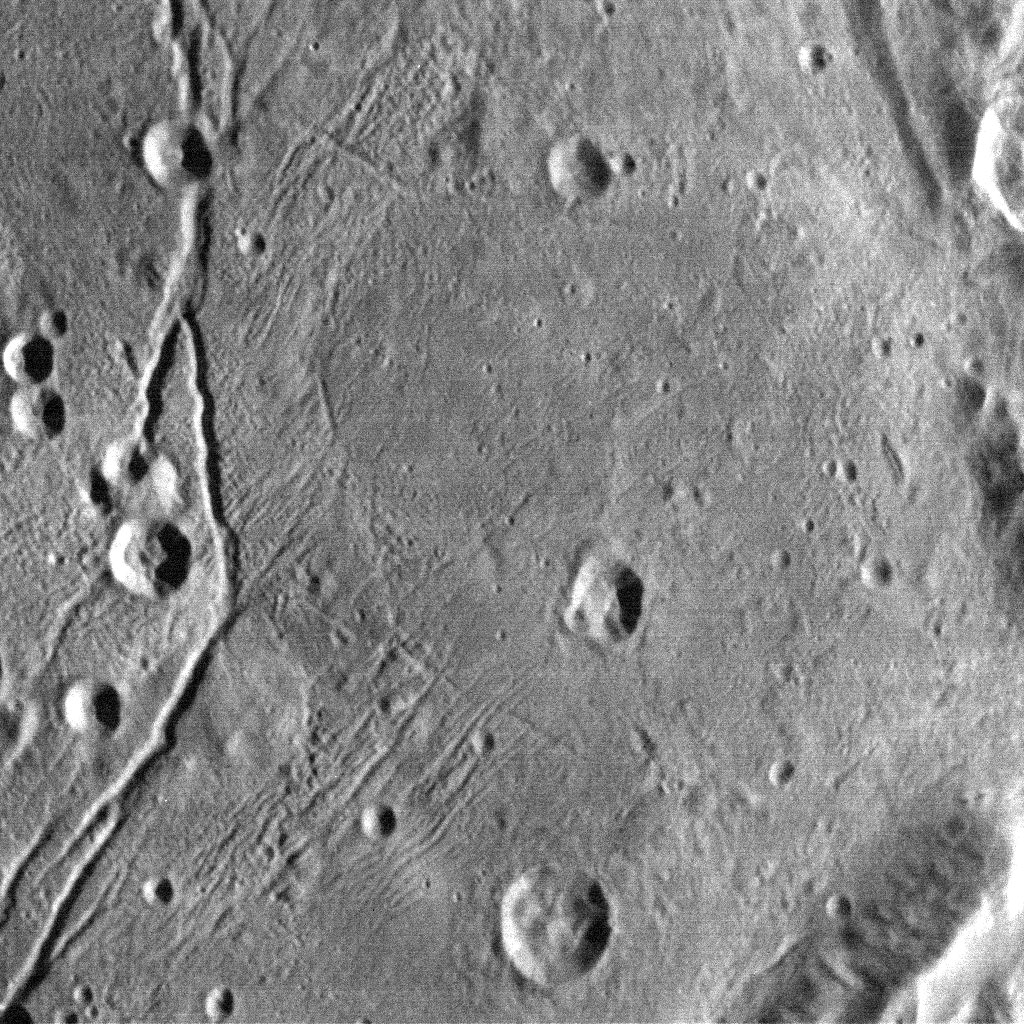
Now that’s what I call getting a photo in low light. Sunlight scrapes across rugged mountains as well as highlight the ubiquitous pitted terrain. Credit: NASA/JHUAPL/SwRILife’s definitely the pits on Pluto’s Tombaugh Regio. This photo shows the fainter “ghost” pits well. Is ice filling them in or are we seeing the beginning of a pit’s formation? Credit: NASA/JHUAPL/SwRIA fine view of Pluto’s largest moon Charon and its vast canyon system. Credit: NASA/JHUAPL/SwRILooking over Charon’s dark north polar region, the border of which is highlighted by several beautiful rayed craters. Not that it’s necessarily related, but the dark spot reminds me of a lunar mare or sea. On the moon, cracks in the crust allowed lava to fill gigantic basins to create the maria. Could material from beneath Charon have bubbled up to fill an ancient impact? Credit: NASA/JHUAPL/SwRISpeaking of the Moon, the large cracks at left resemble lunar rills, some of which formed through faulting / fracturing and others as conduits for lava flows. The multiple, fine cracks are interesting. Credit: NASA/JHUAPL/SwRISplendid rayed crater with an interesting contrast between dark and light ejecta. Credit: NASA/JHUAPL/SwRIA busy region on Charon, the meeting place of different terrains. Credit: NASA/JHUAPL/SwRI
Something other than a transiting planet makes the Kepler star KIC fluctuate wildly and unpredictably in brightness. Astronomers suspect a shattered comet, but who knows? Credit: NASA
“Bizarre.” “Interesting.” “Giant transit”. That were the reactions of Planet Hunters project volunteers when they got their first look at the light curve of the otherwise normal sun-like star KIC 8462852 nearly.
Of the more than 150,000 stars under constant observation during the four years of NASA’s primary Kepler Mission (2009-2013), this one stands alone for the inexplicable dips in its light. While almost certainly naturally-caused, some have suggested we consider other possibilities.
Kepler-11, a sun-like star orbited by six planets. At times, two or more planets pass in front of the star at once, as shown in this artist’s conception of a simultaneous transit of three planets observed by the Kepler spacecraft on Aug. 26, 2010. During each pass or transit, the star’s light fades in a periodic way. Credit: NASA/Tim Pyle
You’ll recall that the orbiting Kepler observatory continuously monitored stars in a fixed field of view focused on the constellations Lyra and Cygnus hoping to catch periodic dips in their light caused by transiting planets. If a drop was seen, more transits were observed to confirm the detection of a new exoplanet.
And catch it did. Kepler found 1,013 confirmed exoplanets in 440 star systems as of January 2015 with 3,199 unconfirmed candidates. Measuring the amount of light the planet temporarily “robbed” from its host star allowed astronomers to determine its diameter, while the length of time between transits yielded its orbital period.
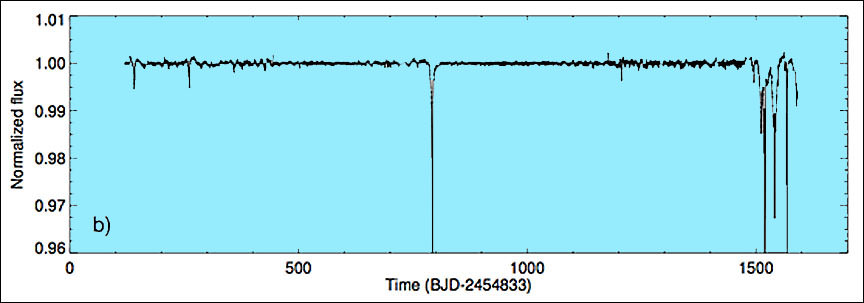
Graph showing the big dip in brightness of KIC 8462852 around 800 days (center) followed after 1500 days whole series of dips of varying magnitude up to 22%. The usual drop in light when an exoplanet transits its host star is a fraction of a percent. The star’s normal brightness has been set to “1.00” as a baseline. Credit: Boyajian et. all
Volunteers with the Planet Hunters project, one of many citizen science programs under the umbrella of Zooniverse, harness the power of the human eye to examine Kepler light curves (a graph of a star’s changing light intensity over time), looking for repeating patterns that might indicate orbiting planets. They were the first to meet up with the perplexing KIC 8462852.
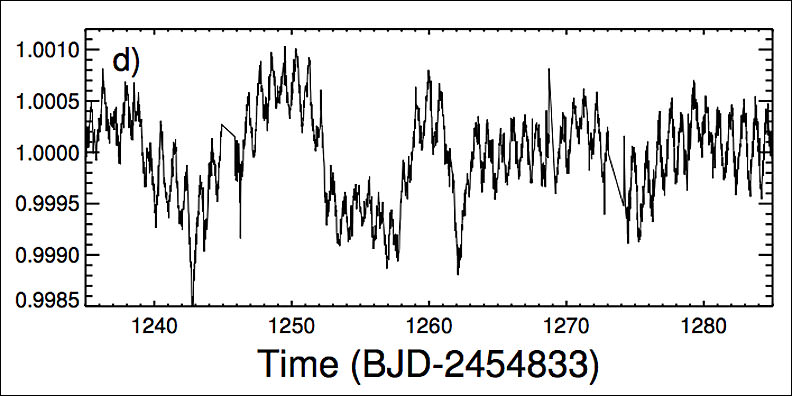
A detailed look at a small part of the star’s light curve reveals an unknown, regular variation of its light every 20 days. Superimposed on that is the star’s 0.88 day rotation period. Credit: Boyajian et. all
This magnitude +11.7 star in Cygnus, hotter and half again as big as the Sun, showed dips all over the place. Around Day 800 during Kepler’s run, it faded by 15% then resumed a steady brightness until Days 1510-1570, when it underwent a whole series of dips including one that dimmed the star by 22%. That’s huge! Consider that an exo-Earth blocks only a fraction of a percent of a star’s light; even a Jupiter-sized world, the norm among extrasolar planets, soaks up about a percent.
Exoplanets also show regular, repeatable light curves as they enter, cross and then exit the faces of their host stars. KIC 8462852’s dips are wildly a-periodic.
Could a giant comet breakup and subsequent cascading breakups of those pieces be behind KIC 8462852’s erratic changes in brightness? Credit: NASA
Whatever’s causing the flickering can’t be a planet. With great care, the researchers ruled out many possibilities: instrumental errors, starspots (like sunspots but on other stars), dust rings seen around young, evolving stars (this is an older star) and pulsations that cover a star with light-sucking dust clouds.
What about a collision between two planets? That would generate lots of material along with huge clouds of dust that could easily choke off a star’s light in rapid and irregular fashion.
A great idea except that dust absorbs light from its host star, warms up and glows in infrared light. We should be able to see this “infrared excess” if it were there, but instead KIC 8462852 beams the expected amount of infrared for a star of its class and not a jot more. There’s also no evidence in data taken by NASA’s Wide-field Infrared Survey Explorer (WISE) several years previously that a dust-releasing collision happened around the star.
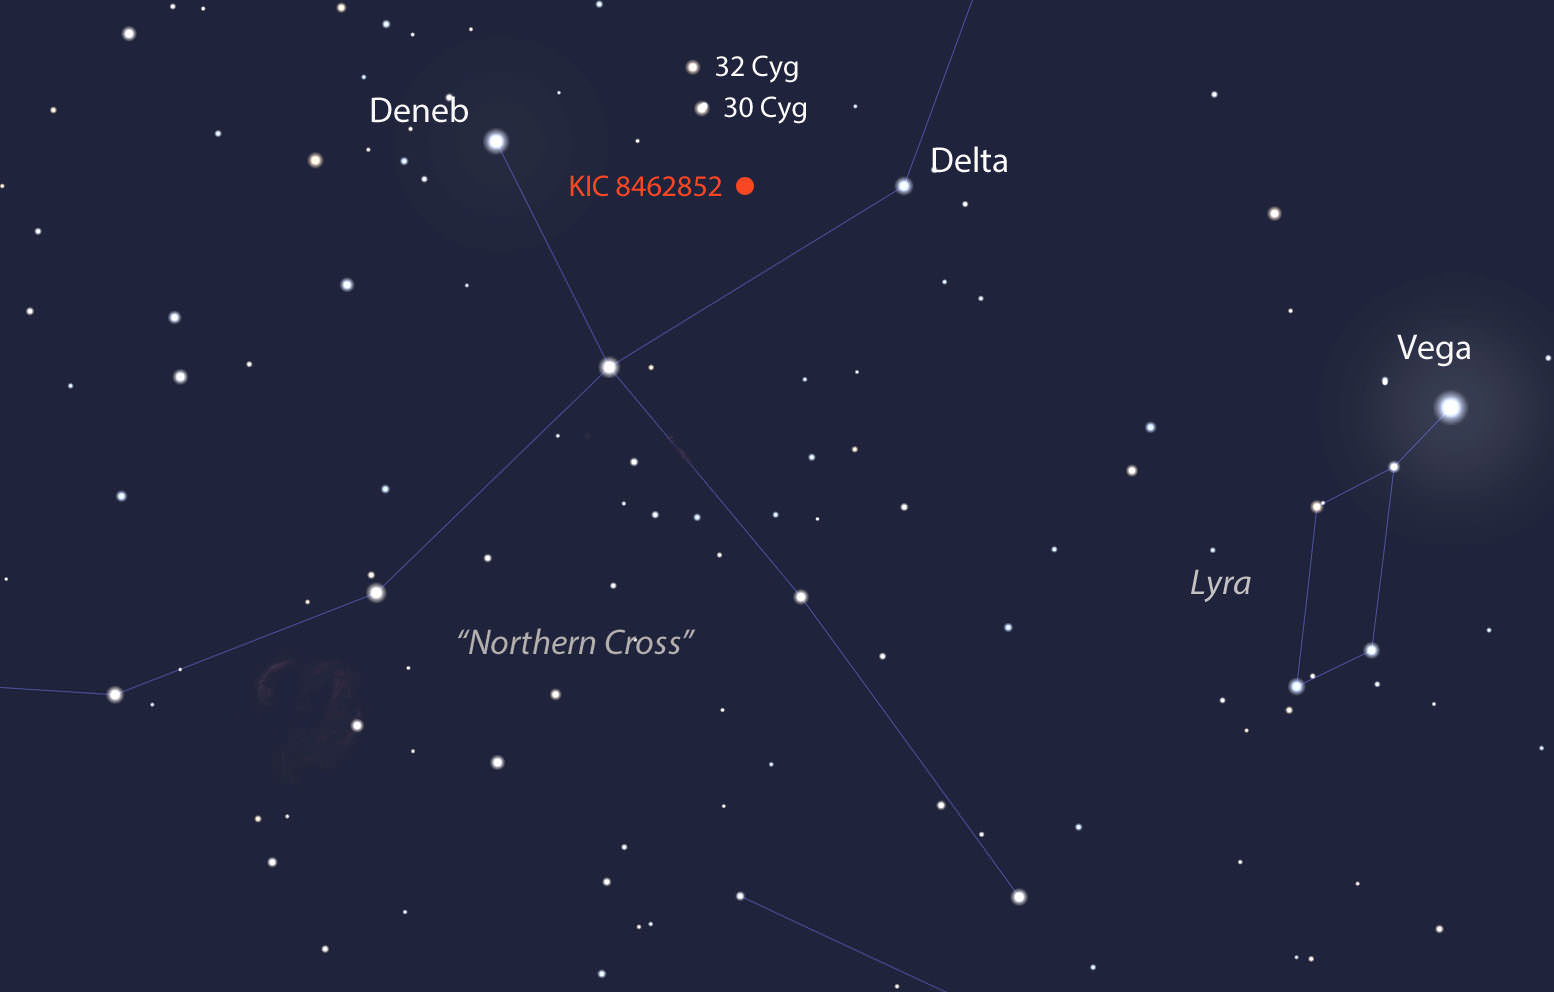
Our featured star shines at magnitude +11.7 in the constellation Cygnus the Swan (Northern Cross) high in the southern sky at nightfall this month. A 6-inch or larger telescope will easily show it. Use this map to get oriented and the map below to get there. Source: Stellarium
After examining the options, the researchers concluded the best fit might be a shattered comet that continued to fragment into a cascade of smaller comets. Pretty amazing scenario. There’s still dust to account for, but not as much as other scenarios would require.
Detailed map showing stars to around magnitude 12 with the Kepler star identified. It’s located only a short distance northeast of the open cluster NGC 6886 in Cygnus. North is up. Click to enlarge. Source: Chris Marriott’s SkyMap
Being fragile types, comets can crumble all by themselves especially when passing exceptionally near the Sun as sungrazing comets are wont to do in our own Solar System. Or a passing star could disturb the host star’s Oort comet cloud and unleash a barrage of comets into the inner stellar system. It so happens that a red dwarf star lies within about 1000 a.u. (1000 times Earth’s distance from the Sun) of KIC 8462852. No one knows yet whether the star orbits the Kepler star or happens to be passing by. Either way, it’s close enough to get involved in comet flinging.
So much for “natural” explanations. Tabetha Boyajian, a postdoc at Yale, who oversees the Planet Hunters and the lead author of the paper on KIC 8462852, asked Jason Wright, an assistant professor of astronomy at Penn State, what he thought of the light curves. “Crazy” came to mind as soon he set eyes on them, but the squiggles stirred a thought. Turns out Wright had been working on a paper about detecting transiting megastructures with Kepler.
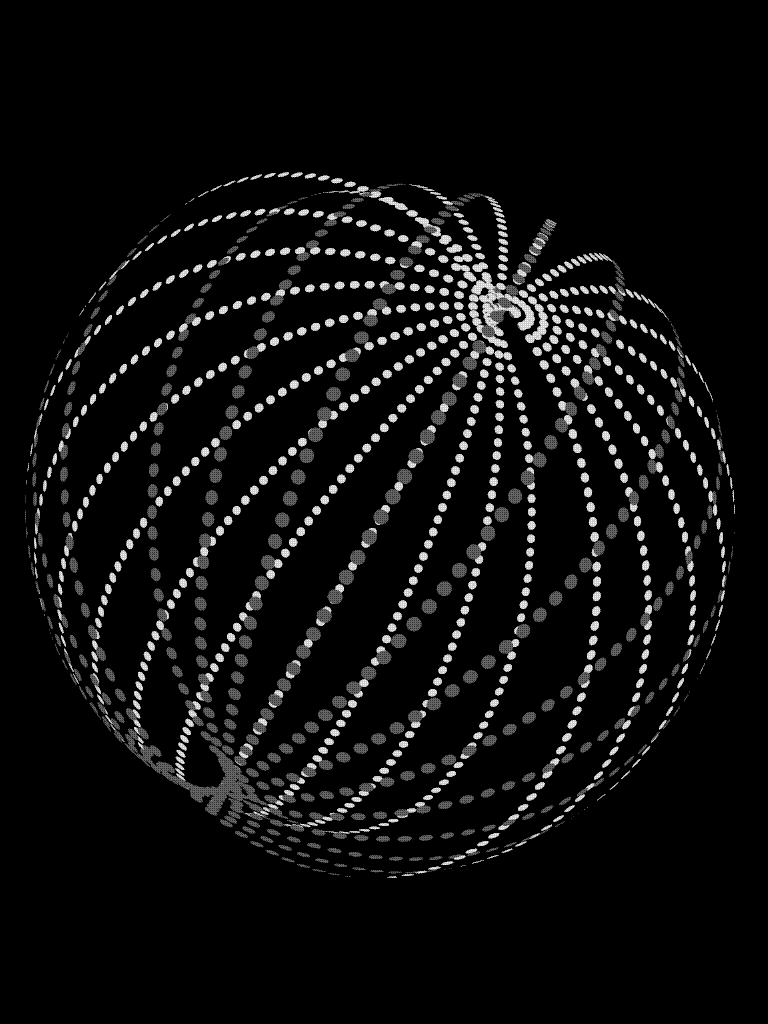
There are Dyson rings and spheres and a Dyson swarm depicted here. Could this or a variation of it be what we’re seeing around KIC 8462852? Not likely, but a fun thought experiment. Credit: Wikipedia
In a recent blog, he writes: “The idea is that if advanced alien civilizations build planet-sized megastructures — solar panels, ring worlds, telescopes, beacons, whatever — Kepler might be able to distinguish them from planets.” Let’s assume our friendly aliens want to harness the energy of their home star. They might construct enormous solar panels by the millions and send them into orbit to beam starlight down to their planet’s surface. Physicist Freeman Dyson popularized the idea back in the 1960s. Remember the Dyson Sphere, a giant hypothetical structure built to encompass a star?
From our perspective, we might see the star flicker in irregular ways as the giant panels circled about it. To illustrate this point, Wright came up with a wonderful analogy:
“The analogy I have is watching the shadows on the blinds of people outside a window passing by. If one person is going around the block on a bicycle, their shadow will appear regularly in time and shape (like a regular transiting planet). But crowds of people ambling by — both directions, fast and slow, big and large — would not have any regularity about it at all. The total light coming through the blinds might vary like — Tabby’s star.”
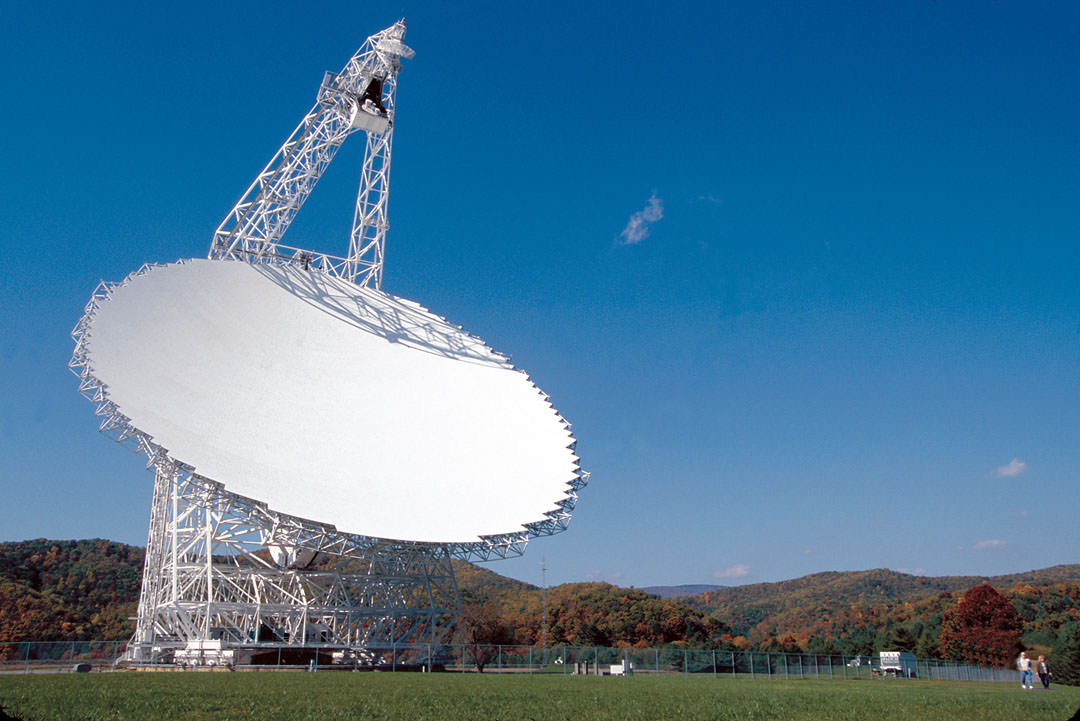
The Green Bank Telescope is the world’s largest, fully-steerable telescope. The GBT’s dish is 100-meters by 110-meters in size, covering 2.3 acres of space. Credit: NRAO/AUI/NSF
Even Wright admits that the “alien hypothesis” should be seen as a last resort. But to make sure no stone goes unturned, Wright, Boyajian and several of the Planet Hunters put together a proposal to do a radio-SETI search with the Green Bank 100-meter telescope. In my opinion, this is science at its best. We have a difficult question to answer, so let’s use all the tools at our disposal to seek an answer.
KIC 8462852, photographed on Oct. 15, 2015. It’s an F3 V star (yellow-white dwarf) located about 1,480 light years from Earth. Credit: Gianluca Masi
In the end, it’s probably not an alien megastructure, just like the first pulsar signals weren’t sent by LGM-1 (Little Green Men). But whatever’s causing the dips, Boyajian wants astronomers to keep a close watch on KIC 8462852 to find out if and when its erratic light variations repeat. I love a mystery, but answers are even better.
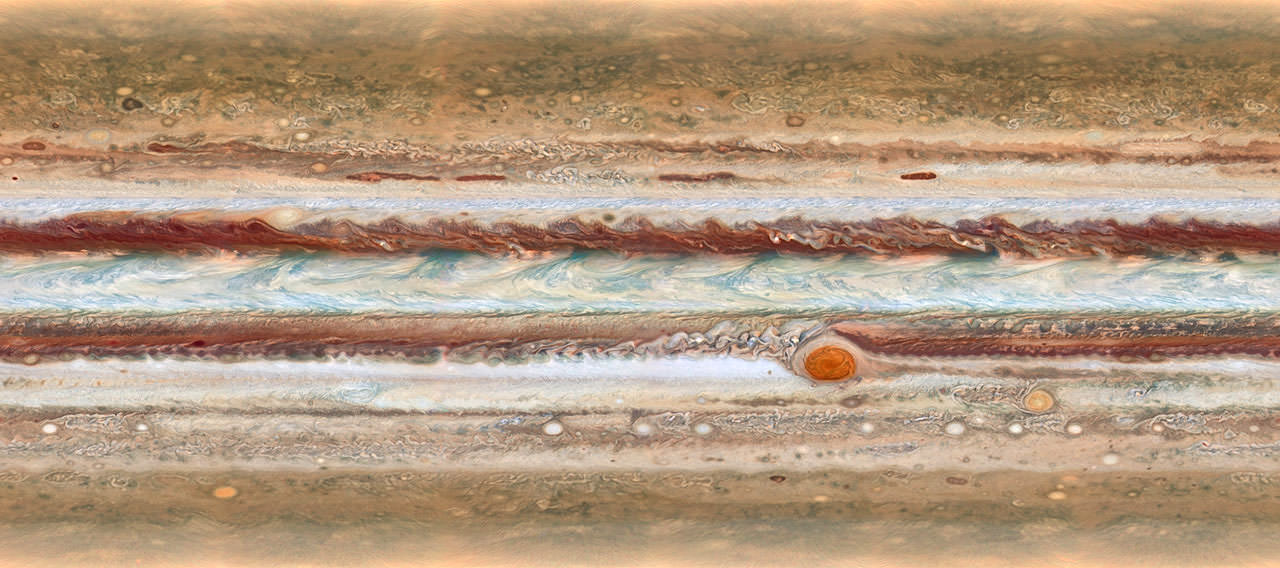
This new image from the largest planet in the Solar System, Jupiter, was made during the Outer Planet Atmospheres Legacy (OPAL) programme. The images from this programme make it possible to determine the speeds of Jupiter’s winds, to identify different phenomena in its atmosphere and to track changes in its most famous features.
The map shown was observed on 19 January 2015, from 2:00 UT to 12:30 UT.
Credit:
NASA, ESA, A. Simon (GSFC), M. Wong (UC Berkeley), and G. Orton (JPL-Caltech)
Jupiter global map created from still images from the Hubble Space Telescope
It’s been widely reported, including at Universe Today, that the apple of Jupiter’s eye, the iconic Great Red Spot (GRS), has been shrinking for decades. Even the rate of shrinkage has been steadily increasing.
Back in the late 1800s you could squeeze three Earths inside the GRS. Those were the days. Last May it measured just 10,250 miles (16,496 km) across, big enough for only 1.3 of us.
And while new photos from the Hubble Space Telescope show that Jupiter’s swollen red eye has shrunk an additional 150 miles (240 km) since 2014, the good news is that the rate of shrinkage appears to be well, shrinking. The contraction of the GRS has been studied closely since the 1930s; even as recently as 1979, the Voyager spacecraft measured it at 14,500 miles (23,335 km) across. But the alarm sounded in 2012, when amateur astronomers discovered sudden increase in the rate of 580 miles (933 km) a year along with a shift in shape from oval to roughly circular.
For the moment, it appears that the GRS is holding steady, making for an even more interesting Jupiter observing season than usual. Already, the big planet dominates the eastern sky along with Venus on October mornings. Consider looking for changes in the Spot yourself in the coming months. A 6-inch or larger scope and determination are all you need.
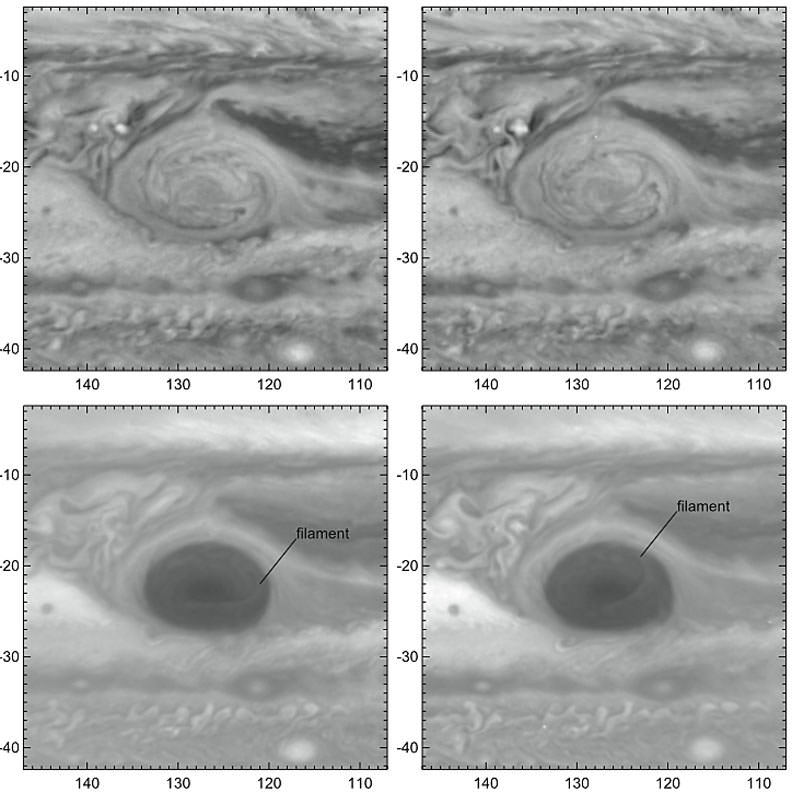
Hubble photos of the Great Red Spot taken on a first rotation (left frames) and 10 hours later (right frames) show the counterclockwise rotation of the newly-discovered filament or wisp inside the GRS. Credit: NASA, ESA, A. Simon (GSFC), M. Wong (UC Berkeley), and G. Orton (JPL-Caltech)
New imagery from the Hubble OPAL program also shows a curious wisp at the center of the Great Red Spot spanning almost the entire width of the hurricane-like vortex. This filamentary streamer rotates and twists throughout the 10-hour span of the Great Red Spot image sequence, drawn out by winds that are blowing at 335 mph (540 km/hr). Color-wise, the GRS remains orange, not red. Currently, the reddest features on the planet are the North Equatorial Belt and the occasional dark, oval “barges” (cyclonic storms) in the northern hemisphere.
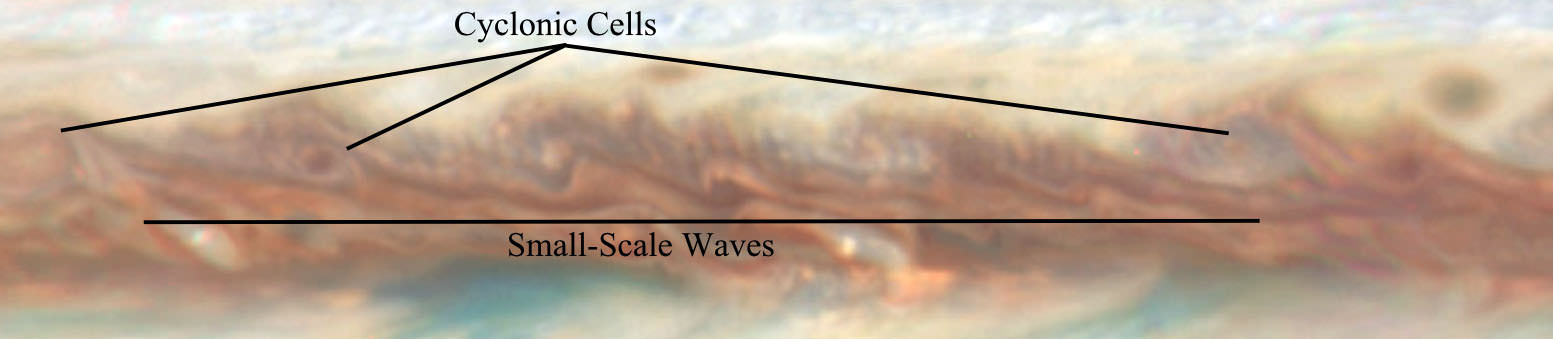
The newly-found waves in Jupiter’s atmosphere are located in regions where cyclones and anticyclones are common. They look like dark eyelashes. A cyclone is a storm or system of winds that rotates around an area of low pressure. Anticyclones spin around areas of high pressure. Credit: NASA, ESA, A. Simon (GSFC), M. Wong (UC Berkeley), and G. Orton (JPL-Caltech)
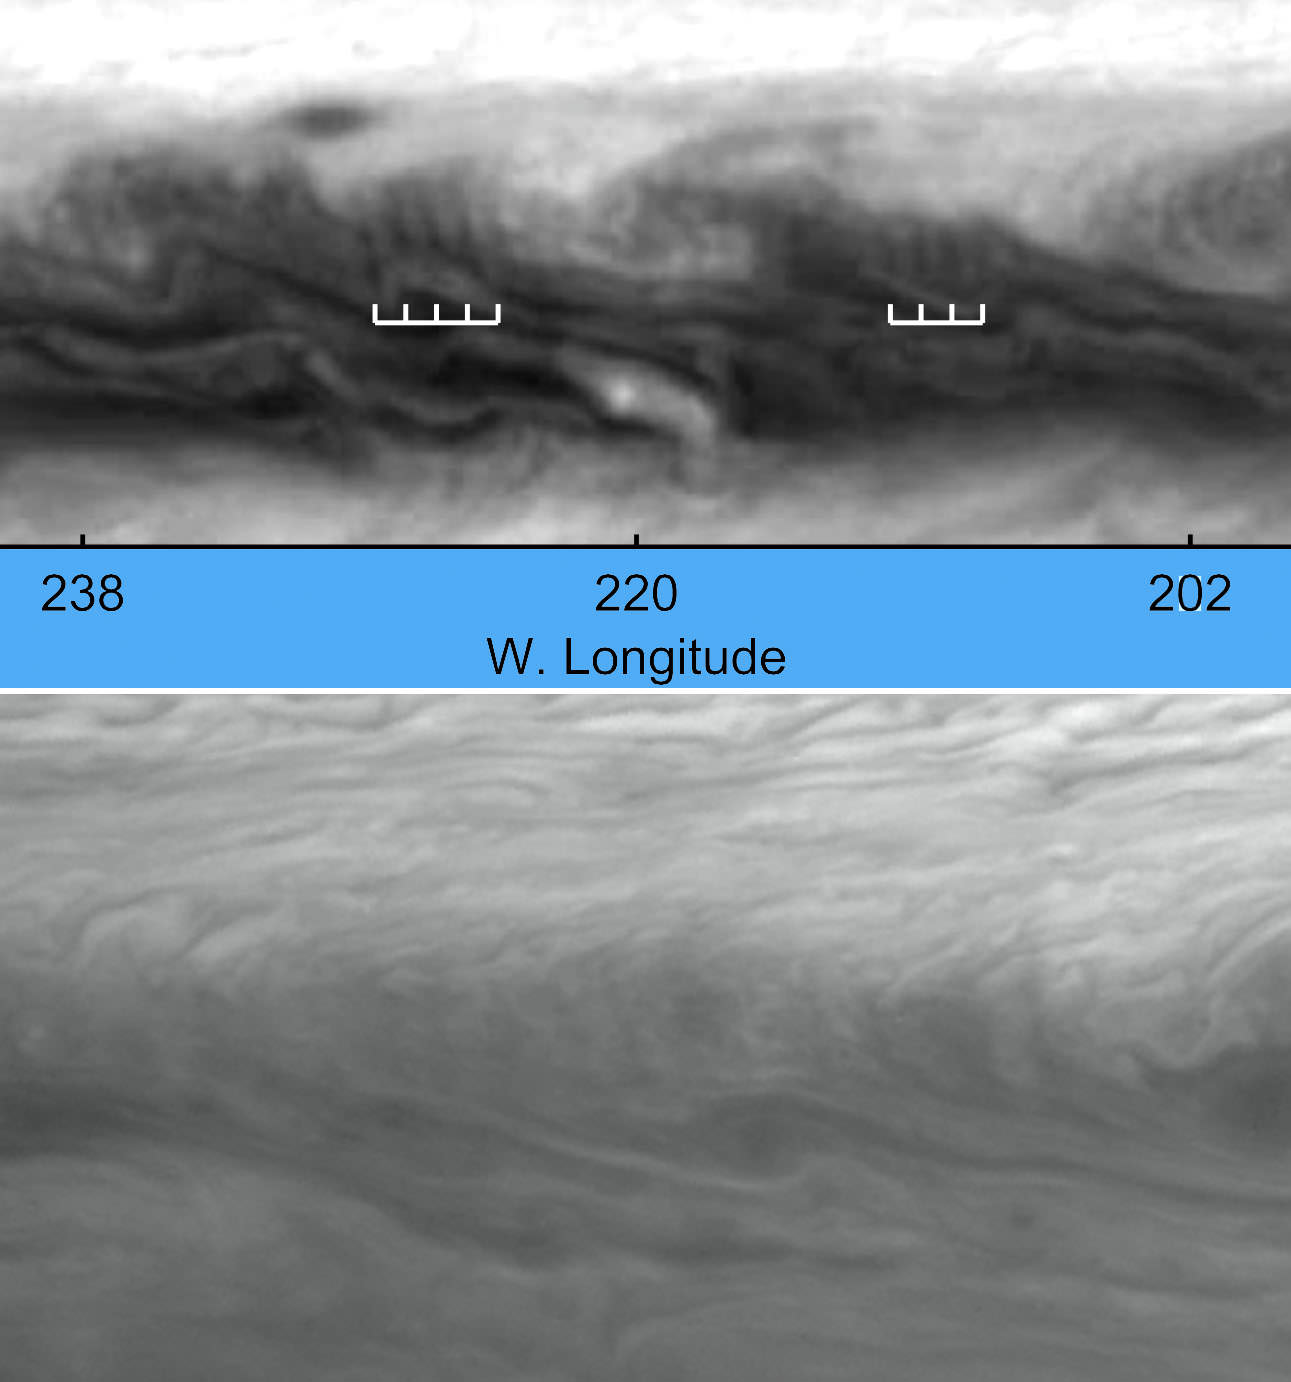
That’s not all. The photos uncovered a rare wave structure just north of Jupiter’s equator that’s only been seen once before and with difficulty by the Voyager 2 spacecraft in 1979. The scientists, whose findings are described in this just-published Astrophysical Journal paper, say it resembles an earthly atmospheric feature called a baroclinic wave,a large-scale meandering of the jet stream associated with developing storms.
Hubble view of Jupiter’s baroclinic waves on January 19, 2015 (top) and our only other view of them photographed by Voyager 2 in 1979. Credit: NASA, ESA, A. Simon (GSFC), M. Wong (UC Berkeley), and G. Orton (JPL-Caltech)
Jupiter’s “current wave” riffles across a region rich with cyclonic and anticyclonic storms. The wave may originate in a clear layer beneath Jupiter’s clouds, only becoming visible when it propagates up into the cloud deck, according to the researchers. While it’s thought to be connected to storm formation in the Jovian atmosphere, it’s a mystery why the wave hasn’t been observed more often.
The OPAL program focuses on long-term observation of the atmospheres of Jupiter, Uranus and Neptune until the end of the Saturn Cassini Mission and all four planets afterwords. We have to keep watch from Earth as no missions to Saturn and beyond are expected for quite some time. To date, Neptune and Uranus have already been observed with photos to appear (hopefully) soon in a public archive.
The sky sparkles with the Moon (top, overexposed), Regulus, Venus, Mars, and Jupiter at dawn this morning October 7, 2015.
Tomorrow morning might be a good time to call for extra celestial traffic control. A slip of a crescent Moon will join a passel of planets in the dawn sky for the first of several exciting conjunctions over the next few days.
The scene facing east about 1 1/2 hours before sunrise Thursday morning Oct. 8. Let your eyes delight in the tumble of Moon and planets. Source: Stellarium
In the space of three mornings beginning tomorrow, four planets, the Moon and the star Regulus will participate in six separate conjunctions. Here’s how it’ll play out. Time are shown in UT / Greenwich Mean Time and Central Daylight and 1° equals two full moon diameters:
October 8: Venus 2.5° south of Regulus at 18 UT (1 p.m. CDT)
October 8: Regulus 3.1° north of the moon at 19 UT (2 p.m. CDT)
October 8: Venus 0.6° north of the moon at 20 UT (3 p.m. CDT)
October 9: Mars 3.2° north of the moon at 14 UT (9 a.m. CDT)
October 9: Jupiter 2.5° north of the moon at 21 UT (4 p.m.)
October 11: Mercury 0.8° north of the moon 11 UT (6 a.m. CDT)
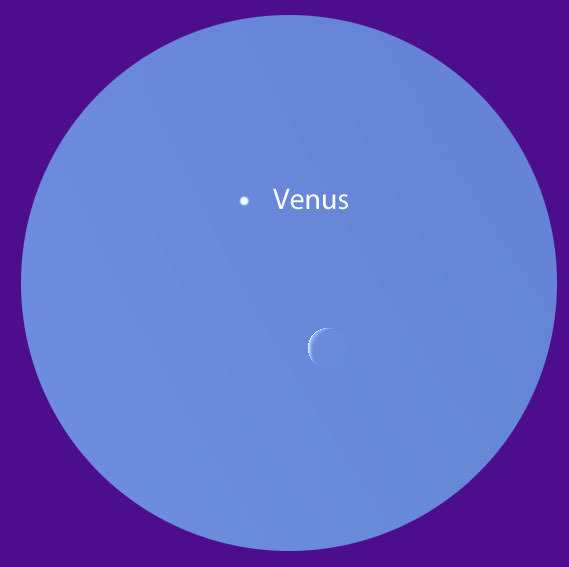
The crescent Moon will be near Venus all day Thursday for the Americas until it sets in late afternoon. What a great opportunity to catch sight of the planet in the middle of the day. This binocular view depicts their arrangement around noon CDT Oct. 8, when the planet lies less than 2° from the Moon. Source:: Stellarium
Since several of the events occur in the middle of the afternoon for skywatchers in the Americas, here’s an expanded viewing guide:
* Thursday, October 8: Skywatchers will see Venus pass 2.5° south of Leo’s brightest star Regulus with a cool crescent moon a little more than 3° to the west of the brilliant planet. If you live in Japan and the Far East, you’ll see a splendidly close conjunction of the moon and Venus at dawn on October 9, when the pair will be separated by a hair more than one moon diameter (0.6°). At nearly the same time, the moon will be in conjunction with Regulus.
Observers in Australia and New Zealand will see the Moon occult Venus in a dark sky sky before dawn (or in daylight, depending on exact location) on the 9th. Click HERE for information, times and a map for the event.
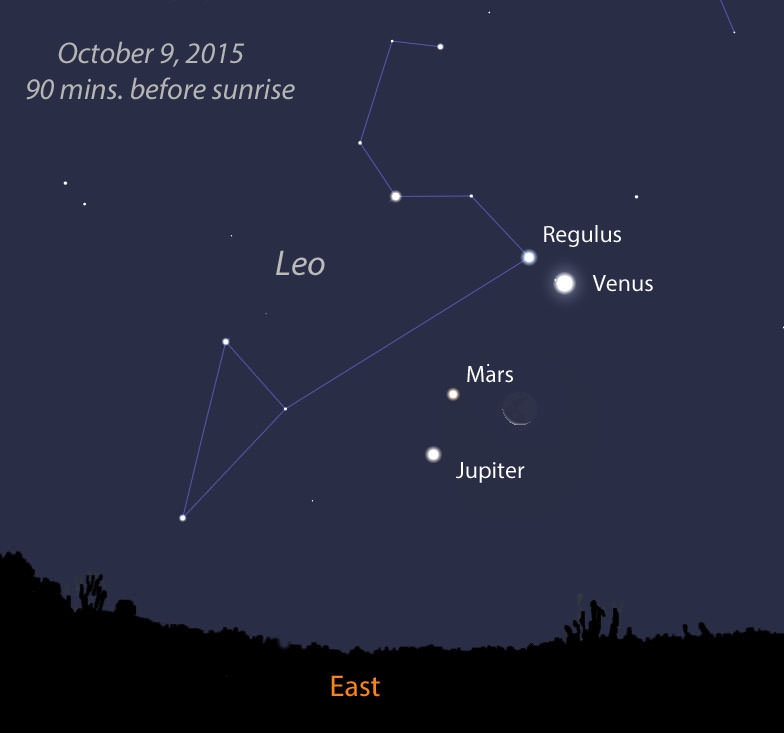
Ready to set the alarm again? The following morning, October 9, the moon makes a neat triangle with Jupiter and Mars. Source: Stellarium
* Friday, October 9: An even thinner moon passes about 3° north of Mars in the Americas at dawn and approximately 4° from Jupiter. Watch for the three luminaries to sketch a nifty triangle in the eastern sky 90 minutes to an hour before sunrise. Venus will gaze down at the planetary conclave 10° further west.
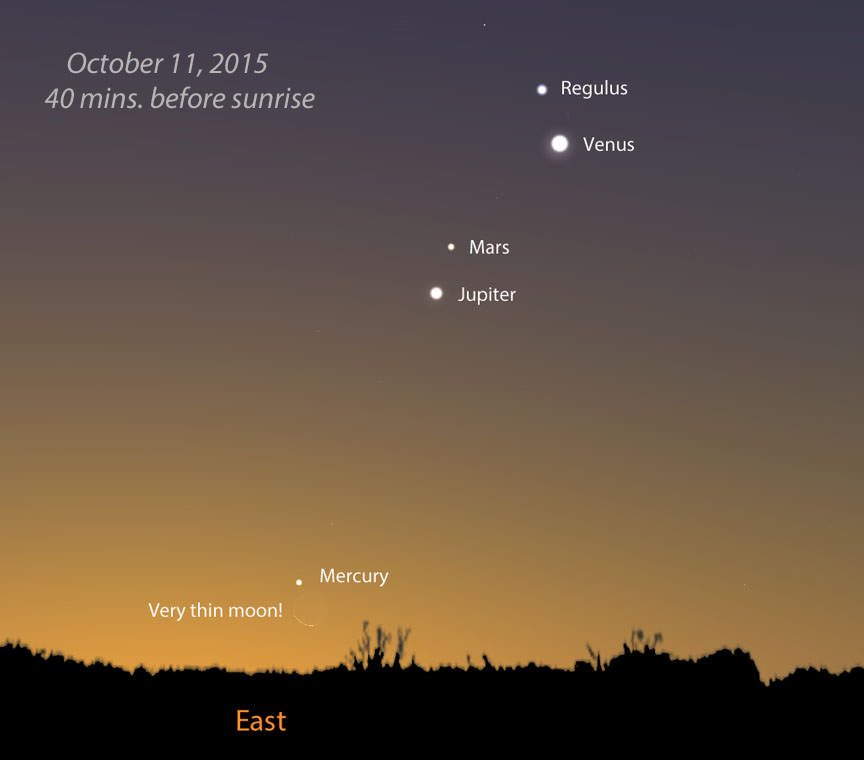
There’s not much of the Moon left by Saturday morning the 11th. The knife-edge crescent will hang less than a degree below the planet Mercury 40 minutes before sunrise. Make sure you find a spot with a good eastern horizon. Source: Stellarium
* Sunday, October 11: Mercury, which has quietly taken up residence again in the dawn sky, hovers 0.8° above a hair-thin moon this morning at 6 a.m. CDT. Best views will be about 45 minutes before sunrise, when the pair rises high enough to clear distant trees. Bring binoculars to help you spot the planet.
After a short break, Mars and Jupiter will cozy up 0.4 degree apart just before the start of dawn on October 17 CDT. Venus won’t be far away. Source: Stellarium
You’re thinking, why does this all have to happen in the morning? Thankfully, sunrise occurs around 7 a.m. for many locations, so you can see all these cool happenings in twilight around 6 a.m. — not terribly unreasonable. And now that the The Martian has finally hit the movie theaters, what better time to see the planet in the flesh? By pure coincidence, the location of stranded astronaut Mark Watney in the fictional account — Acidalia Planitia (Mare Acidalium) — will be facing dawn risers across the Americas and Hawaii this week.
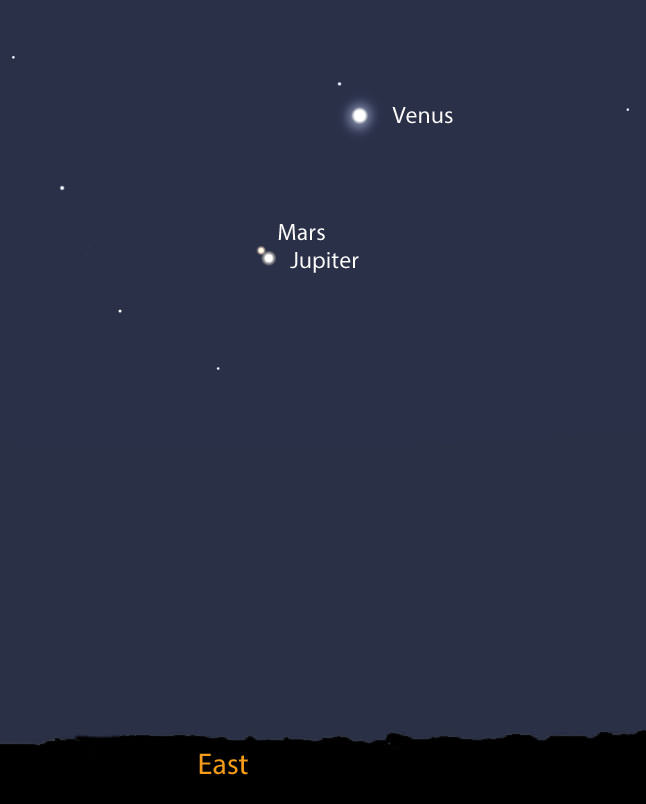
October wraps up with a tight trio of three planets before dawn. It will be the closest gathering of three planets since May 27, 2013. The next won’t happen till January 10, 2021. Source: Stellarium
Dare I say this string of continuous conjunctions is only a warm-up for more to come? Earth’s revolution around the Sun quickly brings Jupiter higher in the eastern sky, while Mars races eastward as if on a collision course. The following Saturday on October 17, the two will meet in conjunction less than 1/2 degree (one Full Moon width) apart. Very nice!
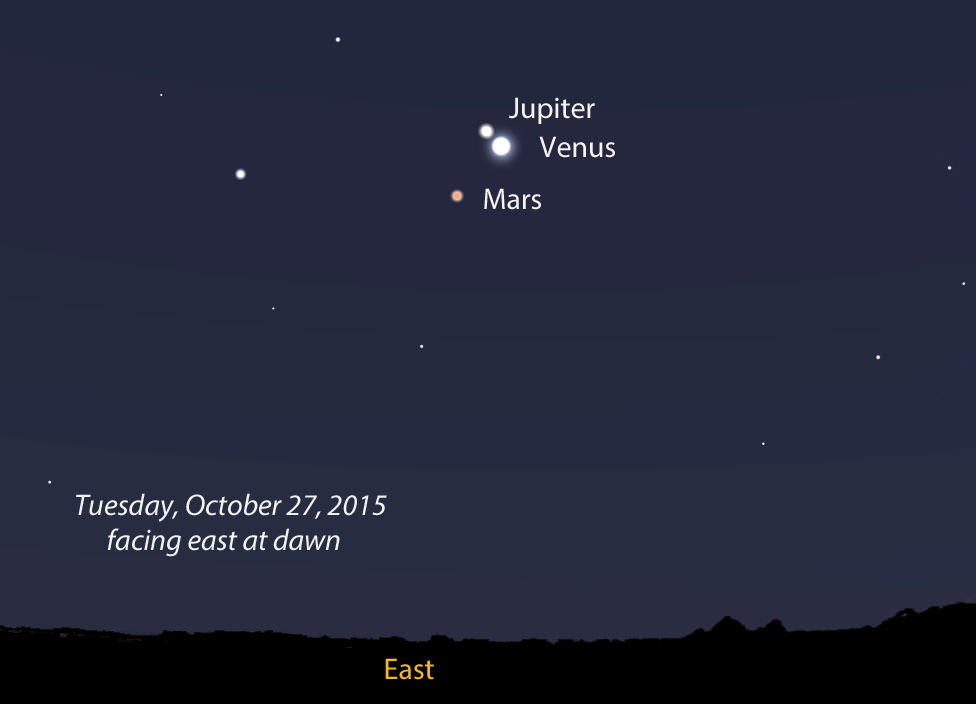
But it gets even better. On Tuesday morning, October 27, you’ll see all three planets huddle at dawn. One degree will separate Jupiter and Venus with Mars bringing up the rear several degrees further east. Feast on the view because there won’t be a more compact arrangement of three planets again until January 10, 2021.
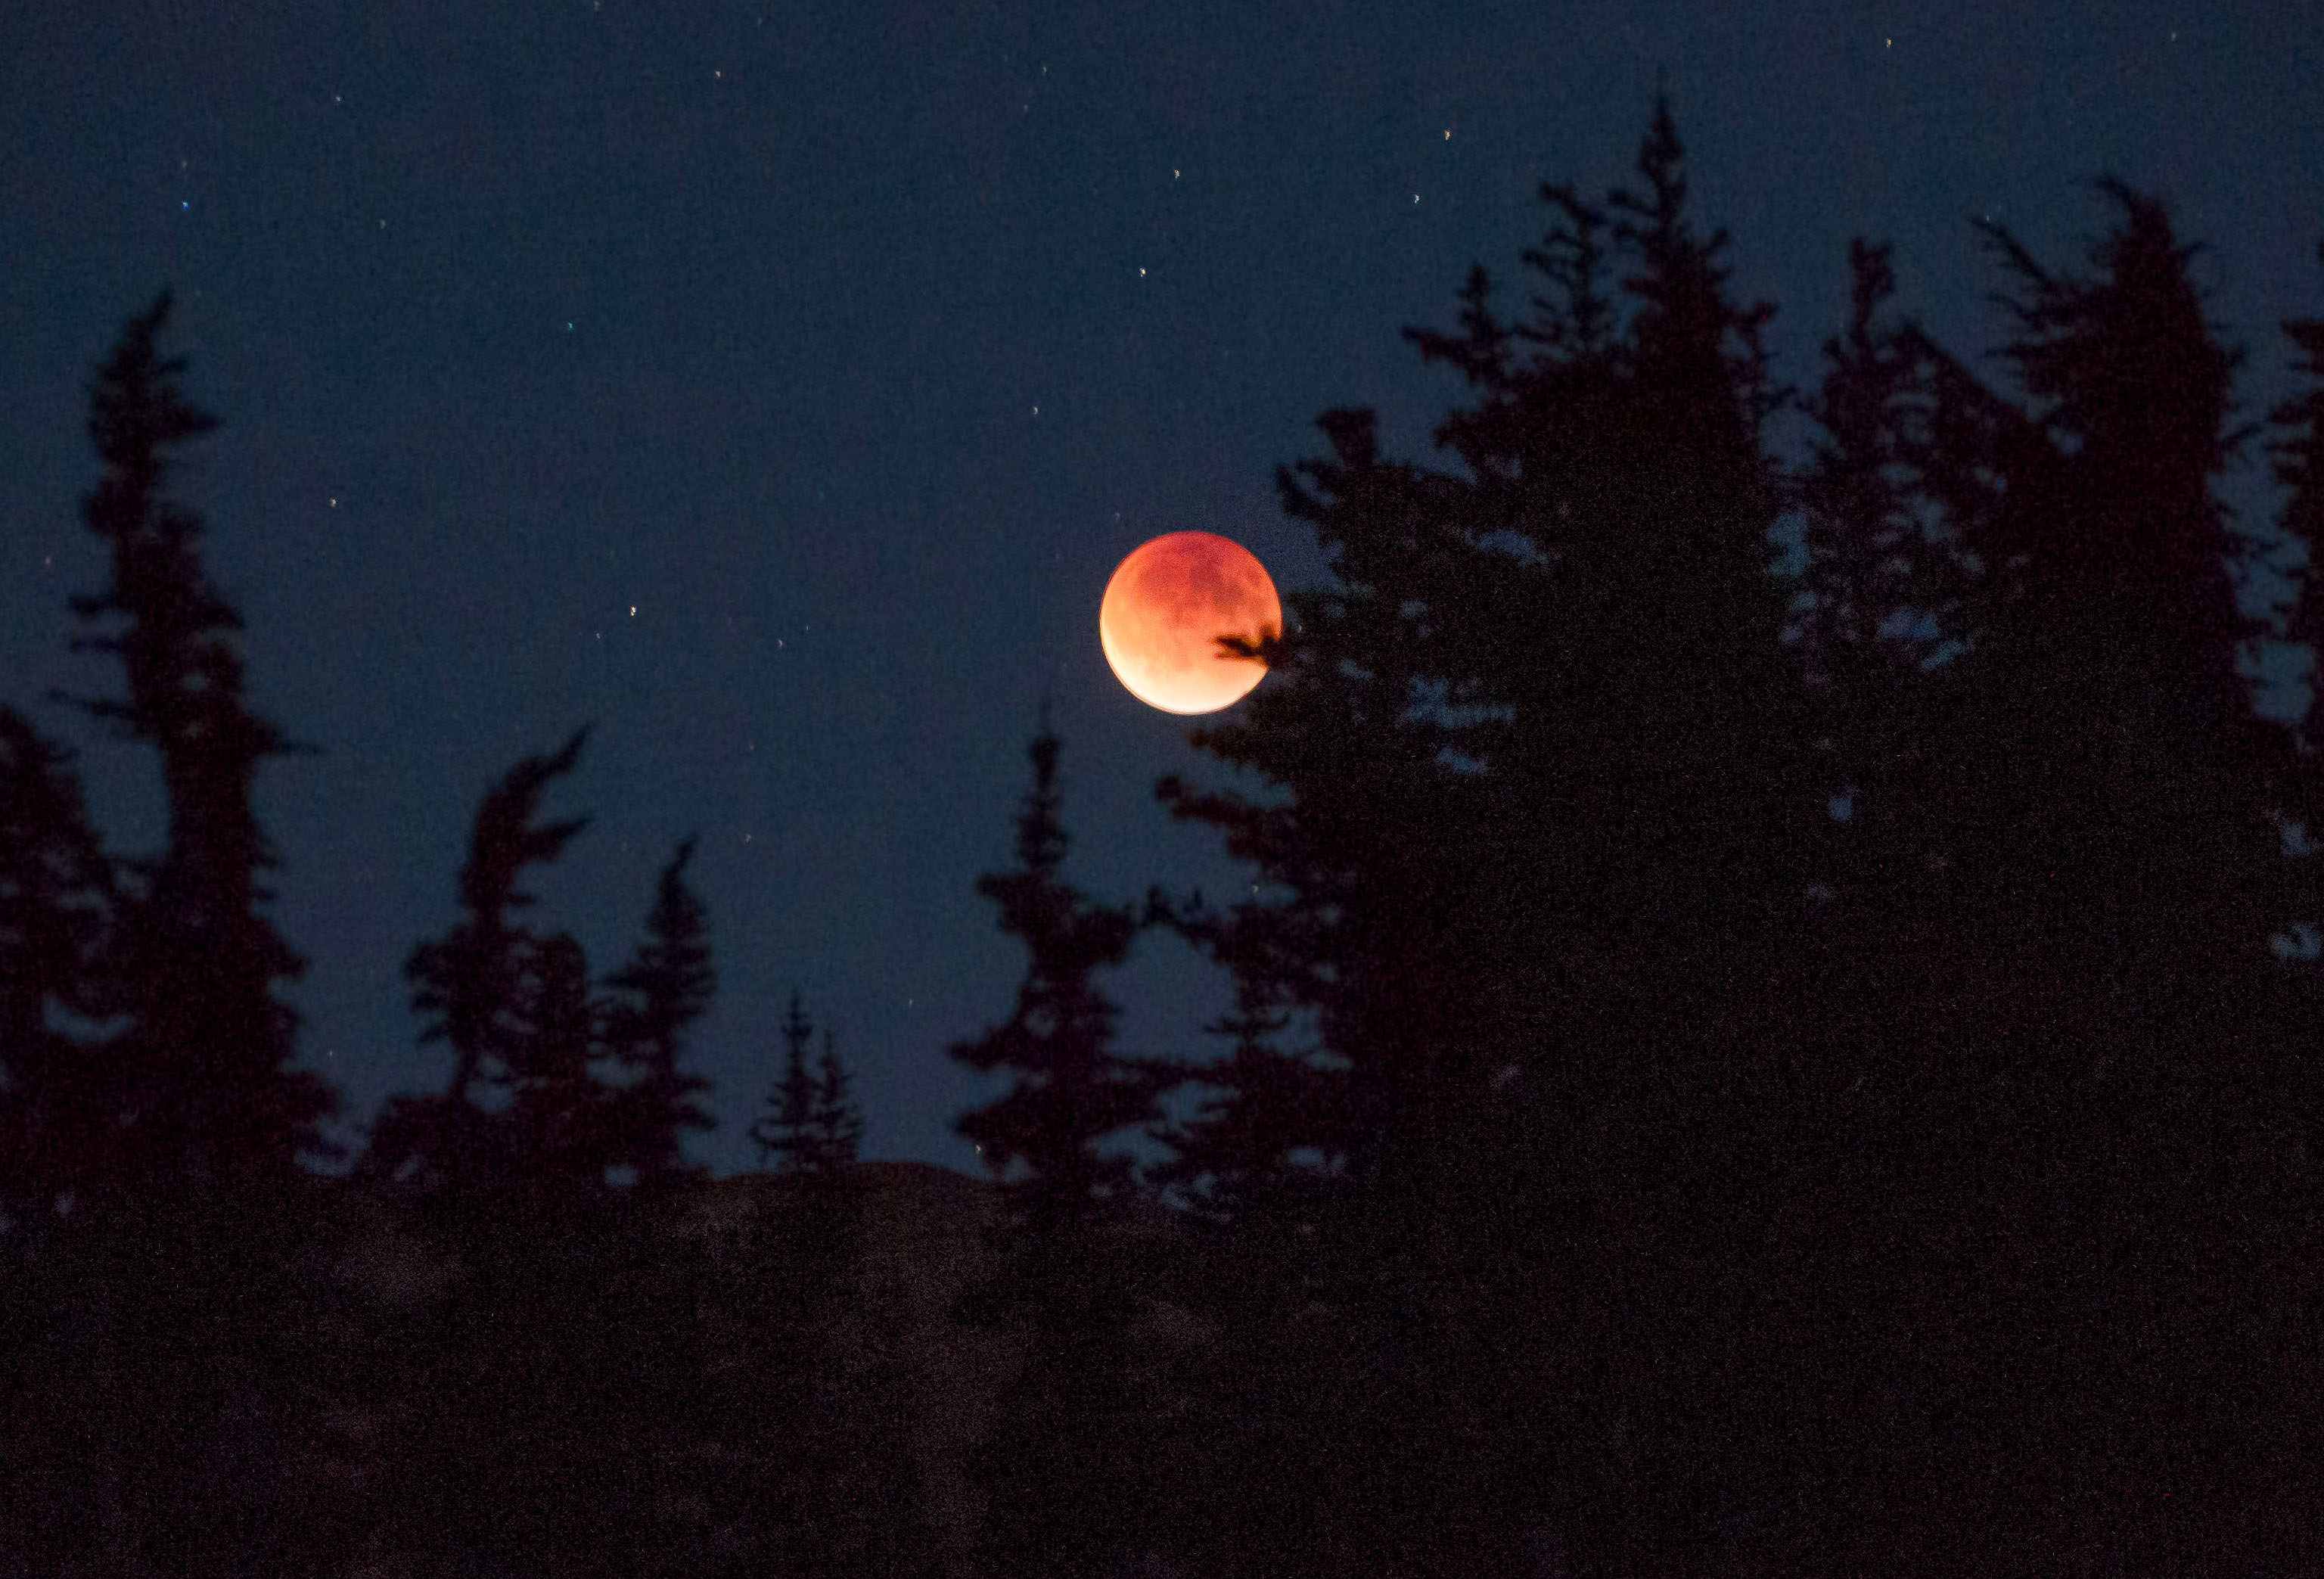
The September 17, 2015 total lunar eclipse - the last of the recent tetrad of lunar eclipses over the past 17 months - was darker than expected. Several factors described below were in play. This photo was taken in Washington's Olympic National Park. Credit: Rick Klawitter
First off, a huge thank you to everyone who made and sent their Danjon scale estimate of the totally-eclipsed Moon’s brightness to Dr. Richard Keen, University of Colorado atmospheric scientist. Your data were crucial to his study of how aerosols in Earth’s atmosphere and other factors influence the Moon’s appearance.
Grateful for your help, Keen received a total of 28 observations from 7 different countries.
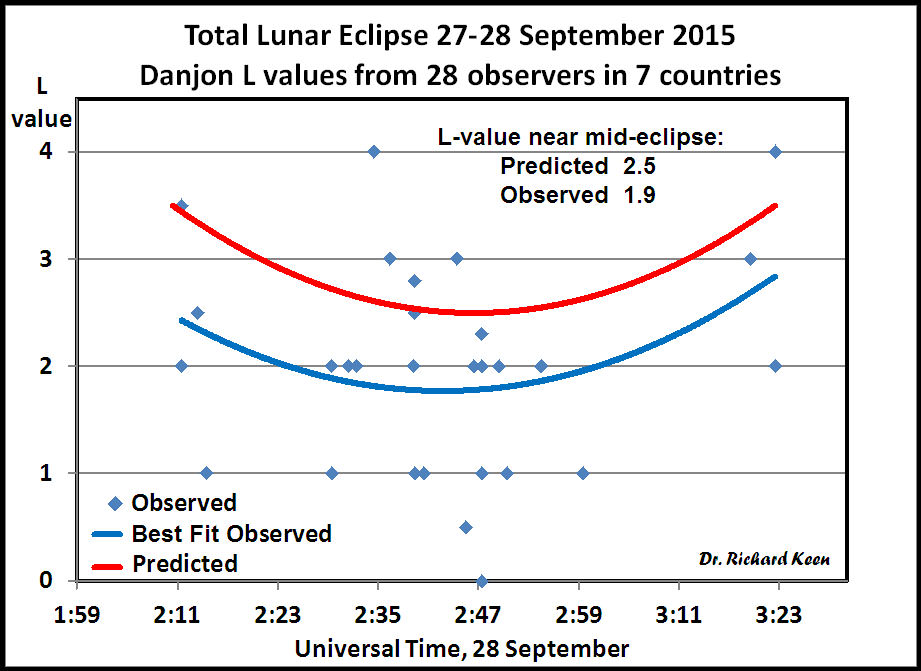
Graph created by Dr. Richard Keen plotting Danjon L values submitted by Universe Today readers and others that compare predicted values (top curve) with observed values. The Moon was about half as bright during totality as expected with L=1.9. Credit: Dr. Richard A. Keen
Using the Danjon information and estimates of the Moon’s brightness using the reverse binocular method, Keen crunched the data and concluded that the Moon was about 0.6 L (Danjon) units darker than expected and 0.4 magnitude dimmer, a brightness reduction of 33%. This agrees well with my own observation and possibly yours, too. No wonder so many stars sparkled near the Moon that night.
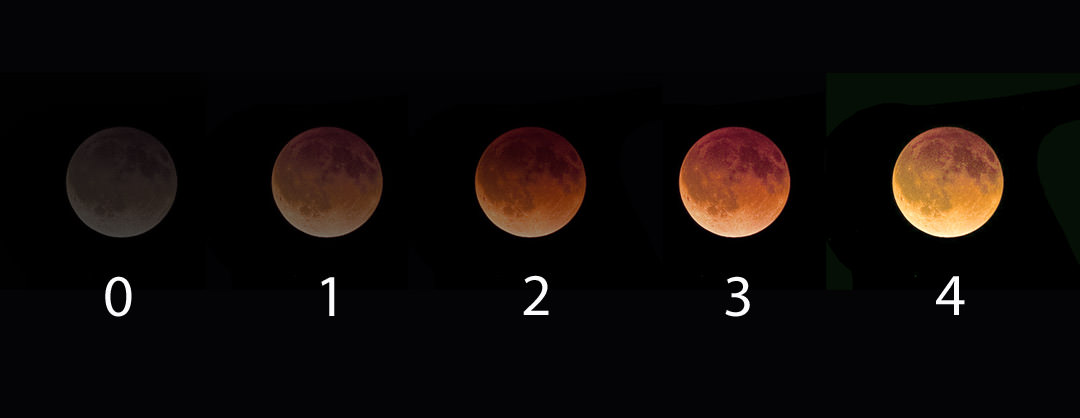
Lunar eclipse brightness is rated on the Danjon scale where “0” equals a dark gray totality and “4” a bright, coppery yellow. Credit: Bob King
I think it’s safe to say, most of us expected a normal or even bright totality. So why was it dark? Several factors were at play — one to do with the Moon’s location in Earth’s shadow, the other with a volcanic eruption and a third with long-term, manmade pollution.
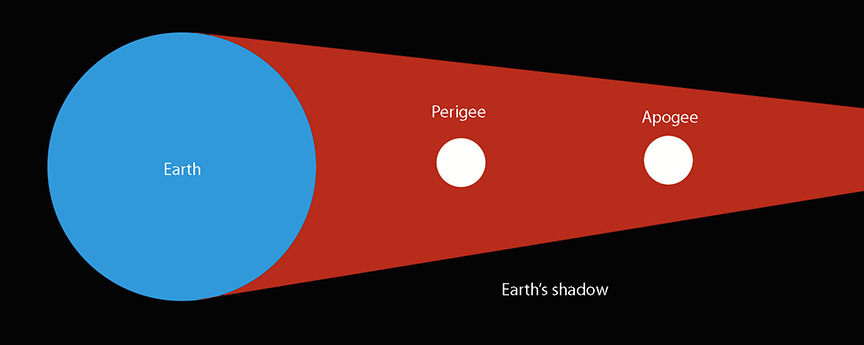
During a perigean eclipse, the Moon passes more deeply into Earth’s shadow compared to one that happens near apogee, when the moon is most distant from Earth. Moon distances not to scale and for illustration only. Credit: Bob King
You’ll recall that the eclipse occurred during lunar perigee, when the Moon swings closest to Earth in its 27-day orbit. Being closer, it also tracked deeper into Earth’s umbra or inner shadow which narrows the farther back of the planet it goes. An apogean Moon (farthest from Earth) passes through a more tapered cone of darkness closer to the penumbra, where sunlight mixes with shadow. A Moon nearer Earth would find the umbral shadow roomier with the light-leaking penumbra further off in the distance.
On April 24, 2015, NASA’s Terra satellite acquired this photo of the ash and gas plume from Calbuco volcano in southern Chile. Credit: NASA
But there’s more. Working independently, Steve Albersof NOAA and Brazilian astronomer Helio Vital suggested another reason: aerosols in the atmosphere. “Earth’s stratosphere is no longer completely clean of volcanic ashes,” said Vital in an e-mail communication. “In fact, lingering aerosols (ash, dust, sulfuric acid droplets) from the explosion of Calbuco five months ago may be to blame for that excessive darkening.”
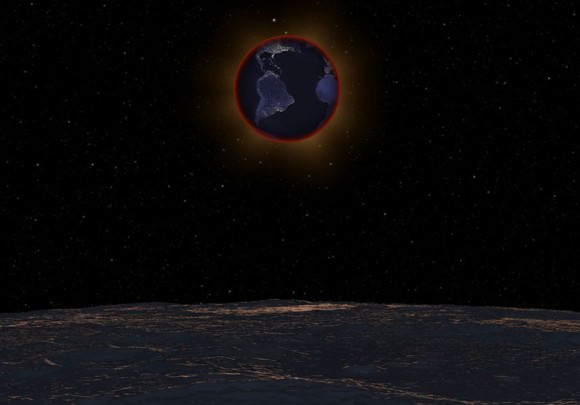
With the lunar horizon in the foreground, the Earth passes in front of the Sun on September 27, 2015 in this simulation, revealing the red ring of sunrises and sunsets along the limb of the planet responsible for illuminating the Moon during the eclipse. The clarity of the stratosphere at eclipse time can greatly affect lunar brightness during totality. The Earth and Sun are in Virgo for observers on the Moon with the bright star Beta Virginis at top. Click to see the video. Credit: NASA’s Scientific Visualization Studio
While much of the debris blasted into the stratosphere made for colorful sunsets in the southern hemisphere, some of that material has likely made its way to the northern hemisphere. Albers has noticed an increase in yellow and purple sunsets in his home town of Boulder in recent months, telltale signs of volcanic spew at play.
Forest fires that raged across the western states and Canadian provinces all spring and summer may also have contributed. Most of that smoke usually stays in the lower part of the atmosphere, but some may have found its way to the stratosphere, the very layer responsible for transmitting most of the sunlight that falls into Earth’s shadow and colors the moon.
Graph showing magnitude estimates of the Moon’s brightness during totality using the reverse binocular method. The predicted magnitude was -1.7 (a little brighter than Sirius) vs. the observed -1.3. Credit: Dr. Richard A. Keen
Sunlight has to pass through these light-absorbing minerals and chemicals on its way through the atmosphere and into Earth’s shadow. Less light means a darker moon during total eclipse. Coincidentally, much of the totally eclipsed Moon passed through the southern half of the umbra which “increased the effectiveness of the Calbuco aerosols (which are still more concentrated in the southern hemisphere than the northern) at dimming the light within the umbra,” writes Keen.
Oceanus Procellarum and Mare Imbrium are large, dark volcanic plains that contributed to the Moon’s faintness and dark-hued totality. Credit: Bob King
It also so happened that the darkest part of the moon coincided with two vast, dark volcanic plains called Oceanus Procellarum (Ocean of Storms) and Mare Imbrium, artificially enhancing the overall gloom over the northern half of the Moon.
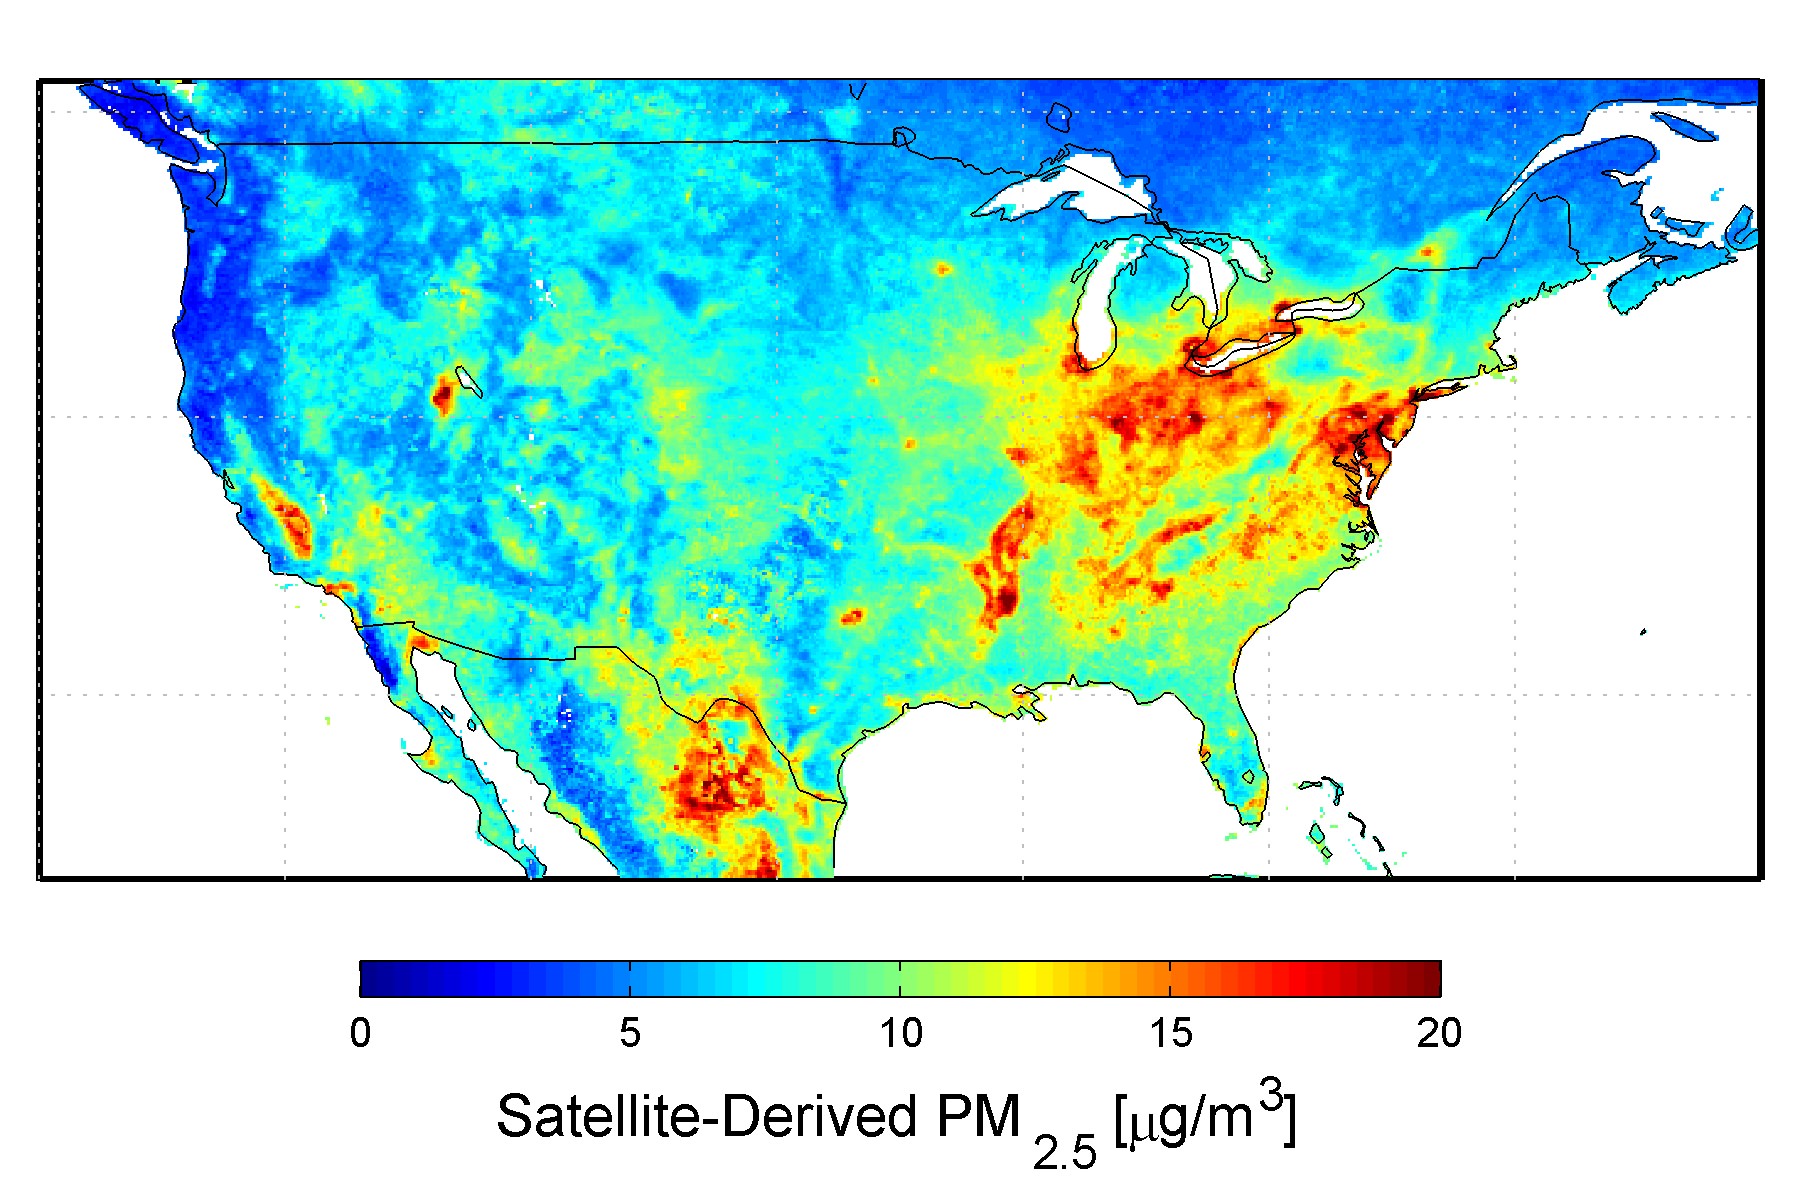
U.S. satellite-derived map of PM2.5 (fine particulate matter which includes sulfates and soot) averaged over 2001-2006. Credit: Dalhousie University, Aaron van Donkelaar
Finally, the human hand may also have played a role in lunar color and brightness. The burning of coal and oil has caused a gradual increase in the amount of human-made sulfate aerosols in the atmosphere since the start of the industrial revolution. According to NASA, at current production levels, human-made sulfate aerosols are believed to outweigh the naturally produced sulfate aerosols. No surprise that the concentration of aerosols is highest in the northern hemisphere where most industrial activity is found.
Isn’t it fascinating that one blood-red Moon can tell us so much about the air we breathe? Thank you again for your participation!
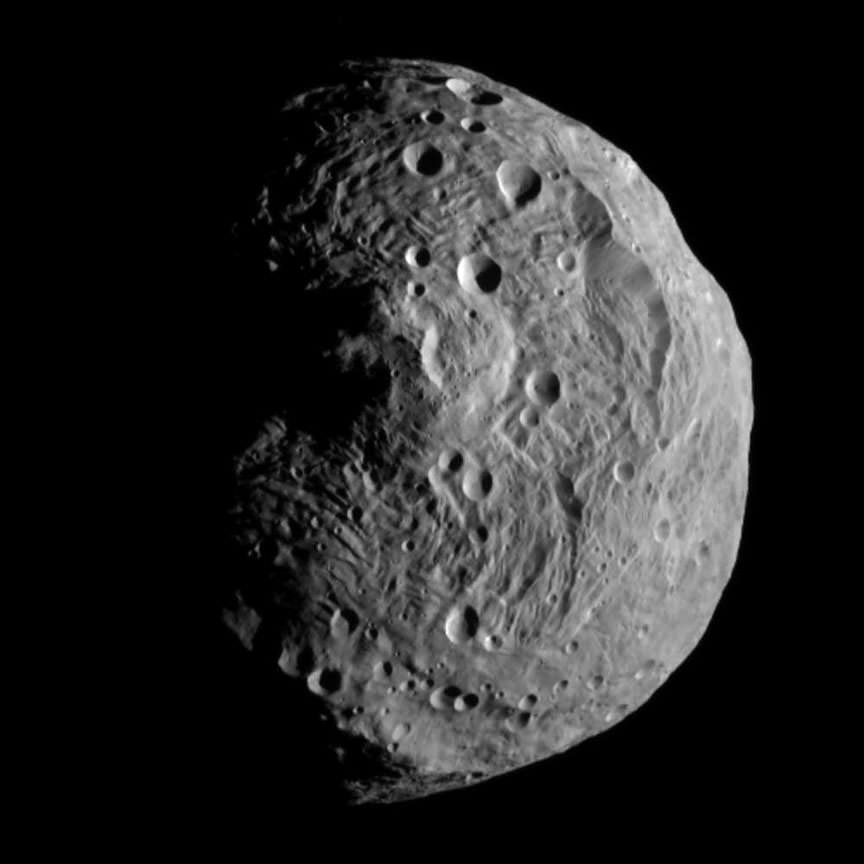
The planetoid Vesta, which was studied by the Dawn probe between July 2011 and September 2012. Credit: NASA
The brightest asteroid visible from Earth prowls across Cetus the Whale this month. Vesta shines at magnitude +6.3, right at the naked eye limit for observers with pristine skies, but easily coaxed into view with any pair of binoculars. With the moon now gone from the evening sky, you can start your search tonight.
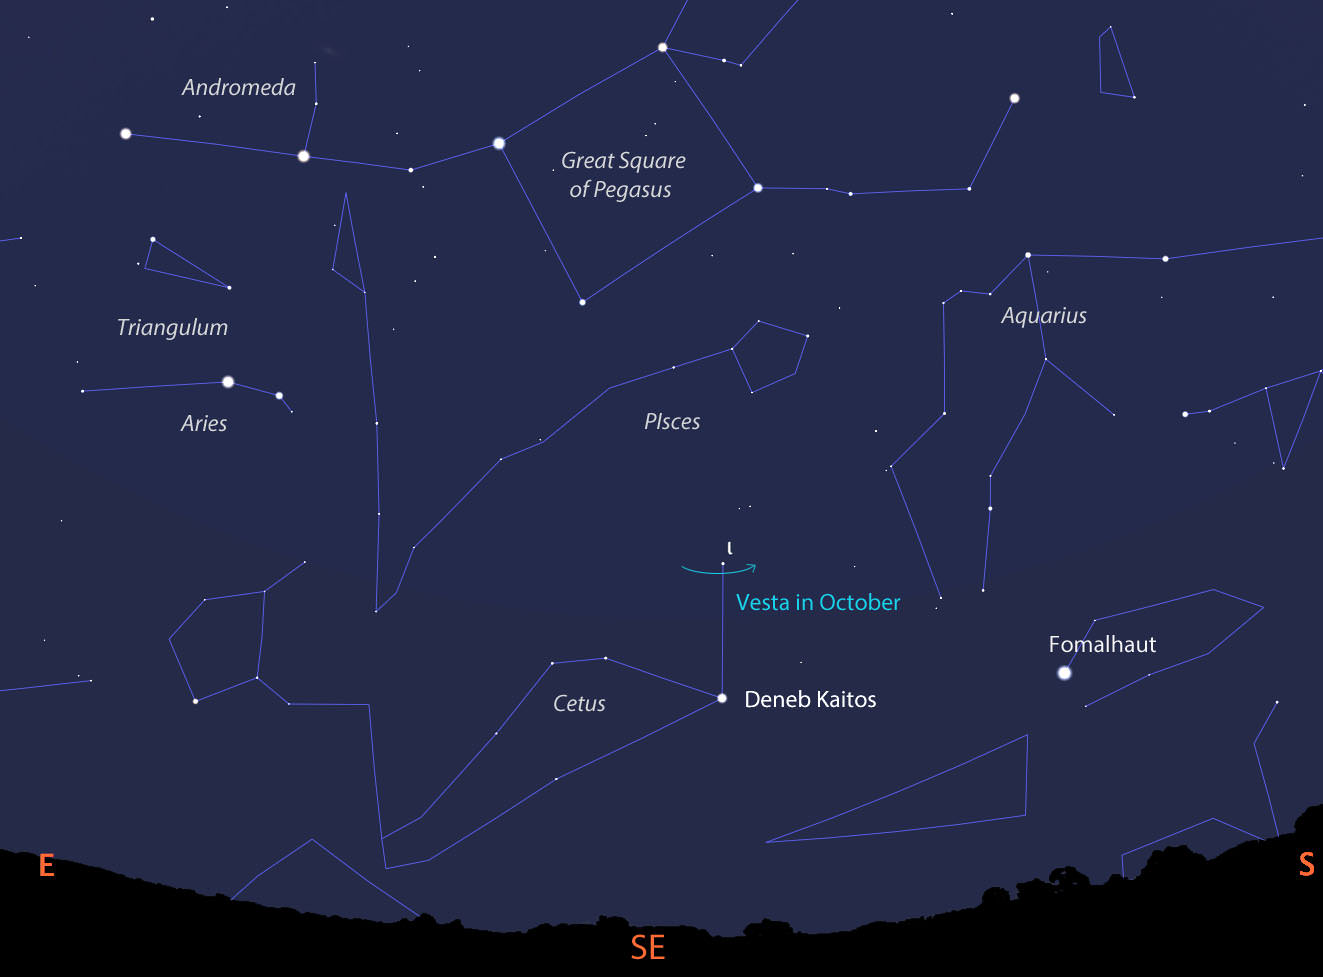
Facing southeast around 10 p.m. local time in early October. 4 Vesta — its formal designation as the fourth asteroid discovered — travels along a short arc south of the easily-found star, Iota Ceti. Shoot a line from the Square of Pegasus south to arrive at Deneb Kaitos, Cetus’ brightest star, and from their to Iota Ceti and Vesta. Detailed map below. Source: Stellarium
Vesta came to opposition on September 28 and remains well-placed for viewing through early winter. Today’s it’s 134 million miles (225 million km) from Earth or about 5 million miles farther the Mars’ average distance from us. Although it’s one of the largest asteroids in the inner asteroid belt between Mars and Jupiter with a diameter of 326 miles (525 km), it never appears larger than a point of light even in many professional telescopes. Your binocular view will be as satisfying as the one through Mt. Palomar.
Like an inverted belly button, a spectacular central peak more than 14 miles high rises from the 310-mile-wide crater Rheasilvia. Credit: NASA
Discovered by the German astronomer Heinrich Olbers in March 1807, Vesta was named for the Roman goddess of home and hearth. NASA’s Dawn spacecraft, currently in orbit around another asteroid, Ceres, visited Vesta between July 2011 and September 2012, taking thousands of close-up images and measuring the mineral make-up of its soil and crust. We learned a few things while we were there:
Vesta is differentiated into crust, mantle and core just like the bigger planets are. That’s why you’ll sometimes hear it described as a “protoplanet”, the first of its kind discovered in our solar system.
A class of igneous meteorites fallen to Earth called Howardites, eucrites and diogenites (HED-meteorites) were confirmed as actual pieces of the asteroid that found their way here after being blasted into space by impact.
Some of the meteorites / rocks that pelted the asteroid from elsewhere in the solar system are water-rich.
Vesta’s covered in craters like the moon
A staggering-large 310-mile-wide (500 km) impact crater named Rheasilvia marks its south pole. The basin’s central peak rises to 14.3 miles (23 km), more than twice the height of Mt. Everest.
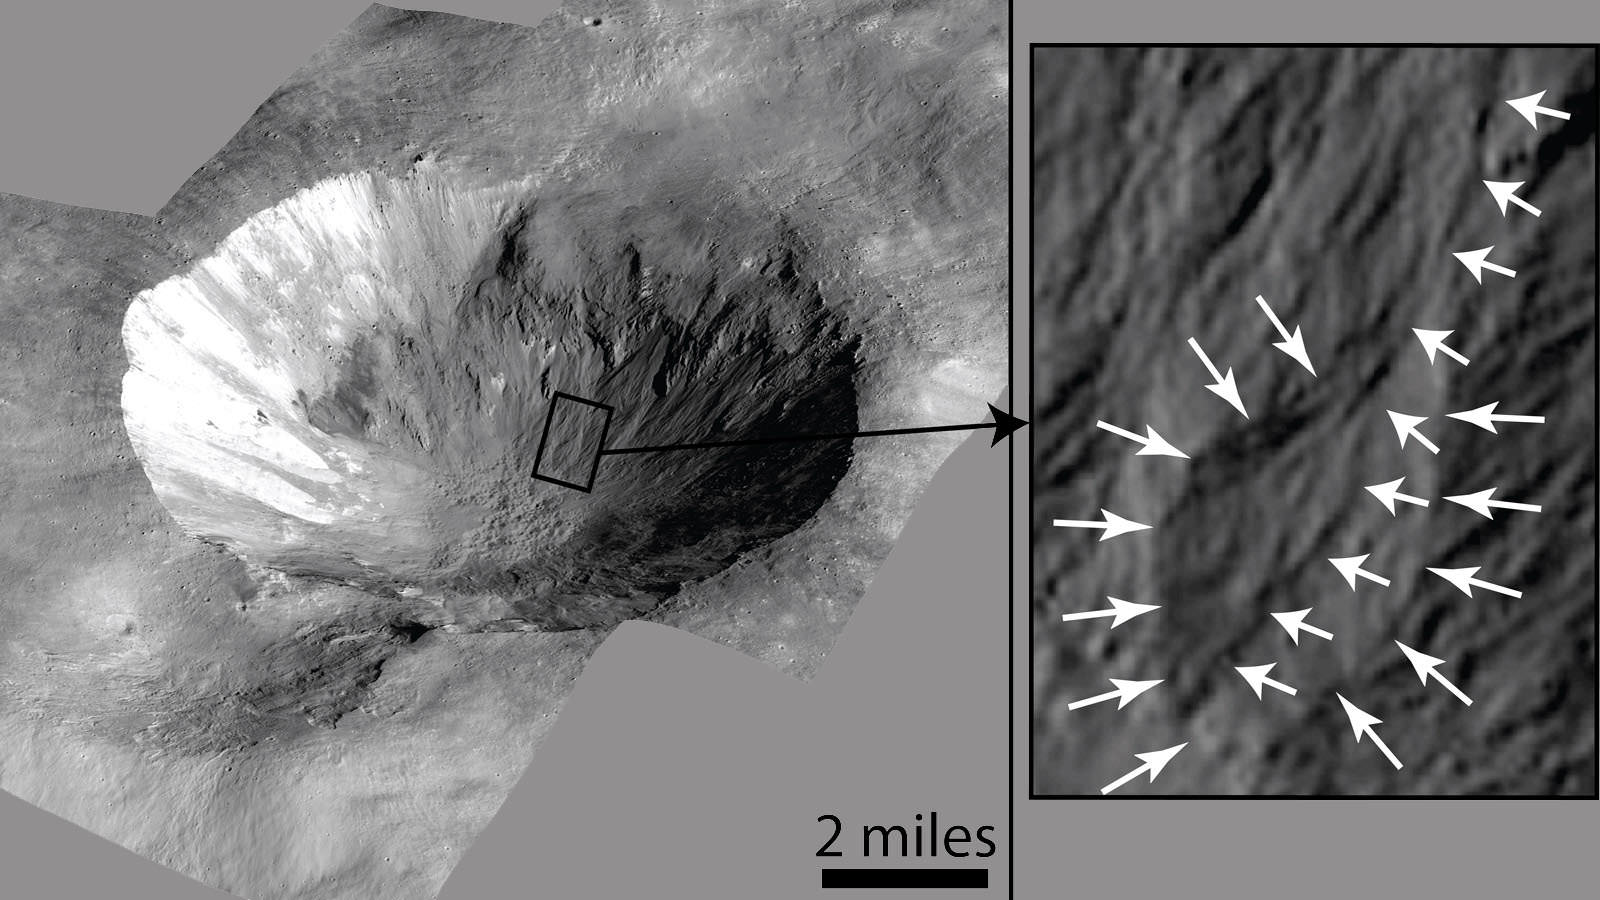
Cornelia Crater on the asteroid Vesta. The crater is about 4 to 5 million years old. On the right is an inset image showing an example of curved gullies that may have been carved by water, indicated by the short white arrows, and a fan-shaped deposit, indicated by long white arrows. The inset image is about 0.62 miles (1 km) wide. Credit: NASA/JPL-Caltech/UCLA/MPS/DLR/IDA
You can see it all in your mind’s eye the next clear night. For skywatchers at mid-northern latitudes, Vesta climbs into good view around 10 o’clock in early October and 8 o’clock by month’s end. If you’re familiar with gangly Cetus, you can start with the 2nd magnitude star Deneb Kaitos, the brightest star in the constellation. If not, begin your Vestan voyage from the Great Square in Pegasus, high in the southeastern sky.
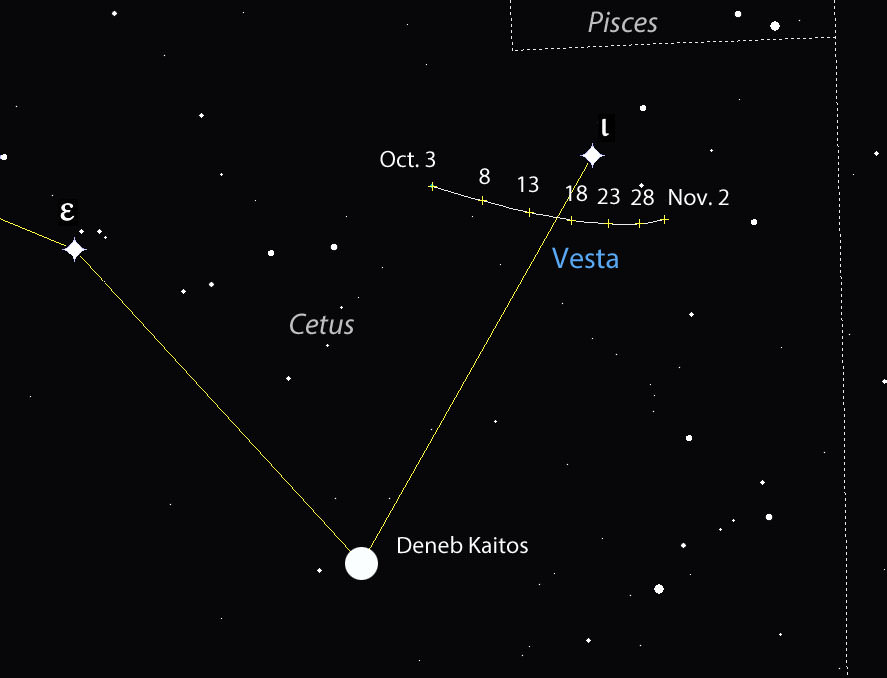
Once you’ve arrived at Deneb Kaitos, locate Iota Ceti, 10 degrees to the northwest. The star makes finding Vesta easy in binoculars this month. Stars shown to magnitude +7. North is up and the asteroid’s position is marked every 5 days at 10 p.m. Vesta fades slowly during the month to mag. 6.8 by Nov. 1. CDT. Source: Chris Marriott’s SkyMap software
Drop a line through the two stars along the left side of the Square and continue it down toward the southern horizon. You’ll run right into DK. Now elevate your gaze — or aim your binoculars — one outstretched fist (10°) or about two binocular fields of view above and right of Deneb Kaitos to find Iota Ceti (mag. 3.6).
Once you’ve got Iota, the asteroid will be in your field of view close by. Use the detailed chart to pinpoint its location with respect to Iota. Easy, right? Well, I hope so. Bon voyage to Vesta!
The new nova in Sagittarius is located just above the Spout in the Teapot and shines at about magnitude +9 this week - visible in a small telescope. Credit: Bob King
A nova farmer would do well in the fields of Sagittarius. Four nights ago on September 27, Japanese amateur Koichi Itagaki plucked another “new star” from its starry furrows, the third nova discovered there this year!
For a few days, it was informally called Nova Sagittarii #3, but today received the official title of V5669 Sagittarii. Like the others, this one’s bright enough to see in a small telescope.
Itagaki first recorded it in his patrol camera at magnitude +9.5. The universe conceals so many of its greatest conflagrations as points of light that go from faint to bright. Novae are no exception. Such is the amateur observer’s lot. We need bring a mental picture, knowledge and a bit of imagination to the table to appreciate this bits of light that go boom in the night.
Use this wide finder map of Sagittarius to get a general idea of the nova’s location. Lucky for us, it’s in the same low power field of view of the pretty cluster-dark nebula combo NGC 6520 and Barnard 86, the Inkspot Nebula. Source: Stellarium
Novae occur in binary star systems where a tiny but gravitationally-powerful white dwarf star pulls gases from a close companion star. The material piles up in a thin layer on the dwarf’s hot surface, fuses and burns explosively in a brilliant display of light. Suddenly, a star that may have been 15th or 20th magnitude flares brightly enough to see in a Walmart telescope.
Nova illustration with an expanding cloud of debris surrounding central fireball emitting red hydrogen-alpha light.
October’s not exactly prime time for viewing Sagittarius for mid-northern observers. By late evening twilight, it’s already in low in the southwestern sky. But if you can find an opening in that direction or if you’re lucky enough to have a 15-minute-wide gap between the trees like I do, you can spot this sucker. I set up my scope shortly before 8 o’clock or about an hour after sundown. Western Sagittarius remains in reasonably good view for about another hour.
Start at the Gamma Sagittarii and star hop from there to Gamma 1 and then north to the small star cluster NGC 6520 and adjacent dark nebula Barnard 86. You may not see the nebula because of atmospheric extinction at low altitude, but the cluster stands out well. A magnitude 7 star lies along its northwestern edge, and the nova is just 1/2 degree from there. If you have a go-to scope, its celestial coordinates are: R.A. 18 hours 3.5 minutes, Dec. -28 degrees 16 minutes.
AAVSO chart showing the location of V5669 Sgr. North is up. I’ve added the star cluster NGC 6520 and Barnard 86. To create your own customized charts of the nova, go to aavso.org, type in the star’s name and select “Create a finder chart”. Credit: American Assn. of Variable Star Observers (AAVSO)
To precisely pinpoint the nova, use the AAVSO chart, which also includes comparison stars with their magnitudes labeled (but without the decimal point). Do you notice any color? Photos show it as pale red from the emission of hydrogen-alpha light in the deep red of the visual spectrum. Novae often emit H-alpha especially in their early, hot “fireball” stage as gases are rapidly expanding from the explosion into space.
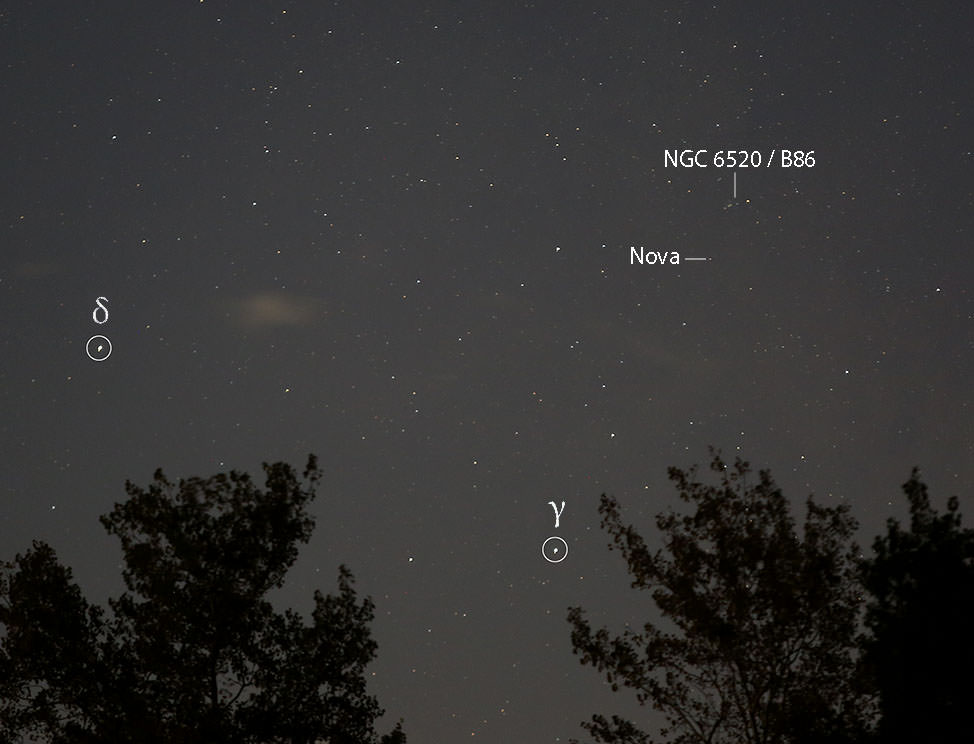
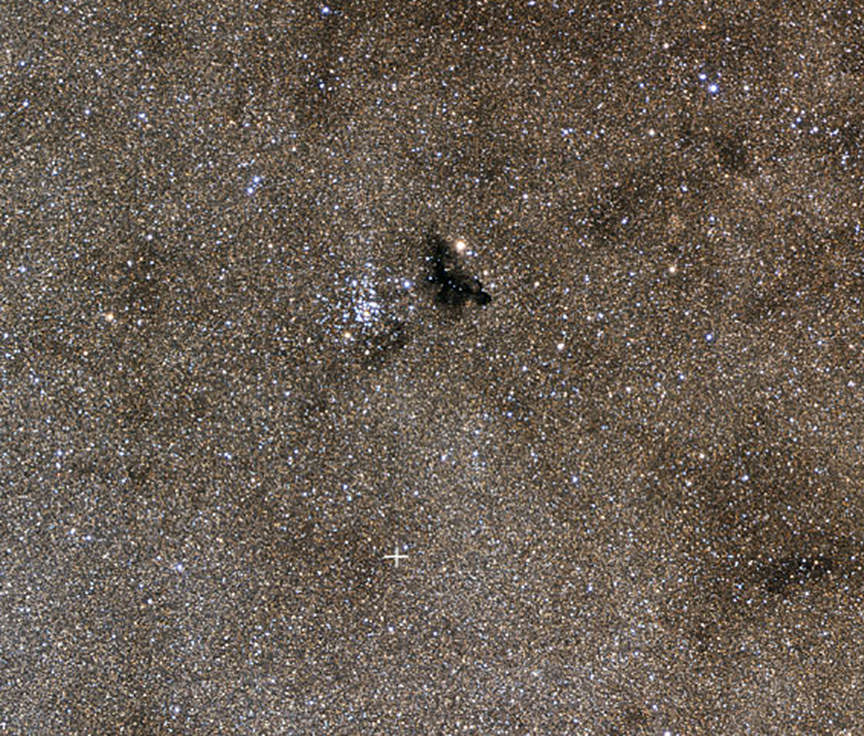
The pretty star cluster NGC 6520 and Ink Spot Nebula Barnard 86. The cross shows the location of the nova. The star field may look intimidating, but this time exposure photo reveals minions more than are visible in an amateur telescope. Credit: Johannes Schedler / panther-observatory.com
No telling what the star will do in the coming days. That’s what makes novae and variable stars in general so much fun to watch. I caught the star Monday night September 28 at magnitude +8.6. The following night it dropped to 9.3 and then edged back up to 9.2 last night. Astronomers study these fluctuations to understand a nova’s behavior and evolution. I can’t wait to see what it’s doing tonight.
One thing I really like about this nova is its location so near a pretty pair of deep sky objects. On your way to this amazing pinprick of light, stop by the cluster and dark nebula for a final farewell to the summer season.