Black Holes Spin Outta’ Control

An artist’s impression of the jets emerging from a supermassive black hole at the center of the galaxy PKS 0521-36. Credit: Dana Berry / STScI

[/caption]

“Down in a hole and they’ve put all the stones in their place. I’ve eaten the sun so my tongue has been burned of the taste…” For the first time the evolution of the spin of the supermassive black holes has finally been examined. New research hints that supermassive black holes enlarged by swallowing matter will barely show spin, while those that merge with other black holes take on a rapid spin rate. Outta’ control? Let’s check the evidence.

Dr Alejo Martinez-Sansigre of the University of Portsmouth and Prof. Steve Rawlings of the University of Oxford made the new discovery by using radio, optical and X-ray data. Their findings were that giant black holes are – on the average – spinning faster than ever. With masses anywhere between a million and billion times that of the Sun, the net they weave isn’t visible to the eye – but the accretion disk is. The material becomes superheated, emitting X-rays detectable by space-telescopes. And, like great rock music, they emit some powerful radio waves able to be picked up by terrestrially based equipment.

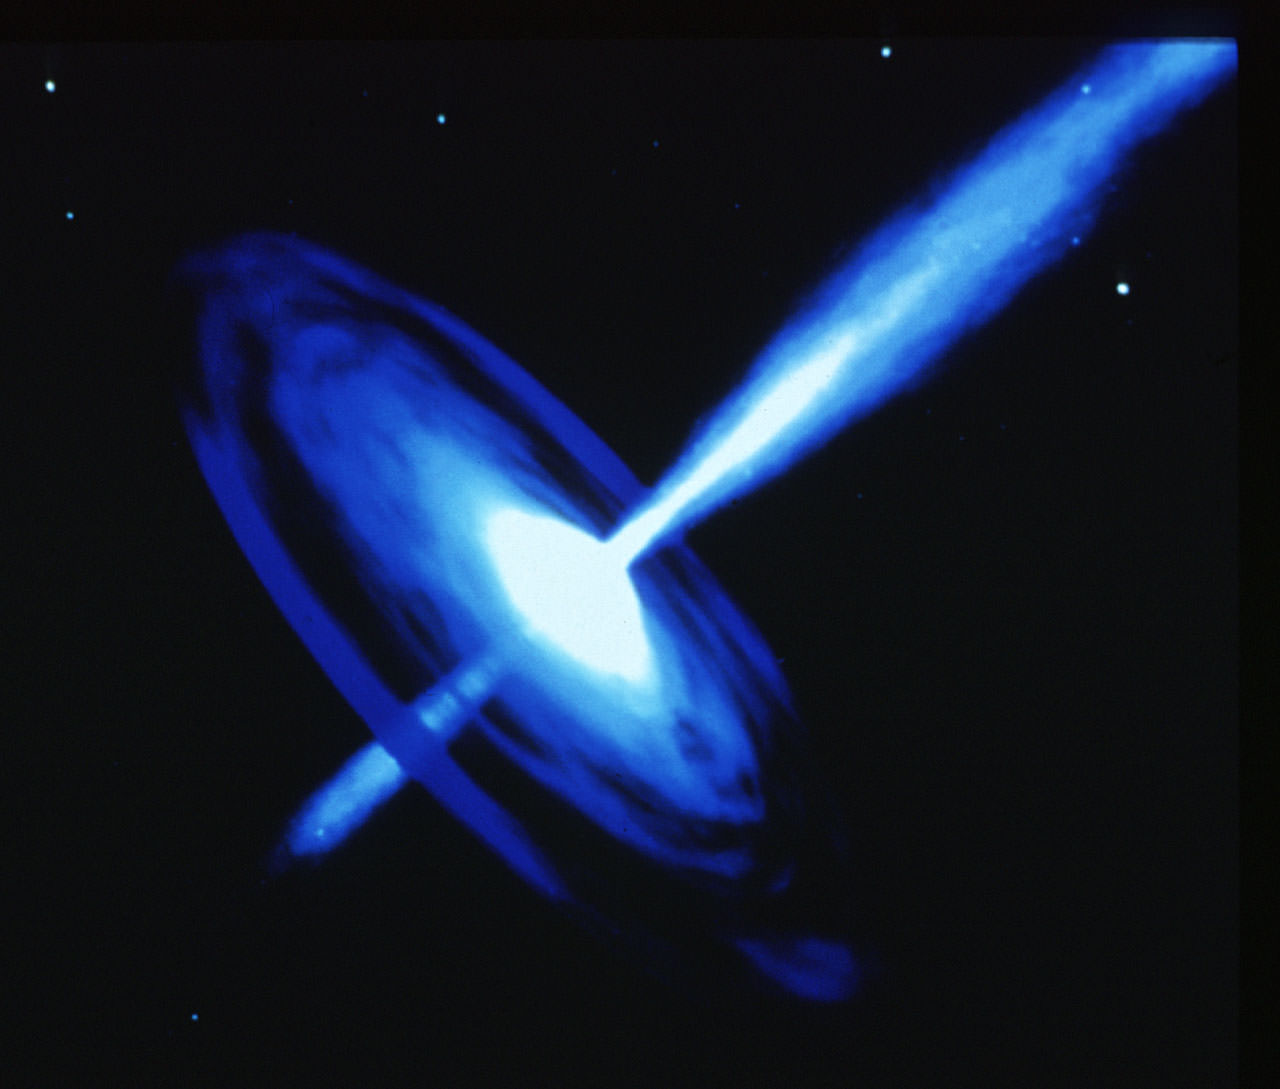
But that’s not all these powerful babies kick up. We also know that twin jets are often associated with black holes and their accretion disks. The evolution of the jets can be caused by many factors, but now we’re beginning to associate spin rate with their formation as well. Through sampling radio observations Dr Martinez-Sansigre and Professor Rawlings were able to deduce the power of the jets and how they acquire material. From there, they could hypothesize how quickly these objects are spinning. These same observations provided data on black hole evolution. According to their research, the early Universe black holes had a much slower spin rate compared to the fraction of those found rapidly spinning in the present.

“The spin of black holes can tell you a lot about how they formed. Our results suggest that in recent times a large fraction of the most massive black holes have somehow spun up.” said Dr Martinez-Sansigre. “A likely explanation is that they have merged with other black holes of similar mass, which is a truly spectacular event, and the end product of this merger is a faster spinning black hole.”

Professor Rawlings adds: “Later this decade we hope to test our idea that these supermassive black holes have been set spinning relatively recently. Black hole mergers cause predictable distortions in space and time – so-called gravitational waves. With so many collisions, we expect there to be a cosmic background of gravitational waves, something that will change the timing of the pulses of radio waves that we detect from the remnants of massive stars known as pulsars.

Radio waves? You bet. “Down in a hole. Outta’ control…”

Rapid Formation May Have Stunted Mars’ Growth

Credit: Christopher Leather, University of Chicago

[/caption]

Somewhere between two and four million years after our solar system formed, a rocky little runt went through a rapid growth spurt. In its embryonic stage, it was much like Earth. But it didn’t end up being terrestrial. Earth ended up being twice its size through collecting other rocky bodies as they passed by. But not Mars… Oh, no. Not Mars.

“Earth was made of embryos like Mars, but Mars is a stranded planetary embryo that never collided with other embryos to form an Earthlike planet.” said Nicolas Dauphas at the University of Chicago. “Mars probably is not a terrestrial planet like Earth, which grew to its full size over 50 to 100 million years via collisions with other small bodies in the solar system.”

The latest study of Mars just released in Nature puts forth the theory that the red planet’s rapid formation helps explain why it is so small. The idea isn’t new, but based on a proposal done 20 years ago and heightened by planetary growth simulations. The only thing missing was evidence… evidence that’s hard to come by since we can’t examine firsthand the formation history of Mars because of the unknown composition of its mantle – the rock layer beneath the planetary crust.

So what has changed that gives us a new view of how Mars came to be the runt of the solar system litter? Try meteorites. By analyzing Martian meteorites, the team was able to pick out clues about the mantle composition of Mars, but their compositions also have changed during their journey through space. This debris left over from the genesis time is nothing more than a common chondrite – a Rosetta stone for deducing planetary chemical composition. Dauphas and Pourmand analyzed the abundances of these elements in more than 30 chondrites, and compared those to the compositions of another 20 martian meteorites.

“Once you solve the composition of chondrites you can address many other questions,” Dauphas said.

And there are many, many questions left to be answered. Cosmochemists have intensively studied chondrites, but still poorly understand the abundances of two categories of elements they contain, including uranium, thorium, lutetium and hafnium. Hafnium and thorium both are refractory or non-volatile elements, meaning that their compositions remain relatively constant in meteorites. They also are lithophile elements, those that would have stayed in the mantle when the core of Mars formed. If scientists could measure the hafnium-thorium ratio in the martian mantle, they would have the ratio for the whole planet, which they need to reconstruct its formation history. When the team of Dauphas and Pourmand had determined this ratio, they were able to calculate how long it took Mars to develop into a planet. Then, by applying a simulation program, they were able to deduce that Mars… Oh, yes. Mars. Reached its full growth only two million years after the solar system.

“New application of radiogenic isotopes to both chondrite and martial meteorites provides data on the age and mode of formation of Mars,” said Enriqueta Barrera, program director in NSF’s Division of Earth Sciences. “That is consistent with models that explain Mars’ small mass in comparison to that of Earth.”

And still there are questions… But fast formation seems to be the answer. It might explain the puzzling similarities in the xenon content of its atmosphere and that of Earth’s. “Maybe it’s just a coincidence, but maybe the solution is that part of the atmosphere of Earth was inherited from an earlier generation of embryos that had their own atmospheres, maybe a Marslike atmosphere,” Dauphas said.

Mars? Oh, no. Not Mars.

Source: University of Chicago, AAS

Through The Eyes of WISE… Galaxies Seen In A New Light

Galaxy Shapes
Image credit: NASA/JPL-Caltech/UCLA

[/caption]

NASA’s Wide-field Infrared Survey Explorer (WISE) just released a new series of galactic images – allowing us just a hint at the amazing, and colorful, things to come. Release data products include an Atlas of 10,464 calibrated, co-added Image Sets and a Source Catalog containing positional and photometric information for over 257 million objects detected on the WISE images. Out of all this data, the mission plans to release a thousand images and possibly more…

“Galaxies come in all sorts of delicious flavors,” said Tom Jarrett, a WISE team member at the Infrared Processing and Analysis Center, California Institute of Technology, in Pasadena, who studies our Milky Way’s neighboring galaxies. “Our first sample shows what WISE is capable of. We can produce spectacular high-resolution images of the largest galaxies.”

Images taken in infrared light have been transformed into colors we can understand and relate to. Short wavelengths appear as blue and the longest are red. By token, aging stars appear blue, while clusters of newly formed stars take on yellow or reddish hues. This newly released image gives us a great sampler of all galaxy types – from elegant to disturbed. Because they are “close to home”, these particular galactic images taken through the eyes of WISE will allow us further insight as to their formation and evolution.

“We can learn about a galaxy’s stars — where are they forming and how fast?” said Jarrett. “There’s so much diversity in galaxies to explore.”

WISE, which launched into space in Dec. 2009, has been a busy project. Scanning the whole sky one-and-a-half times in infrared light, the mission has captured images as close as asteroids in our own solar system and distant galaxies billions of light-years away. The first data set, which ironically doesn’t include all of the galaxies in the new collage, was released to the public in April of this year. The complete WISE catalog will follow a year later, in the spring of 2012.

Says NASA; “The most distant objects that will stand out like ripe cherries in WISE’s view are tremendously energetic galaxies. Called ultraluminous infrared galaxies, or ULIRGs, these objects shine with the light of up to a trillion suns. They crowd the distant universe, but appear virtually absent in visible-light surveys. WISE should find millions of ultra-luminous infrared galaxies, and the most luminous of these could be the most luminous galaxy in the Universe.”

Source: Berkeley U.

From 2MASS To You… The Most Complete 3-D Map of Local Universe

Credit: T.H. Jarrett (IPAC/SSC)

[/caption]

Isn’t this era of astronomy incredible? There are times when I thumb through my old astronomy books with their outdated information and simply marvel over today’s capabilities. Who would have believed just 50 years ago that we’d be peering into the far reaches of our Universe – let alone mapping them? Thanks to an endeavor that took more than 10 years to complete, the 2MASS Redshift Survey (2MRS) has provided us with 3-D map which cuts through the dust and pushes the envelope of the Galactic Plane out to 380 million light-years – encompassing more than 500 million stars and resolving more than 1.5 million galaxies.

With our current understanding of expansion, we accept a distant galaxy’s light is stretched into longer wavelengths – or redshifted. By default, this means the further a galaxy is away, the greater the redshift will be. This then becomes a critical factor in producing a three-dimensional point in mapping. To cut through the layers of obscuring dust, the original Two-Micron All-SkySurvey (2MASS) visualized the entire visible sky in three near-infrared wavelength bands. While it gave us an incredible look at what’s out there, it lacked a critical factor… distance. Fortunately, some of the galaxies logged by 2MASS had known redshifts, and thus began the intense “homework” of measurements in the late 1990s using mainly two telescopes: one at the Fred Lawrence Whipple Observatory on Mt. Hopkins, AZ, and one at the Cerro Tololo Inter-American Observatory in Chile.

“Our understanding of the origin and evolution of the Universe has been fundamentally transformed with seminal redshift, distant supernovae and cosmic microwave background surveys. The focus has shifted to the distribution and nature of dark matter and dark energy that drive the dynamics of the expanding cosmos.” says team member, Thomas Jarrett. “The study of the local Universe, including its peculiar motions and its clustering on scales exceeding 100 Mpc, is an essential ingredient in the connection between the origin of structure in the early Universe and the subsequent formation of galaxies and their evolution to the state we observe today. Key issues include the location and velocity distribution of galaxies, leading to the mass-to-light relationship between what is observed and what is influencing the mass density field.”

What makes this work so impressive? The 2MRS has logged what’s been previously hidden behind our Milky Way – allowing us to comprehend the impact they have on our motion. From the time astronomers first measured our movement relative to the rest of the Universe and realized it couldn’t be explained by the gravitational attraction from any visible matter, it became a huge jigsaw puzzle just waiting to have the pieces match up. Now massive local structures, like the Hydra-Centaurus region (the “Great Attractor”) which were previously hidden almost behind the Milky Way are shown in great detail by 2MRS. The Galactic “zone of avoidance” (ZoA) is still, however, a formidable barrier due to the sheer number of stars that produce a foreground (confusion) “noise”. Near the center of the Milky Way the confusion noise is extreme, blocking nearly 100% of the background light; whereas far from the Galactic center the confusion noise is minimal and the veil of the Milky Way is lifted at near-infrared wavelengths

“The 2MASS catalog has proven to be quite versatile to the astronomical community: supporting observation and future mission planning, seeding studies of star formation and morphology in nearby galaxies, penetrating the zone of avoidance, providing the base catalog of redshift and Tully-Fisher HI surveys, and so on. But perhaps its most important function is to provide the “big picture” context for analysis and interpretation of data concerning galaxy clusters, large scale structure and the density of matter in the Universe.” says Jarrett. “And so the primary motivation of this work, with the construction of qualitative “road” maps to the local Universe, is to provide a broad framework for studying the physical connection between the local Universe (Milky Way, Local Group, Local Supercluster, “Great Wall”, etc) and the distant Universe where galaxies and the cosmic web first formed. The best is yet to come.”

Gamma Ray Burst 090429B… Far Out!

Credit: Gemini Observatory/AURA/Andrew Levan (University of Warwick, UK)

[/caption]

You don’t have to be an old hippie… all you have to do is be able to picture a time within about half a billion years after the Big Bang. Thanks to a set of composite images taken by Gemini Observatory North telescope through different optical and infrared filters, science may have discovered what could be the most distant gamma ray burst (GRB) ever detected.

“Like any finding of this sort there are uncertainties,” said the study’s principal investigator Antonino Cucchiara. “However, if I were in Vegas, I would never bet against the odds that this is the most distant GRB ever seen and we estimate that there is even a 23% chance that it is the most distant object ever observed in the universe.”

As we probe further and further into the most distant reaches of space, we’re virtually able to look back in time. Even though gamma ray bursts last only a matter of minutes and occur billions of light years away, their “afterglow” can last for a period of a couple of weeks, allowing instruments like the Swift satellite or large ground-based telescopes to detect them. According to Cucchiara, “Gemini was the right telescope, in the right place, at the right time. The data from Gemini was instrumental in allowing us to reach the conclusion that the object is likely the most distant GRB ever seen.”

If their findings are correct, this implies the light of the distant GRB left from its source some 13.1 billion years ago or about 520 million years after the Big Bang. This allows astronomers to draw a conclusion that it is not the consequence of the very first generation of stars formed in the universe. The implication is that the early, extremely young universe was already a busy star factory.

“By looking very far away, because the light takes so long on its journey to reach the Earth, astronomers are effectively able to look back in time to this early era. Unfortunately, the immense distances involved make this very challenging. There are different ways of finding such objects, looking at distant galaxies being the most obvious, but because galaxies are faint it is very difficult. GRB afterglows are so much brighter”

But arriving at those type of conculsions isn’t easy and that’s why the study took two years to complete. “Ideally we would have gathered a spectrum to measure the distance precisely, but we were foiled at the last minute when the weather took a turn for the worse on Mauna Kea. Since GRB afterglows fade so quickly, we never got a second chance,” said Derek Fox, Cucchiara’s advisor for his graduate research at Penn State University.

Being sure enough to report findings as conclusive can be a tricky business. As with all things astronomy, a second “opinion” is not only welcomed, but a neccessary part of any findings. That’s why Gemini North’s images were combined with wider-field images from the United Kingdom Infrared Telescope (also on Hawaii’s Mauna Kea). As a result, the team was able to estimate the redshift of GRB 090429B with a high degree of confidence.

Credit: Gemini Observatory/AURA/Penn State/UC Berkeley/University of Warwick, UK

“The fact that we were never able to detect anything in the spot where we saw the afterglow in the Gemini data gave us the missing link in converging on this extremely high redshift estimate,” said Cucchiara. “We looked with Gemini, the Hubble Space Telescope and also with the Very Large Telescope in Chile and never saw anything once the afterglow faded. This means that this GRB’s host galaxy is so distant that it couldn’t be seen with any existing telescopes. Because of this, and the information provided by the Swift satellite, our confidence is extremely high that this event happened very, very early in the history of our universe.”

Really far out…

The Lone SuperStar

Credit: ESO/M.-R. Cioni/VISTA Magellanic Cloud survey. Acknowledgment: Cambridge Astronomical Survey Unit

[/caption]

It hangs out in space some 160,000 light years away. Its neighborhood is the Large Magellanic Cloud. It calls the Tarantula Nebula home. It’s 150 times more massive than our Sun and it shines an astounding three million times brighter. What is it? Try a lone super star…

Utilizing the power of ESO’s Very Large Telescope, a team of international astronomers have been checking out star VFTS 682 in the Large Magellanic Cloud. Using an instrument aptly named FLAMES, they also discovered the star to be very hot, with a surface temperature of about 50 000 degrees Celsius. While most of the initial findings were rather unremarkable, when researchers cleared away the dust clouds they discovered this super star stood alone.

“We were very surprised to find such a massive star on its own, and not in a rich star cluster,” notes Joachim Bestenlehner, the lead author of the new study and a student at Armagh Observatory in Northern Ireland. “Its origin is mysterious.”

Why an enigma? For the most part, stars like VFTS 682 are found in the crowded centers of galactic clusters. They are young, hot and bright – destined to live short and explosive lifetimes. Their high mass makes them a candidate for an even more dramatic end – a long-duration gamma-ray burst, the brightest explosion in the Universe. It could happen to other super stars in the nearby stellar nursery cluster, because it has a sibling.

“The new results show that VFTS 682 is a near identical twin of one of the brightest superstars at the heart of the R 136 star cluster,” adds Paco Najarro, another member of the team from CAB (INTA-CSIC, Spain).

So how did VFTS 682 end up being solitary sun? There is speculation that it could be a “runaway”… ejected from its nest. But such a scenario is unlikely since it is doubtful such a heavy star could be thrown from the cluster by gravitational interactions.

“It seems to be easier to form the biggest and brightest stars in rich star clusters,” adds Jorick Vink, another member of the team. “And although it may be possible, it is harder to understand how these brilliant beacons could form on their own. This makes VFTS 682 a really fascinating object.”

Shine on, you crazy diamond!

New Arm Embraces Milky Way

Milky Way Map Courtesy of NASA

[/caption]

Some sixteen decades ago, Lord Rosse was the first to point out spiral structure in distant “nebula”… and today astrophysicists Thomas Dame and Patrick Thaddeus are discovering it closer to home. Our Milky Way Galaxy was believed to only have six spiral arms, but their research has revealed an outer extension of the Scutum-Centaurus arm from the inner galaxy.

“We have identified a spiral arm lying beyond the Outer Arm in the first Galactic quadrant ~15 kpc from the Galactic center.” says Dame and Thaddeus. “One of the detections was fully mapped to reveal a large molecular cloud with a radius of 47 pc and a molecular mass of ~50,000 M. At a mean distance of 21 kpc, the molecular gas in this arm is the most distant yet detected in the Milky Way. The new arm appears to be the continuation of the Scutum–Centaurus Arm in the outer Galaxy, as a symmetric counterpart of the nearby Perseus Arm.”

Over the last 50 years, many models of our galaxy have been proposed – revealing a pleasing, duo-symmetry. However, finding evidence to prove these theories has been a bit more elusive. Since we cannot observe ourselves, seeing spiral structure on the far side of the galaxy is problematic – hidden by near-side emission at the same velocity. But these researchers didn’t stop. The new arm was found as a result of attempts to follow the Sct–Cen Arm past its tangent.

“The new arm was largely overlooked in existing 21 cm surveys probably because it lies mainly out of the Galactic plane, its Galactic latitude steadily increasing with longitude as it follows the warp in the distant outer Galaxy.” says Dame. “In the first quadrant the only prominent HI spiral feature in the outer Galaxy is the well-known Outer Arm, a feature also well traced by CO. However, at 3 degrees above the plane one sees instead the new arm as a prominent linear feature running roughly parallel to the locus of the Outer Arm but shifted to more negative velocities.”

Is our smoothly constructed galaxy indeed a mirror image of itself? This new evidence suggests the Scutum-Centaurus arm embraces the entire Milky Way – forming a symmetrical, star-forming counterpart to the galaxy’s other arm, Perseus. “Confirmation of the present feature as the ”Outer Sct-Cen Arm” will require a great deal of new data from several telescopes and much observing time over an extended period.” says Thaddeus. “Key steps toward confirming the proposal include, as mentioned, tracking Sct–Cen in the fourth quadrant and, even harder, tracking the Perseus Arm from the point where it passes inside the solar circle near longitude 50 degrees to its putative origin at the far end of the bar.”

Mapping the findings of galactic data on atomic hydrogen gas isn’t going to happen overnight… and even more discoveries and clarifications could be revealed in the future. “The Galactic symmetry suggested by the present work and clearly demonstrated by the identification of the Far 3-kpc Arm a few years ago, coupled with evidence for a global two-armed spiral pattern in the old stars, and, indeed, with the discovery of the bar itself, all hint at Galactic spiral structure that is both simpler and more amenable to study than had long been assumed. As emphasized here, much work remains, but aided by greatly improved distances from forthcoming astrometric surveys, a reasonably complete picture of our Galaxy’s spiral pattern may be achieved over the next decade.”

Australian Student Uncovers the Universe’s Missing Mass

Comic Microwave Background Courtesy of NASA / WMAP Science Team

[/caption]

Not since the work of Fritz Zwicky has the astronomy world been so excited about the missing mass of the Universe. His evidence came from the orbital velocities of galaxies in clusters, rotational speeds, and gravitational lensing of background objects. Now there’s even more evidence that Zwicky was right as Australian student – Amelia Fraser-McKelvie – made another breakthrough in the world of astrophysics.

Working with a team at the Monash School of Physics, the 22-year-old undergraduate Aerospace Engineering/Science student conducted a targeted X-ray search for the hidden matter and within just three months made a very exciting discovery. Astrophysicists predicted the mass would be low in density, but high in temperature – approximately one million degrees Celsius. According to theory, the matter should have been observable at X-ray wavelengths and Amelia Fraser-McKelvie’s discovery has proved the prediction to be correct.

Dr Kevin Pimbblet from the School of Astrophysics explains: “It was thought from a theoretical viewpoint that there should be about double the amount of matter in the local Universe compared to what was observed. It was predicted that the majority of this missing mass should be located in large-scale cosmic structures called filaments – a bit like thick shoelaces.”

Up until this point in time, theories were based solely on numerical models, so Fraser-McKelvie’s observations represent a true break-through in determining just how much of this mass is caught in filamentary structure. “Most of the baryons in the Universe are thought to be contained within filaments of galaxies, but as yet, no single study has published the observed properties of a large sample of known filaments to determine typical physical characteristics such as temperature and electron density.” says Amelia. “We examine if a filament’s membership to a supercluster leads to an enhanced electron density as reported by Kull & Bohringer (1999). We suggest it remains unclear if supercluster membership causes such an enhancement.”

Still a year away from undertaking her Honors year (which she will complete under the supervision of Dr Pimbblet), Ms Fraser-McKelvie is being hailed as one of Australia’s most exciting young students… and we can see why!

Carina Nebula: Pumping More Than Just Iron

Carina Nebula - Credit: NASA/CXC/PSU/L.Townsley et al.

[/caption]

We are all just star stuff… But when it comes to the elements produced by a star, it just doesn’t get any heavier than iron. So how do more exotic elements come into existence? Try the Great Cosmic Recycler – supernova. Its energy disperses newly synthesized materials right into the interstellar neighborhood where an enriched generation of stars begin life again.

The beautiful Carina Nebula may very well be a literal supernova factory. Encompassing a large field of 1.4 square degrees, Chandra made of a mosaic of 22 individual pointings. In total, the image represents 1.2 million seconds – or nearly two weeks – of Chandra observing time. In addition, multi-wavelength data, such as infrared observations from the Spitzer Space Telescope and the Very Large Telescope (VLT), were then added to the mix to reveal that the supernova process has already begun. Clues, such as the lack of bright x-ray sources from Trumpler 15, suggest its massive stars have already been destroyed. In addition, six candidate neutron stars – instead of just one – provide additional evidence that supernova activity is gearing up in Carina.

But stellar destruction isn’t the only evidence Chandra has found. A new population of young massive stars has also been detected… potentially doubling the number of known young, massive stars which are usually destined to be destroyed later in supernova explosions. In the composite image, they appear as bright X-ray sources scattered across the x-ray emission like freckles on a child’s face. But what really holds our interest is the infamous Eta Carinae – a massive, unstable star on the brink of extinction.

Thanks to this latest research, we now know it’s not alone…

A New “Spin” On Stellar Age

Artist's Conception of Hypothetical Planet courtesy of David A. Aguilar (CfA)

[/caption]

It might not be polite to ask a lady her true age, but when it comes to stars it’s not as easy as checking a driver’s license. From our point of view, all stars can look pretty much the same – so how do we tell one that’s one billion years old from one that ten billion? The answer could be stellar spin rate.

In Monday’s 218th meeting of the American Astronomical Society, astronomer Soren Meibom of the Harvard-Smithsonian Center for Astrophysics presented his findings. “A star’s rotation slows down steadily with time, like a top spinning on a table and can be used as a clock to determine its age.” says Meibom. “Ultimately, we need to know the ages of the stars and their planets to assess whether alien life might have evolved on these distant worlds. The older the planet, the more time life has had to get started. Since stars and planets form together at the same time, if we know a star’s age, we know the age of its planets too.”

By determining a star’s age in advance, it assists astronomer’s working with projects like Kepler. Knowing where to begin in a galaxy filled with stars helps us to understand how planetary systems form and evolve and why they are so different from each other. In some circumstances, like galactic star clusters, we’re pretty much on the mark at knowing a star’s age because we believe they all formed about the same time. However, for a lone star that harbors planets, determining age is much more difficult. Measuring the rotation of stars in clusters with different ages reveals exactly how spin and age are related. Then by extension, astronomers can measure the spin of a single isolated star and calculate its age.

Just how is calculating stellar spin rate done? Try exactly how we know our own Sol’s rotation – sunspots. Each time a “star spot” rotates across the visible surface, it dims ever so slightly. By measuring how long these changes take place gives us substantial clues to just how fast a star rotates. Although these changes are minute and decrease as a star ages, the sensitivity of the Kepler spacecraft was designed specifically to measure stellar brightnesses very precisely in order to detect planets (which block a star’s light ever so slightly if they cross the star’s face from our point of view).

But this task was far from easy. In a four year preparatory study conducted with specially designed instrument (Hectochelle) mounted on the MMT telescope on Mt. Hopkins in southern Arizona, Meibom and his colleagues sorted out information in nearly 7000 individual stars and used Kepler data to determine how fast those stars were spinning. Their findings included stars with rotation periods between 1 and 11 days, confirming that gyrochronology is an exciting new method to learn the ages of isolated stars.

“This work is a leap in our understanding of how stars like our Sun work. It also may have an important impact on our understanding of planets found outside our solar system,” said Meibom.