Jupiter’s Next Great Red Spot

Red spots on Jupiter. Image credit: Christopher Go. Click to enlarge
If you’re an amateur astronomer with a reasonably good telescope, you might be able to see a new red spot on Jupiter. Its official name is Oval BA, and it’s half the size the of the famous Great Red Spot. It first appeared in 2000 when three smaller storms collided and merged together. It started out white, then changed to brown, and now it’s the same colour as the Great Red Spot. It’s possible that huge storms like this dredge material from deep beneath Jupiter’s cloud tops, and then ultraviolet light from the Sun changes it red.

Backyard astronomers, grab your telescopes. Jupiter is growing a new red spot.

Christopher Go of the Philippines photographed it on February 27th using an 11-inch telescope and a CCD camera:

The official name of this storm is “Oval BA,” but “Red Jr.” might be better. It’s about half the size of the famous Great Red Spot and almost exactly the same color.

Oval BA first appeared in the year 2000 when three smaller spots collided and merged. Using Hubble and other telescopes, astronomers watched with great interest. A similar merger centuries ago may have created the original Great Red Spot, a storm twice as wide as our planet and at least 300 years old.

At first, Oval BA remained white?the same color as the storms that combined to create it. But in recent months, things began to change:

“The oval was white in November 2005, it slowly turned brown in December 2005, and red a few weeks ago,” reports Go. “Now it is the same color as the Great Red Spot!”

“Wow!” says Dr. Glenn Orton, an astronomer at JPL who specializes in studies of storms on Jupiter and other giant planets. “This is convincing. We’ve been monitoring Jupiter for years to see if Oval BA would turn red – and it finally seems to be happening.” (Red Jr? Orton prefers “the not-so-Great Red Spot.”)

Why red?

Curiously, no one knows precisely why the Great Red Spot itself is red. A favorite idea is that the storm dredges material from deep beneath Jupiter’s cloudtops and lifts it to high altitudes where solar ultraviolet radiation–via some unknown chemical reaction?produces the familiar brick color.

“The Great Red Spot is the most powerful storm on Jupiter, indeed, in the whole solar system,” says Orton. The top of the storm rises 8 km above surrounding clouds. “It takes a powerful storm to lift material so high,” he adds.

Oval BA may have strengthened enough to do the same. Like the Great Red Spot, Red Jr. may be lifting material above the clouds where solar ultraviolet rays turn “chromophores” (color-changing compounds) red. If so, the deepening red is a sign that the storm is intensifying.

“Some of Jupiter’s white ovals have appeared slightly reddish before, for example in late 1999, but not often and not for long,” says Dr. John Rogers, author of the book “Jupiter: The Giant Planet,” which recounts telescopic observations of Jupiter for the last 100+ years. “It will indeed be interesting to see if Oval BA becomes permanently red.”

See for yourself: Jupiter is easy to find in the dawn sky. Step outside before sunrise, look south and up: sky map. Jupiter outshines everything around it. Small telescopes have no trouble making out Jupiter’s cloudbelts and its four largest moons. Telescopes 10-inches or larger with CCD cameras should be able to track Red Jr. with ease.

What’s next? Will Red Jr. remain red? Will it grow or subside? Stay tuned for updates.

Original Source: NASA News Release

Towering Cliffs at the Edge of Olympus Mons

The eastern scarp of the Olympus Mons volcano. Image credit: ESA Click to enlarge
This photograph was taken by ESA’s Mars Express spacecraft. It shows the eastern edge of the Olympus Mons volcano on Mars – the biggest mountain the Solar System. These huge cliffs tower above the relatively flat eastern plains around the mountain. The region has been covered repeatedly by lava flows, as recently as 200 million years ago.

This image, taken by the High Resolution Stereo Camera (HRSC) on board ESA’s Mars Express spacecraft, shows the eastern scarp of the Olympus Mons volcano on Mars.

The HRSC obtained this images during orbit 1089 with a ground resolution of approximately 11 metres per pixel. The image is centred at 17.5 North and 230.5 East. The scarp is up to six kilometres high in places.

The surface of the summit plateau’s eastern flank shows lava flows that have are several kilometres long and a few hundred metres wide.

Age determinations show that they are up to 200 million years old, in some places even older, indicating episodic geological activity.

The lowland plains, seen here in the eastern part of the image (bottom), typically have a smooth surface.

Several channel-like features are visible which form a broad network composed of intersecting and ‘anastomosing’* channels that are several kilometres long and up to 40 metres deep. (*Anastomising means branching extensively and crossing over one another, like veins on the back of your hand.)

Several incisions suggest a tectonic control, others show streamlined islands and terraced walls suggesting outflow activity.

Age determinations show that the network-bearing area was geologically active as recent as 30 million years ago.

Between the edge of the lowland plains and the bottom of the volcano slope, there are ‘wrinkle ridges’ which are interpreted as the result of compressional deformation. In some places, wrinkle ridges border the arch-like terraces at the foot of the volcano slope.

The colour scenes have been derived from the three HRSC-colour channels and the nadir channel. The perspective views have been calculated from the digital terrain model derived from the stereo channels.

The 3D anaglyph image was calculated from the nadir and one stereo channel.

Original Source: ESA Portal

Saturn’s Northern Lights Can Go Backwards

Electron particles are flying away from Saturn’s polar region. Image credit: University of Cologne. Click to enlarge
Auroras on Earth happen when the solar wind interacts with our planet’s magnetic field; electrons are accelerated downwards into the atmosphere, and we see the pretty lights in the sky. On Saturn; however, this process also goes in reverse. Most electrons are accelerated down, but others go in the opposite direction, away from the planet.

Polar lights are fascinating to look at on Earth. On other planets, they can also be spectacular. Scientists from the Max Planck Institute for Solar System Research in Katlenberg, Lindau, Germany, have now observed Saturn’s polar region using the particle spectrometer MIMI, on the Cassini Space Probe. They discovered electrons not only being accelerated toward the planet, but also away from it (Nature, February 9, 2006).

We can see polar lights on Earth when electrons above the atmosphere are accelerated downwards. They light up when they hit the upper atmosphere. Some years ago, researchers discovered that electrons inside the polar region can also be accelerated away from the Earth – that is, “backwards”. These anti-planetary electrons do not cause the sky to light up, and scientists have been puzzled about how they originate.

Until now it has also been unclear whether anti-planetary electrons only occur on Earth. An international team led by Joachim Saur at the University of Cologne have now found electrons on Saturn that are accelerated “backwards” – that is, in an anti-planetary direction. These particles were measured using “Magnetospheric Imaging Instruments” (MIMI) on NASA’s Cassini Space Probe. One of these instruments’ sensors, the “Low Energy Magnetospheric Measurement System” (LEMMS), was developed and built by scientists at the Max Planck Institute for Solar System Research.

The rotation of the space probe helped the researchers to determine the direction, number, and strength of the electron rays. They compared these results with recordings of the polar region and a global model of Saturn’s magnetic field. It turned out that the region of polar light matched up very well with the lowest point of the magnetic field lines in which electron rays were measured.

Because the electron ray is strongly focussed (with an angle of beam spread less than 10 degrees), the scientists were able to determine where its source lies: somewhere above the polar region, but inside a distance of maximum five radii of Saturn. Because the electron rays measured on the Earth, Jupiter, and Saturn are so similar, it appears that there must be some fundamental process underlying the creation of polar lights.

Doing these measurements, Norbert Krupp and his colleagues Andreas Lagg and Elias Roussos from the Max Planck Institute for Solar System Research worked closely with scientists from the Institute for Geophysics and Meteorology at the University of Cologne and the Applied Physics Laboratory of Johns Hopkins University in Baltimore. US scientists led by Tom Krimigis are responsible for service and coordination of the instrument on the Cassini Space Probe.

Original Source: Max Planck Society

Scientists are Starting to Understand Solar Cycles

The Sun taken by SOHO on Feb. 10, 2006. Image credit: SOHO Click to enlarge
Solar scientists think they’re finally getting a handle on predicting the Sun’s cycles. If everything goes as they predict, the next solar cycle will be 30-50% stronger, and be up to a year late. Astronomers have been tracking the two major flows of plasma that goven the Sun’s cycles. One acts like a conveyor belt, pulling plasma from the poles to the equator, and the other gets stretched since the Sun rotates faster at the equator than at the poles. This causes the Sun’s magnetic field to concentrate, creating the solar maximum.

Scientists predict the next solar activity cycle will be 30 to 50 percent stronger than the previous one and up to a year late. Accurately predicting the sun’s cycles will help plan for the effects of solar storms. The storms can disrupt satellite orbits and electronics; interfere with radio communication; damage power systems; and can be hazardous to unprotected astronauts.

The breakthrough “solar climate” forecast by Mausumi Dikpati and colleagues at the National Center for Atmospheric Research in Boulder, Colo. was made with a combination of computer simulation and groundbreaking observations of the solar interior from space using NASA’s Solar and Heliospheric Observatory (SOHO). NASA’s Living With a Star program and the National Science Foundation funded the research.

The sun goes through a roughly 11-year cycle of activity, from stormy to quiet and back again. Solar storms begin with tangled magnetic fields generated by the sun’s churning electrically charged gas (plasma). Like a rubber band twisted too far, solar magnetic fields can suddenly snap to a new shape, releasing tremendous energy as a flare or a coronal mass ejection (CME). This violent solar activity often occurs near sunspots, dark regions on the sun caused by concentrated magnetic fields.

Understanding plasma flows in the sun’s interior is essential to predicting the solar activity cycle. Plasma currents within the sun transport, concentrate, and help dissipate solar magnetic fields. “We understood these flows in a general way, but the details were unclear, so we could not use them to make predictions before,” Dikpati said. Her paper about this research was published in the March 3 online edition of Geophysical Research Letters.

The new technique of “helioseismology” revealed these details by allowing researchers to see inside the sun. Helioseismology traces sound waves reverberating inside the sun to build up a picture of the interior, similar to the way an ultrasound scan is used to create a picture of an unborn baby.

Two major plasma flows govern the cycle. The first acts like a conveyor belt. Deep beneath the surface, plasma flows from the poles to the equator. At the equator, the plasma rises and flows back to the poles, where it sinks and repeats. The second flow acts like a taffy pull. The surface layer of the sun rotates faster at the equator than it does near the poles. Since the large-scale solar magnetic field crosses the equator as it goes from pole to pole, it gets wrapped around the equator, over and over again, by the faster rotation there. This is what periodically concentrates the solar magnetic field, leading to peaks in solar storm activity.

“Precise helioseismic observations of the ‘conveyor belt’ flow speed by the Michelson Doppler Imager (MDI) instrument on board SOHO gave us a breakthrough,” Dikpati said. “We now know it takes two cycles to fill half the belt with magnetic field and another two cycles to fill the other half. Because of this, the next solar cycle depends on characteristics from as far back as 40 years previously – the sun has a magnetic ‘memory’.”

The magnetic data input comes from the SOHO/MDI instrument and historical records. Computer analysis of the past eight years’ magnetic data matched actual observations over the last 80 years. The team added magnetic data and ran the model ahead 10 years to get their prediction for the next cycle. The sun is in the quiet period for the current cycle (cycle 23).

The team predicts the next cycle will begin with an increase in solar activity in late 2007 or early 2008, and there will be 30 to 50 percent more sunspots, flares, and CMEs in cycle 24. This is about one year later than the prediction using previous methods, which rely on such statistics as the strength of the large-scale solar magnetic field and the number of sunspots to make estimates for the next cycle. This work will be advanced by more detail observations from the Solar Dynamics Observatory, scheduled to launch in August 2008.

SOHO is a project of international collaboration between NASA and the European Space Agency. For images explaining the data on the Web, visit:
http://www.nasa.gov/vision/universe/solarsystem/solar_cycle_graphics.html

Original Source: NASA News Release

Galactic Chimneys Rising Above NGC 2841

NGC 2841. Image credit: NASA. Click to enlargeThis photograph of spiral galaxy NGC 2841 was taken by the Chandra X-Ray observatory. It shows gasses millions of degrees hot rising above the disk of stars and cooler gas. This superheated gas is created by giant stars and supernovae explosions which blow huge bubbles of gas above the disk like smoke rising from chimneys.

This X-ray/optical composite image of the large spiral galaxy NGC 2841 shows multimillion degree gas (blue/X-ray) rising above the disk of stars and cooler gas (gray/optical).

The rapid outflows of gas from giant stars, and supernova explosions in the disk of a galaxy create huge shells or bubbles of hot gas that expand rapidly and rise above the disk like plumes of smoke from a chimney. Chandra’s image of NGC 2841 provides direct evidence for this process, which pumps energy into the thin gaseous halo that surrounds the galaxy. Galactic chimneys also spread hot, metal enriched gas away from the disk of the galaxy into the halo.

Chandra X-ray Observatory

What’s Up This Week – March 6 – March 12, 2006

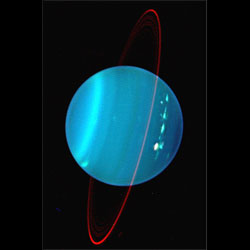
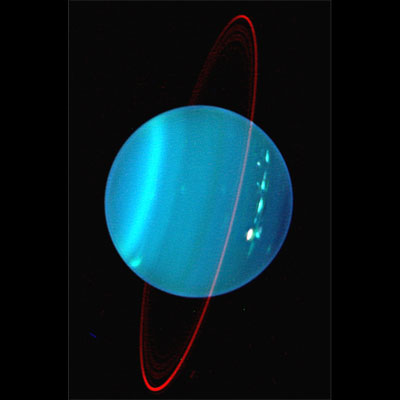
Uranus and its faint ring system which was discovered this week in 1977. Image credit: NASA/JPL. Click to enlarge.
If you haven’t had the chance to catch bright comet Pojmanski, the time is now. Head out this week to catch lunar features, bright stars and open clusters. Keep on looking because…

Here’s what’s up!

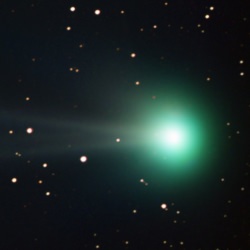
Monday, March 6 – Still making headlines, bright comet 2006/A1 Pojmanski is on the move. Easily spotted well before dawn with even small binoculars, Pojmanski has a very bright nucleus accompanied by a large, green-hued coma – along with reports of up to two degrees of tail. Now cruising through Aquila at an average magnitude of 5.4, it will continue to fade until it reaches Lacerta at month’s end. SkyHound provides excellent locator charts. Take the opportunity to locate this fine comet before the Moon returns to morning skies!

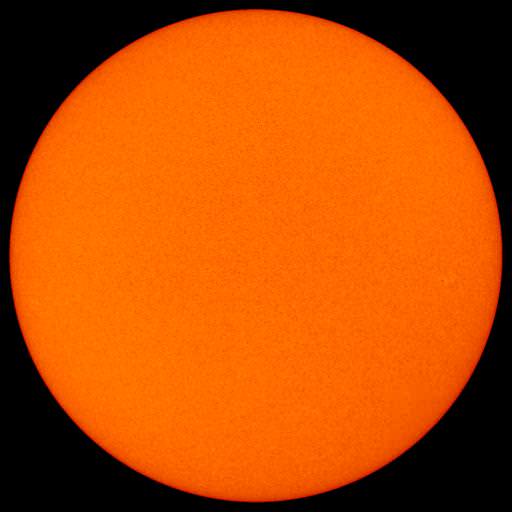
If you see sunshine today, celebrate the birthday of Joseph Fraunhofer born this date in 1787. The German scientist Fraunhofer was a true “trailblazer” of modern astronomy and his field was spectroscopy. After having served an apprenticeship as a lens and mirror maker, Fraunhofer went on to develop specialized optical instruments. While designing the modern achromatic objective lens for the telescope, he watched the sun’s light passing through a thin slit and saw many dark lines – part of the “rainbow bar code.” Fraunhofer knew some of these lines could be used as a wavelength “standard.” For this reason he began measuring their locations relative to one another. The most prominent of the lines he labeled with letters still in use today. His skill in optics, mathematics, and physics led Fraunhofer to design and build the very first diffraction grating capable of measuring the wavelengths of specific colors and dark lines in the solar spectrum. And his telescope – did it succeed? Of course. The achromatic objective lens is still a design of choice, and the binoculars you have? They’re achromats!

Tonight will be the perfect opportunity to find the lunar crater named for Fraunhofer. Return again to the now shallow appearing crater Furnerius. Can you spot the ring at its southern edge? This is crater Fraunhofer – a challenge under these lighting conditions.

Now, revisit the “Twin Stars” – Castor and Pollux. Separated by not much more than 3 arc seconds, 2.0 magnitude Castor A has a bright sibling – 2.8 magnitude Castor B. The pair is actually a true binary with an orbital period of roughly 500 years. The Castor system contains four lesser members – each main star is a spectroscopic binary. Without Fraunhofer’s discovery, we would have never known.

Although spectroscopes and telescopes are powerful instruments able to reveal much, sometimes you just have to get close for more details. Today in 1986, the first of over a week of flybys began as the Russian built VEGA 1 and European Space Agency’s Giotto became the first space probes to reach Halley’s Comet.

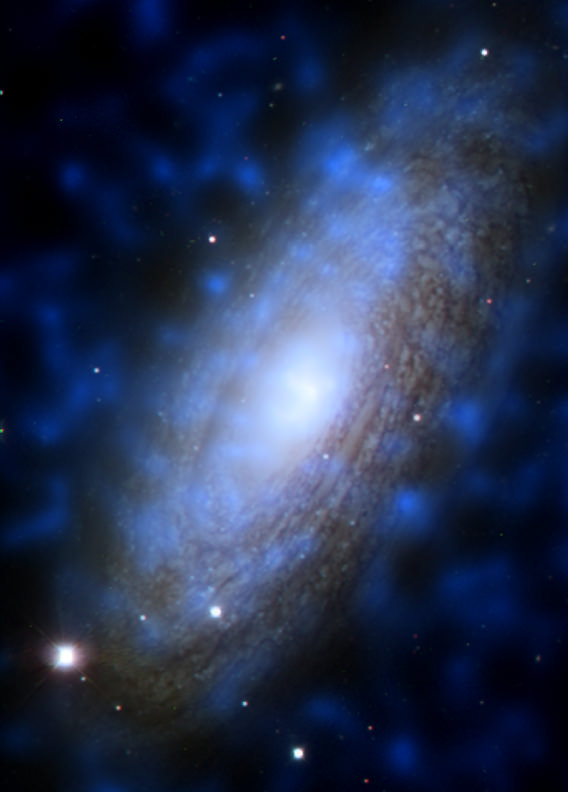
Tuesday, March 7 – On this date in 1792, the only child of William Herschel was born – John. Herschel became the first astronomer to thoroughly survey the southern hemisphere sky and he discovered photographic fixer – an important chemical ingredient needed to preserve images on photographic plates. Also born on this date in 1837 was Henry Draper, the man who made the first photograph of Vega’s stellar spectrum in 1872. Eight years later, he took the first picture of the Great Nebula in Orion. Draper’s contribution led to new techniques in astrophotography, making it possible for celluloid to reveal faint detail beyond the reach of the eye in the 1880’s. This led to development of the Great Observatories – and telescopes – necessary to ultimately show an expanding cosmos populated by numberless “island universes” beyond our own Milky Way.

Tonight’s outstanding lunar features are two craters that you simply can’t miss – Aristotle and Eudoxus. Located to the north, this pair will be highly prominent in binoculars as well as telescopes. The northernmost – Aristotle – was named for the great philosopher and has an expanse of 87 kilometers. Its deep, rugged walls show a wealth of detail at high power, including two small interior peaks. Companion crater Eudoxus, to the south, spans 67 kilometers and offers equally rugged detail.

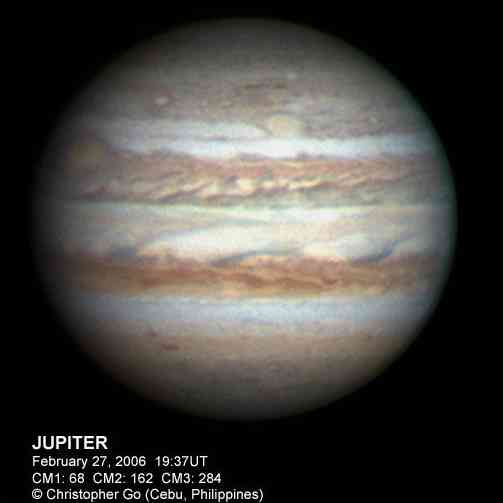
If you haven’t been following Saturn with regularity, tonight’s bright Moon might make this an occasion to spend some quality time on the ring system and satellites. At magnifications above 100x, the main division separating Ring A from B (Cassini’s Division) should be readily apparent in most scopes. Try making a series of simple sketches showing any nearby “stars.” Keep the sketch as the Moon waxes to full and see if you can distinguish between background stars and the planet’s own retinue of six most easily observed satellites – Titan, Rhea, Tethys, Dione, Enceladus, and Iapetus.

Wednesday, March 8 – On this day in 1977, NASA’s airborne occultation observatory made an unexpected discovery – Uranus had rings. Human eyes didn’t actually see Uranus’ faint ring system at the time – only the strange wink of a star hidden behind them. Imaging the rings had to wait until Voyager 2 whisked by nine years later.

Tonight the Moon provides a piece of scenic history as we take a more in-depth look at a previous study crater – Albategnius. This huge, hexagonal, mountain-walled plain appears near the terminator about one-third the way north of the south limb. This 135 kilometer wide crater is approximately 14,400 feet deep and its west wall casts a black shadow on the dark floor. Partially filled with lava after creation, Albategnius is a very ancient formation that later became home to several wall-breech craters, such as Klein, which can be seen telescopically on the southwest wall. Albategnius holds more than just the distinction of being a prominent crater tonight – it also holds a place in history. On May 9, 1962 Louis Smullin and Giorgio Fiocco of the Massachusetts Institute of Technology (MIT) aimed a ruby laser beam toward the Moon’s surface and Albategnius became the first lunar feature to reflect laser light from Earth.

On March 24, 1965 Ranger 9 took a “snapshot” of Albategnius from an altitude of approximately 2500 km. Ranger 9 was designed by NASA for one purpose – to achieve lunar impact trajectory and send back high-resolution photographs and video images of the lunar surface. Ranger 9 carried no other science packages. Its destiny was to simply take pictures right up to the moment of impact. They called it… a “hard landing.”

Thursday, March 9 – Today is the 442nd anniversary of David Fabricius’ birth. Born in 1564, Fabricius discovered the first variable star – Mira. At the heart of Cetus the Whale, it is now dipping steeply to the south-southwest at skydark. Even when well placed above the horizon, you can’t always count on Mira being seen. At its brightest, Mira achieves magnitude 2.0 – bright enough to be seen 10 degrees above the horizon. However Mira “the Wonderful” can also get as faint as magnitude 9 during its 331 day long “heartbeat” cycle of expansion and contraction. Mira is regarded as a premiere study for amateur astronomers interested in beginning variable star observations. For more information about this fascinating and scientifically useful branch of amateur astronomy contact the AAVSO (American Association of Variable Star Observers).

Tonight’s featured lunar crater is located on the south shore of Mare Imbrium right where the Apennine mountain range meets the terminator. At 58 kilometers in diameter and 12,300 feet deep, Eratosthenes is an unmistakable crater. Named after the ancient Greek mathematician, geographer and astronomer Eratosthenes, this splendid crater will display a bright west wall and a black interior hiding its massive crater capped central mountain 3570 meters high! Extending like a tail, an 80 kilometer mountain ridge angles away to its southwest. As beautiful as Eratosthenes appears tonight, it will fade away to almost total obscurity as the Moon approaches full. See if you can spot it again in five days.

Friday, March 10 – Tonight would be a terrific opportunity to study under-rated crater Bullialdus. Located close to the center of Mare Nubium, even binoculars can make out Bullialdus when near the terminator. If you’re scoping – power up – this one is fun! Very similar to Copernicus, Bullialdus’ has thick, terraced walls and a central peak. If you examine the area around it carefully, you can note it is a much newer crater than shallow Lubiniezsky to the north and almost non-existent Kies to the south. On Bullialdus’ southern flank, it’s easy to make out its A and B craterlets, as well as the interesting little Koenig to the southwest.

Despite the bright waxing moon, we still have a chance to get a view of a sprinkling of faint stars high to the south at skydark. Located less than a finger-width west-northwest of Wezen (Delta Canis Majoris) – 6.5 magnitude NGC 2354 is achievable in small scopes. Although richly populated, this open cluster lacks a bright core. This may challenge the eye to see it. Despite the moonlight, about a dozen stars should be visible in smaller scopes, but return on a moonless night to look for faint clumps and chaining among its 50 or so brightest members.

Saturday, March 11 – Today celebrates the birth of Urbain Leverrier. Born in 1811, Leverrier predicted the existence of Neptune. Along with a similar prediction by John Couch Adams, this led to its discovery. As both a mathematician and astronomer, Leverrier was also the first scientist to promote the idea of daily weather forecasts.

Tonight we’ll have the opportunity to look for a lunar feature named for Leverrier. To find it, start with the C-shape of Sinus Iridum. Imagine that Iridum is a mirror focusing light – this will lead your eye to crater Helicon. The slightly smaller crater southeast of Helicon is Leverrier. Be sure to power up to capture the splendid north-south oriented ridge which flows lunar east.

Tonight let’s try a lovely triple star system – Beta Monocerotis. Located about a fist width northwest of Sirius, Beta is a distinctive white star with blue companions. Separated by about 7 arc seconds, almost any magnification will distinguish Beta’s 4.7 magnitude primary from its 5.2 magnitude secondary to the southeast. Now, add a little power and you’ll see the fainter secondary has its own 6.2 magnitude companion less than 3 arc seconds away to the east.

Sunday, March 12 – Tonight let’s turn binoculars or telescopes toward the southern lunar surface as we set out to view one of the most unusually formed craters – Schiller. Located near the lunar limb, Schiller appears as a strange gash bordered on the southwest in white and black on the northeast. This oblong depression might be the fusion of two or three craters, yet shows no evidence of crater walls on its smooth floor. Schiller’s formation still remains a mystery. Be sure to look for a slight ridge running along the spine of the crater to the north through the telescope. Larger scopes should resolve this feature into a series of tiny dots.

Want a challenging double this evening? Then let’s have a look at Theta Aurigae. 2.7 magnitude Theta is a four star system ranging in magnitudes from 2.7 to 10.7. The brightest companion – Theta B – is magnitude 7.2 and is separated from the primary by slightly more than 3 arc seconds. Remember that this is what is known as a “disparate double” and look for the two fainter members well away from the primary.

Grab a comet by the tail and may all your journeys be at light speed! …~Tammy Plotner. Contributing author: Jeff Barbour @ astro.geekjoy.com

Astrophoto: Comet Pojmanski by R. Jay GaBany

Comet Pojmanski by R. Jay GaBany
Set your alarm clocks between 4:30 and 5:00AM sometime over the next two or three days because a bright new comet that can be seen with the unaided eye, even better through binoculars, is dancing head first near the horizon almost due east before sunrise. The comet is named Pojmanski and has been given the official designation of C/2006 A1. It was discovered earlier this year on January 2.

Grzegorz Pojmanski, of the Warsaw University Astronomical Observatory in Poland, first spotted this comet in a photograph taken from Chile when it glowed around magnitude 12 – thousands of times too faint to be seen visually without telescopic aide.

As the comet has moved closer to Earth on a journey that will swing it around the sun, its actual brightness has surpassed all original estimates so that by the morning of March 3, it was still between magnitude 5.5 and 6. That makes it as visible as any of the stars in the Little Dipper. The comet’s closest approach to Earth is on March 5 when it will be about 62 million miles away. It should become easier to spot until March 8, because it will rise earlier and earlier in the morning but it will also become dimmer.

The comet is now a pre-dawn object that rises almost directly in the east a few minutes before 4AM – left of a dazzling white star that is actually the planet Venus. It appears as a tiny star when viewed straight on but through binoculars, a tail that points away from the direction of sunrise is evident. Each day it will rise earlier than the previous and by March 8, Comet Pojmanski will have risen to a fourth of the distance between the horizon and directly overhead at the start of dawn.

I took this image on the morning of March 3, 2006 from my remotely controlled observatory in south central New Mexico located at an elevation of about 7,200 feet above sea level. I combined twelve separate images taken through red, green and blue filters to create this full color portrait. Digital processing enabled me to freeze the comet’s motion that occurred during the thirty-minute exposure period. The picture was taken through a twenty inch Ritchey-Chretien telescope with an eleven-mega pixel camera specially designed for astronomical imaging.

Do you have photos you’d like to share? Post them to the Universe Today astrophotography forum or email them, and we might feature one in Universe Today.

Written by R. Jay GaBany

Researchers mimic high-pressure form of ice found in giant icy moons

Jupiter’s icy moon Callisto. Image credit: NASA Click to enlarge
As scientists learn more about our Solar System, they’ve found water ice in some unusual situations. One of the most intriguing of these environments is on icy moons, like Jupiter’s Europa, and Uranus’ Triton. Researchers at the Lawrence Livermore National Laboratory have recreated this kind of ice in their laboratory; ice that probably mimics the conditions of pressure, temperature, stress, and grain size found on these moons. This ice can slowly creep and swirl around depending on the temperature of the moons’ interiors.

That everyday ice you use to chill your glass of lemonade has helped researchers better understand the internal structure of icy moons in the far reaches of the solar system.

A research team has demonstrated a new kind of “creep,” or flow, in a high-pressure form of ice by creating in a laboratory the conditions of pressure, temperature, stress, and grain size that mimic those in the deep interiors of large icy moons.

High-pressure phases of ice are major components of the giant icy moons of the outer solar system: Jupiter’s Ganymede and Callisto, Saturn’s Titan, and Neptune’s Triton. Triton is roughly the size of our own moon; the other three giants are about 1.5 times larger in diameter. Accepted theory says that most of the icy moons condensed as “dirty snowballs” from the dust cloud around the sun (the solar nebula) about 4.5 billion years ago. The moons were warmed internally by this accretionary process and by radioactive decay of their rocky fraction.

The convective flow of ice (much like the swirls in a hot cup of coffee) in the interiors of the icy moons controlled their subsequent evolution and present-day structure. The weaker the ice, the more efficient the convection, and the cooler the interiors. Conversely, the stronger the ice, the warmer the interiors and the greater the possibility of something like a liquid internal ocean appearing.

The new research reveals in one of the high-pressure phases of ice (“ice II”) a creep mechanism that is affected by the crystallite or “grain” size of the ice. This finding implies a significantly weaker ice layer in the moons than previously thought. Ice II first appears at pressures of about 2,000 atmospheres, which corresponds to a depth of about 70 km in the largest of the icy giants. The ice II layer is roughly 100 km thick. The pressure levels at the centers of the icy giant moons eventually reach the equivalent of 20,000 to 40,000 Earth atmospheres.

Researchers from Lawrence Livermore National Laboratory (LLNL), Kyushu University in Japan and the U.S. Geological Survey conducted creep experiments using a low-temperature testing apparatus in the Experimental Geophysics Laboratory at LLNL. They then observed and measured ice II grain size using a cryogenic scanning electron microscope. The group found a creep mechanism that dominates flow at lower stresses and finer grain sizes. Earlier experiments at higher stresses and larger grain size activated flow mechanisms that did not depend on grain size.

The experimentalists were able to prove that the new creep mechanism was indeed related to the size of the ice grains, something that previously had only been examined theoretically.

But the measurement was no easy feat. First, they had to create ice II of very fine grain size (less than 10 micrometers, or one-tenth the thickness of a human hair). A technique of rapid cycling of pressure above and below 2,000 atmospheres eventually did the trick. Adding to that, the team maintained a very steady 2,000 atmospheres of pressure within the testing apparatus to run a low-stress deformation experiment for weeks on end. Finally, to delineate the ice II grains and make them visible in the scanning electron microscope, the team developed a method of marking the grain boundaries with the common form of ice (“ice I”), which appeared different from ice II in the microscope. Once the boundaries were identified, the team could measure ice II’s grain size.

“These new results show that the viscosity of a deep icy mantle is much lower than we previously thought,” said William Durham, a geophysicist in Livermore’s Energy and Environment Directorate.

Durham said the high-quality behavior of the test apparatus at 2,000 atmospheres pressure, the collaboration with Tomoaki Kubo of Kyushu University, and success in overcoming serious technical challenges made for a fortuitous experiment.

Using the new results, the researchers conclude that it is likely the ice deforms by the grain size-sensitive creep mechanism in the interior of icy moons when the grains are up to a centimeter in size.

“This newly discovered creep mechanism will change our thinking of the thermal evolution and internal dynamics of medium- and large-size moons of the outer planets in our solar system,” Durham said. “The thermal evolution of these moons can help us explain what was happening in the early solar system.”

The research appears in the March 3 issue of the journal Science.

Founded in 1952, Lawrence Livermore National Laboratory has a mission to ensure national security and apply science and technology to the important issues of our time. Lawrence Livermore National Laboratory is managed by the University of California for the U.S. Department of Energy’s National Nuclear Security Administration.

Original Source: LLNL News Release

Andromeda’s Origin is Similar to That of the Milky Way

Andromeda Galaxy taken in ultraviolet. Image credit: GALEX Click to enlarge
Astronomers have long believed that the Andromeda galaxy had a different upbringing from our own Milky Way, but now it seems we aren’t so different after all. An international team of researchers have completed a survey of the metal content in Andromeda’s halo, and found that it’s relatively metal poor – just like the Milky Way. If both galaxies have the same amount of metal in their halos, that means they probably evolved in similar ways; both got started half a billion years after the Big Bang and grew from a collection of protogalactic fragments.

For the last decade, astronomers have thought that the Andromeda galaxy, our nearest galactic neighbor, was rather different from the Milky Way. But a group of researchers have determined that the two galaxies are probably quite similar in the way they evolved, at least over their first several billion years.

In an upcoming issue of the Astrophysical Journal, Scott Chapman of the California Institute of Technology, Rodrigo Ibata of the Observatoire de Strasbourg, and their colleagues report that their detailed studies of the motions and metals of nearly 10,000 stars in Andromeda show that the galaxy’s stellar halo is “metal-poor.” In astronomical parlance, this means that the stars lying in the outer bounds of the galaxy are pretty much lacking in all the elements heavier than hydrogen.

This is surprising, says Chapman, because one of the key differences thought to exist between Andromeda and the Milky Way was that the former’s stellar halo was metal-rich and the latter’s was metal-poor. If both galaxies are metal-poor, then they must have had very similar evolutions.

“Probably, both galaxies got started within a half billion years of the Big Bang, and over the next three to four billion years, both were building up in the same way by protogalactic fragments containing smaller groups of stars falling into the two dark-matter haloes,” Chapman explains.

While no one yet knows what dark matter is made of, its existence is well established because of the mass that must exist in galaxies for their stars to orbit the galactic centers the way they do. Current theories of galactic evolution, in fact, assume that dark-matter wells acted as a sort of “seed” for today’s galaxies, with the dark matter pulling in smaller groups of stars as they passed nearby. What’s more, galaxies like Andromeda and the Milky Way have each probably gobbled up about 200 smaller galaxies and protogalactic fragments over the last 12 billion years.

Chapman and his colleagues arrived at the conclusion about the metal-poor Andromeda halo by obtaining careful measurements of the speed at which individual stars are coming directly toward or moving directly away from Earth. This measure is called the radial velocity, and can be determined very accurately with the spectrographs of major instruments such as the 10-meter Keck-II telescope, which was used in the study.

Of the approximately 10,000 Andromeda stars for which the researchers have obtained radial velocities, about 1,000 turned out to be stars in the giant stellar halo that extends outward by more than 500,000 light-years. These stars, because of their lack of metals, are thought to have formed quite early, at a time when the massive dark-matter halo had captured its first protogalactic fragments.

The stars that dominate closer to the center of the galaxy, by contrast, are those that formed and merged later, and contain heavier elements due to stellar evolution processes.

In addition to being metal-poor, the stars of the halo follow random orbits and are not in rotation. By contrast, the stars of Andromeda’s visible disk are rotating at speeds upwards of 200 kilometers per second.

According to Ibata, the study could lead to new insights on the nature of dark matter. “This is the first time we’ve been able to obtain a panoramic view of the motions of stars in the halo of a galaxy,” says Ibata. “These stars allow us to weigh the dark matter, and determine how it decreases with distance.”

In addition to Chapman and Ibata, the other authors are Geraint Lewis of the University of Sydney; Annette Ferguson of the University of Edinburgh; Mike Irwin of the Institute of Astronomy in Cambridge, England; Alan McConnachie of the University of Victoria; and Nial Tanvir of the University of Hertfordshire.

Original Source: Caltech News Release

Shock Wave in Stephan’s Quintet Galaxy

Shock wave in Stephen’s Quintet captured by Spitzer. Image credit: NASA/JPL-Caltech. Click to enlarge
This photograph, taken by the Spitzer space telescope and a ground-based telescope in Spain, shows the Stephan’s Quintet galaxy cluster, with one of the largest shockwaves ever seen in the Universe. The green arc in the photograph is the point which two galaxies are colliding. There are actually 5 galaxies in this photograph, but two have been so beaten up, all that’s left are their bright centers. The galaxies are located 300 million light-years away in the Pegasus constellation.

This false-color composite image of the Stephan’s Quintet galaxy cluster clearly shows one of the largest shock waves ever seen (green arc), produced by one galaxy falling toward another at over a million miles per hour. It is made up of data from NASA’s Spitzer Space Telescope and a ground-based telescope in Spain.

Four of the five galaxies in this image are involved in a violent collision, which has already stripped most of the hydrogen gas from the interiors of the galaxies. The centers of the galaxies appear as bright yellow-pink knots inside a blue haze of stars, and the galaxy producing all the turmoil, NGC7318b, is the left of two small bright regions in the middle right of the image. One galaxy, the large spiral at the bottom left of the image, is a foreground object and is not associated with the cluster.

The titanic shock wave, larger than our own Milky Way galaxy, was detected by the ground-based telescope using visible-light wavelengths. It consists of hot hydrogen gas. As NGC7318b collides with gas spread throughout the cluster, atoms of hydrogen are heated in the shock wave, producing the green glow.

Spitzer pointed its infrared spectrograph at the peak of this shock wave (middle of green glow) to learn more about its inner workings. This instrument breaks light apart into its basic components. Data from the instrument are referred to as spectra and are displayed as curving lines that indicate the amount of light coming at each specific wavelength.

The Spitzer spectrum showed a strong infrared signature for incredibly turbulent gas made up of hydrogen molecules. This gas is caused when atoms of hydrogen rapidly pair-up to form molecules in the wake of the shock wave. Molecular hydrogen, unlike atomic hydrogen, gives off most of its energy through vibrations that emit in the infrared.

This highly disturbed gas is the most turbulent molecular hydrogen ever seen. Astronomers were surprised not only by the turbulence of the gas, but by the incredible strength of the emission. The reason the molecular hydrogen emission is so powerful is not yet completely understood.

Stephan’s Quintet is located 300 million light-years away in the Pegasus constellation.

This image is composed of three data sets: near-infrared light (blue) and visible light called H-alpha (green) from the Calar Alto Observatory in Spain, operated by the Max Planck Institute in Germany; and 8-micron infrared light (red) from Spitzer’s infrared array camera.

Original Source: Spitzer Space Telescope