Iapetus in Dark and Light

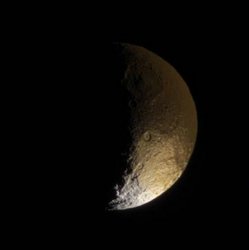
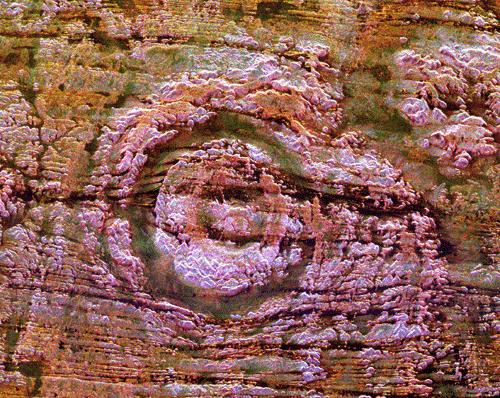
Saturn’s moon Iapetus. Image credit: NASA/JPL/SSI. Click to enlarge
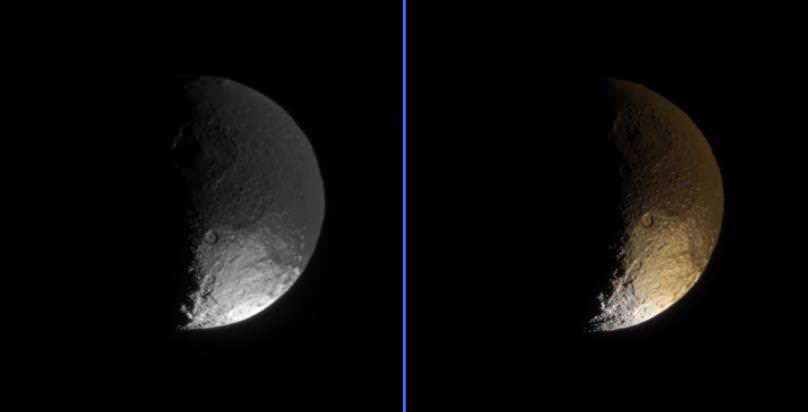
Cassini captured these images of Saturn’s moon Iapetus, with opposing bright and dark hemispheres. The dark terrain extends from the equator to the mid southern regions, and then becomes more patchy leading to its bright south pole. Cassini took this photograph on April 9, 2006, at a distance of approximately 692,000 kilometers (430,000 miles) from Iapetus.

Cassini’s landmark investigation of Saturn’s yin-yang moon Iapetus, with its bright and dark hemispheres, continues to provide insights into the nature of this intriguing body.

These two views of Iapetus primarily show terrain in the southern part of the moon’s dark leading hemisphere — the side of Iapetus that is coated with dark material. The bright south pole of Iapetus is visible, along with some terrain (at the bottom) that lies on the bright trailing hemisphere.

The dark terrain known as Cassini Regio is uniformly dark between the equator and about 30 degrees south latitude. From there down to about 50 to 60 degrees south latitude, the dark material looks “patchy” because south-facing crater walls are bright (being largely devoid of the dark material). South of this region, only some northward-facing crater walls are still dark, while the bright terrain has a somewhat reddish color.

See Dark-stained Iapetus for an up-close view of this transition in the northern hemisphere.

Beyond 90 degrees south (i.e., on the trailing side), the reddish color becomes white. The region at the bottom of the color view presented here shows this “color boundary” in the bright terrain, which also marks the boundary between the leading and trailing hemispheres.

Iapetus is 1,468 kilometers (912 miles) across. North is up in the monochrome image and rotated 16 degrees to the left in the color image.

The monochrome image on the left was taken using a filter sensitive to wavelengths of infrared light centered at 930 nanometers. The image was obtained with the Cassini spacecraft narrow-angle camera on April 8, 2006, at a distance of approximately 866,000 kilometers (538,000 miles) from Iapetus and at a Sun-Iapetus-spacecraft, or phase, angle of 88 degrees. The image scale is 5 kilometers (3 miles) per pixel.

The color view on the right was created by combining images taken in ultraviolet, green and infrared spectral filters. The images were acquired with the Cassini spacecraft narrow-angle camera on April 9, 2006, at a distance of approximately 692,000 kilometers (430,000 miles) from Iapetus and at a Sun-Iapetus-spacecraft, or phase, angle of 101 degrees. The image scale is 4 kilometers (2.5 miles) per pixel.

The Cassini-Huygens mission is a cooperative project of NASA, the European Space Agency and the Italian Space Agency. The Jet Propulsion Laboratory, a division of the California Institute of Technology in Pasadena, manages the mission for NASA’s Science Mission Directorate, Washington, D.C. The Cassini orbiter and its two onboard cameras were designed, developed and assembled at JPL. The imaging operations center is based at the Space Science Institute in Boulder, Colo.

For more information about the Cassini-Huygens mission visit http://saturn.jpl.nasa.gov . The Cassini imaging team homepage is at http://ciclops.org .

Original Source: NASA/JPL/SSI News Release

Three Storms on Saturn

Three big vortices swirling through Saturn’s southern latitudes. Image credit: NASA/JPL/SSI. Click to enlarge
Three giant storms swirl across the atmosphere of Saturn in this photograph taken by Cassini – the two in the upper part of the photo appear to be interacting. This image was taken by Cassini on April 15 when the spacecraft was approximately 3.9 million kilometers (2.4 million miles) from Saturn.

Three large and impressive vortices, including two that appear to be interacting, are captured here as they swirl through Saturn’s active southern latitudes.

This view shows latitudes slightly to the north of those seen in Round and Round They Go and was taken a few minutes prior to the left side image in that release.

The image was taken with the Cassini spacecraft narrow-angle camera using a spectral filter sensitive to wavelengths of infrared light centered at 750 nanometers. The image was acquired on April 15, 2006, at a distance of approximately 3.9 million kilometers (2.4 million miles) from Saturn. The image scale is 23 kilometers (14 miles) per pixel.

The Cassini-Huygens mission is a cooperative project of NASA, the European Space Agency and the Italian Space Agency. The Jet Propulsion Laboratory, a division of the California Institute of Technology in Pasadena, manages the mission for NASA’s Science Mission Directorate, Washington, D.C. The Cassini orbiter and its two onboard cameras were designed, developed and assembled at JPL. The imaging operations center is based at the Space Science Institute in Boulder, Colo.

For more information about the Cassini-Huygens mission visit http://saturn.jpl.nasa.gov . The Cassini imaging team homepage is at http://ciclops.org .

Original Source: NASA/JPL/SSI News Release

Exposed Bedrock on Mars

Cobbles appearing on trough floors between wind-blown ripples. Image credit: NASA/JPL. Click to enlarge
NASA’s Opportunity rover captured this photograph of the surface of Mars during its trek from Erebus Crater to Victoria Crater. The image shows exposed bedrock between large windblown sand ripples. Opportunity took the photo on April 27, 2006 during its 802nd Martian day of exploration.

As NASA’s Mars Exploration Rover Opportunity continues to traverse from “Erebus Crater” toward “Victoria Crater,” the rover navigates along exposures of bedrock between large, wind-blown ripples. Along the way, scientists have been studying fields of cobbles that sometimes appear on trough floors between ripples. They have also been studying the banding patterns seen in large ripples.

This view, obtained by Opportunity’s panoramic camera on the rover’s 802nd Martian day (sol) of exploration (April 27, 2006), is a mosaic spanning about 30 degrees. It shows a field of cobbles nestled among wind-driven ripples that are about 20 centimeters (8 inches) high.

The origin of cobble fields like this one is unknown. The cobbles may be a lag of coarser material left behind from one or more soil deposits whose finer particles have blown away. The cobbles may be eroded fragments of meteoritic material, secondary ejecta of Mars rock thrown here from craters elsewhere on the surface, weathering remnants of locally-derived bedrock, or a mixture of these. Scientists will use the panoramic camera’s multiple filters to study the rock types, variability and origins of the cobbles. This is an approximately true-color rendering that combines separate images taken through the panoramic camera’s 753-nanometer, 535-nanometer and 432-nanometer filters.

Original Source: NASA News Release

“Lucky” Cluster Spacecraft Buffeted by the Solar Wind

Sketch of the different regions in of Earth’s magnetosphere. Image credit: ESA. Click to enlarge
ESA’s Cluster spacecraft were in the right place at the right time when they flew through a region of the Earth’s magnetic field that accelerates electrons to approximately 1/100th the speed of light. The region is called the electron diffusion region; a boundary just a few kilometres thick between the Earth’s magnetic field and the Sun’s. Over the course of an hour, the spacecraft were engulfed in an electron diffusion region, as the solar wind was causing this layer to move back and forth.

ESA’s Cluster satellites have flown through regions of the Earth’s magnetic field that accelerate electrons to approximately one hundredth the speed of light. The observations present Cluster scientists with their first detection of these events and give them a look at the details of a universal process known as magnetic reconnection.

On 25 January 2005, the four Cluster spacecraft found themselves in the right place at the right time: a region of space known as an electron diffusion region. It is a boundary just a few kilometres thick that occurs at an altitude of approximately 60 000 kilometres above the Earth’s surface. It marks the frontier between the Earth’s magnetic field and that of the Sun. The Sun’s magnetic field is carried to the Earth by a wind of electrically charged particles, known as the solar wind.

An electron diffusion region is like an electrical switch. When it is flipped, it uses energy stored in the Sun’s and Earth’s magnetic fields to heat the electrically charged particles in its vicinity to large speeds. In this way, it initiates a process that can result in the creation of the aurora on Earth, where fast-moving charged particles collide with atmospheric atoms and make them glow.

There is also a more sinister side to the electron diffusion regions. The accelerated particles can damage satellites by colliding with them and causing electrical charges to build up. These short circuit and destroy sensitive equipment.

Nineteen times in one hour, the Cluster quartet found themselves engulfed in an electron diffusion region. This was because the solar wind was buffeting the boundary layer, causing it to move back and forth. Each crossing of the electron diffusion region lasted just 10-20 milliseconds for each spacecraft and yet a unique instrument, known as the Electron Drift Instrument (EDI), was fast enough to measure the accelerated electrons.

The observation is important because it provides the most complete measurements yet of an electron diffusion region. “Not even the best computers in the world can simulate electron diffusion regions; they just don’t have the computing power to do it,” says Forrest Mozer, University of California, Berkeley, who led the investigation of the Cluster data.

The data will provide invaluable insights into the process of magnetic reconnection. The phenomenon occurs throughout the Universe on many different scales, anywhere there are tangled magnetic fields. In these complex situations, the magnetic fields occasionally collapse into more stable configurations. This is the reconnection and releases energy through electron diffusion regions. On the Sun, magnetic reconnection drives the solar flares that occasionally release enormous amounts of energy above sunspots.

This work may also have an important bearing on solving energy needs on Earth. Nuclear physicists trying to build fusion generators attempt to create stable magnetic fields in their reactors but are plagued by reconnection events that ruin their configurations. If the process of reconnection can be understood, perhaps ways of preventing it in nuclear reactors will become clear.

However, that still lies in the future. “We need to do a lot more science before we fully understand reconnection,” says Mozer, whose aim is now to understand which solar wind conditions trigger the reconnection events and their associated electron diffusion regions seen by Cluster.

Original Source: ESA Portal

Massive Stars Slowed Early Galaxy Growth

An illustartion of an early dwarf galaxy surrounded by red hydrogen gas. Image credit: David A. Aguilar/CfA. Click to enlarge
Shortly after the Big Bang, large clouds of hydrogen collapsed easily into the first galaxies and stars. These weren’t stars like our Sun; however, they were hot, massive and very short lived – blasting their environment with ultraviolet radiation. But after the first 100 million years of the Universe, it became very difficult for these dwarf galaxies to grow any larger as this radiation sabotaged further growth. Only the gravity of the largest galaxies could overcome this heat and pressure to grow into larger galaxies over time.

The first galaxies were small – about 10,000 times less massive than the Milky Way. Billions of years ago, those mini-furnaces forged a multitude of hot, massive stars. In the process, they sowed the seeds for their own destruction by bathing the universe in ultraviolet radiation. According to theory, that radiation shut off further dwarf galaxy formation by both ionizing and heating surrounding hydrogen gas. Now, astronomers Stuart Wyithe (University of Melbourne) and Avi Loeb (Harvard-Smithsonian Center for Astrophysics) are presenting direct evidence in support of this theory.

Wyithe and Loeb showed that fewer, larger galaxies, rather than more numerous, smaller galaxies, dominated the billion-year-old universe. Dwarf galaxy formation essentially shut off only a few hundred million years after the Big Bang.

“The first dwarf galaxies sabotaged their own growth and that of their siblings,” says Loeb. “This was theoretically expected, but we identified the first observational evidence for the self-destructive behavior of early galaxies.”

Their research is being reported in the May 18, 2006 issue of Nature.

Nearly 14 billion years ago, the Big Bang filled the universe with hot matter in the form of electrons and hydrogen and helium ions. As space expanded and cooled, electrons and ions combined to form neutral atoms. Those atoms efficiently absorbed light, yielding a pervasive dark fog throughout space. Astronomers have dubbed this era the “Dark Ages.”

The first generation of stars began clearing that fog by bathing the universe in ultraviolet radiation. UV radiation splits atoms into negatively charged electrons and positively charged ions in a process called ionization. Since the Big Bang created an ionized universe that later became neutral, this second phase of ionization by stars is known as the “epoch of reionization.” It took place in the first few hundred million years of existence.

“We want to study this time period because that’s when the primordial soup evolved into the rich zoo of objects we now see,” said Loeb.

During this key epoch in the history of the universe, gas was not only ionized, but also heated. While cool gas easily clumps together to form stars and galaxies, hot gas refuses to be constrained. The hotter the gas, the more massive a galactic “seed” must be to attract enough matter to become a galaxy.

Before the epoch of reionization, galaxies containing only 100 million solar masses of material could form easily. After the epoch of reionization, galaxies required more than 10 billion solar masses of material to be assembled.

To determine typical galaxy masses, Wyithe and Loeb looked at light from quasars – powerful light sources visible across vast distances. The light from the farthest known quasars left them nearly 13 billion years ago, when the universe was a fraction of its present age. Quasar light is absorbed by intervening clouds of hydrogen associated with early galaxies, leaving telltale bumps and wiggles in the quasar’s spectrum.

By comparing the spectra of different quasars along different lines of sight, Wyithe and Loeb determined typical galaxy sizes in the infant universe. The presence of fewer, larger galaxies leads to more variation in the absorption seen along various lines of sight. Statistically, large variation is exactly what Wyithe and Loeb found.

“As an analogy, suppose you are in a room where everybody is talking,” explains Wyithe. “If this room is sparsely populated, then the background noise is louder in some parts of the room than others. However if the room is crowded, then the background noise is the same everywhere. The fact that we see fluctuations in the light from quasars implies that the early universe was more like the sparse room than the crowded room.”

Astronomers hope to confirm the suppression of dwarf galaxy formation using the next generation of telescopes – both radio telescopes that can detect distant hydrogen and infrared telescopes that can directly image young galaxies. Within the next decade, researchers using these new instruments will illuminate the “Dark Ages” of the universe.

Headquartered in Cambridge, Mass., the Harvard-Smithsonian Center for Astrophysics (CfA) is a joint collaboration between the Smithsonian Astrophysical Observatory and the Harvard College Observatory. CfA scientists, organized into six research divisions, study the origin, evolution and ultimate fate of the universe.

Original Source: CfA News Release

Amateur Team Finds an Extrasolar Planet

Artist’s Concept of Transiting Planet XO-1b. Image credit: NASA/ESA/STScI. Click to enlarge
Amateur astronomers have used inexpensive equipment to discover a Jupiter-sized planet orbiting a Sun-like star 600 light-years away. The team used the “transit method”, to watch how a star dims slightly as a planet passes in front. An automated telescope observed tens of thousands of bright stars, and then the team chose a few dozen promising candidates. The new planet, dubbed X0-1b is the 10th planet ever discovered using the transit method.

An international team of professional and amateur astronomers, using simple off-the-shelf equipment to trawl the skies for planets outside our solar system, has hauled in its first “catch.”

The astronomers discovered a Jupiter-sized planet orbiting a Sun-like star 600 light-years from Earth in the constellation Corona Borealis. The team, led by Peter McCullough of the Space Telescope Science Institute in Baltimore, Md., includes four amateur astronomers from North America and Europe.

Using modest telescopes to search for extrasolar planets allows for a productive collaboration between professional and amateur astronomers that could accelerate the planet quest.

“This discovery suggests that a fleet of modest telescopes and the help of amateur astronomers can search for transiting extrasolar planets many times faster than we are now,” McCullough said. The finding has been accepted for publication in the Astrophysical Journal.

McCullough deployed a relatively inexpensive telescope made from commercial equipment to scan the skies for extrasolar planets. Called the XO telescope, it consists of two 200-millimeter telephoto camera lenses and looks like a pair of binoculars. The telescope is on the summit of the Haleakala volcano, in Hawaii.

“To replicate the XO prototype telescope would cost $60,000,” McCullough explained. “We have spent far more than that on software, in particular on designing and operating the system and extracting this planet from the data.”

McCullough’s team found the planet, dubbed X0-1b, by noticing slight dips in the star’s light output when the planet passed in front of the star, called a transit. The light from the star, called XO-1, dips by approximately 2 percent when the planet XO-1b passes in front of it. The observation also revealed that X0-1b is in a tight four-day orbit around its parent star.

Although astronomers have detected more than 180 extrasolar planets, X0-1b is only the tenth planet discovered using the transit method. It is the second planet found using telephoto lenses. The first, dubbed TrES-1, was reported in 2004. The transit method allows astronomers to determine a planet’s mass and size. Astronomers use this information to deduce the planet’s characteristics, such as its density.

The team confirmed the planet’s existence by using the Harlan J. Smith Telescope and the Hobby-Eberly Telescope at the University of Texas’s McDonald Observatory to measure the slight wobble induced by the planet on its parent star. This so-called radial-velocity method allowed the team to calculate a precise mass for the planet, which is slightly less than that of Jupiter (about 0.9 Jupiter masses). The planet also is much larger than its mass would suggest. “Of the planets that pass in front of their stars, XO-1b is the most similar to Jupiter yet known, and the star XO-1 is the most similar to the Sun,” McCullough said, although he was quick to add, “but XO-1b is much, much closer to its star than Jupiter is to the Sun.”

The astronomer’s innovative technique of using relatively inexpensive telescopes to look for eclipsing planets favors finding planets orbiting close to their parent stars. The planet also must be large enough to produce a measurable dip in starlight.

The planet is the first discovered in McCullough’s three-year search for transiting extrasolar planets. The planet quest is underwritten by a grant from NASA’s Origins program.

McCullough’s planet-finding technique involves nightly sweeps of the sky using the XO telescope in Hawaii to note the brightness of the stars it encounters. A computer software program sifts through many thousands of stars every two months looking for tiny dips in the stars’ light, the signature of a possible planetary transit. The computer comes up with a few hundred possibilities. From those candidates, McCullough and his team select a few dozen promising leads. He passes these stars on to the four amateur astronomers to study the possible transits more carefully.

From September 2003 to September 2005, the XO telescope observed tens of thousands of bright stars. In that time, his team of amateur astronomers studied a few dozen promising candidate stars identified by McCullough and his team. The star X0-1 was pegged as a promising candidate in June 2005. The amateur astronomers observed it in June and July 2005, confirming that a planet-sized object was eclipsing the star. McCullough’s team then turned to the McDonald Observatory in Texas to obtain the object’s mass and verify it as a planet. He received the news of the telescope’s observation at 12:06 a.m. Feb. 16, 2006, from Chris Johns-Krull, a friend and colleague at Rice University.

“It was a wonderful feeling because the team had worked for three years to find this one planet,” McCullough explained. “The discovery represents a few bytes out of nearly a terabyte of data: It’s like trying to distill gold out of seawater.”

The discovery also has special familial significance for the astronomer. “My father’s mentor was Harlan J. Smith, the man whose ambition and hard work produced the telescope that we used to acquire the verifying data.”

McCullough believes the newly found planet is a perfect candidate for study by the Hubble and Spitzer space telescopes. Hubble can measure precisely the star’s distance and the planet’s size. Spitzer can actually see the infrared radiation from the planet. By timing the disappearance of the planet behind the star, Spitzer also can measure the “ellipticity,” or “out-of-roundness,” of the planet’s orbit. If the orbit is elliptical, then the varying gravitational force would result in extra heating of the planet, expanding its atmosphere and perhaps explaining why the object’s diameter seems especially large for a body of its calculated mass.

“By timing the planet’s passages across the star, both amateur and professional astronomers might be lucky enough to detect the presence of another planet in the XO-1 system by its gravitational tugs on XO-1b,” McCullough said. “It’s even possible that such a planet could be similar to Earth.”

Original Source: HubbleSite News Release

Three Neptunes Orbiting Another Star

An artist’s impression of a planetary system around HD 69830. Image credit: ESO. Click to enlarge
Astronomers have discovered a nearby star that’s home to three Neptune-sized planets; no super-Jupiters here. The star, HD 69830, is located 41 light-years away in the constellation of Puppis. With magnitude 5.95, it’s just possible to see with the unaided eye. The discovery was made using the European Southern Observatory’s 3.6 metre telescope at La Silla in Chile. The planets orbit their star in 8.67, 31.6 and 197 days respectively.

Using the ultra-precise HARPS spectrograph on ESO’s 3.6-m telescope at La Silla (Chile), a team of European astronomers have discovered that a nearby star is host to three Neptune-mass planets. The innermost planet is most probably rocky, while the outermost is the first known Neptune-mass planet to reside in the habitable zone. This unique system is likely further enriched by an asteroid belt.

“For the first time, we have discovered a planetary system composed of several Neptune-mass planets”, said Christophe Lovis, from the Geneva Observatory and lead-author of the paper presenting the results.

During more than two years, the astronomers carefully studied HD 69830, a rather inconspicuous nearby star slightly less massive than the Sun. Located 41 light-years away towards the constellation of Puppis (the Stern), it is, with a visual magnitude of 5.95, just visible with the unaided eye. The astronomers’ precise radial-velocity measurements allowed them to discover the presence of three tiny companions orbiting their parent star in 8.67, 31.6 and 197 days.

“Only ESO’s HARPS instrument installed at the La Silla Observatory, Chile, made it possible to uncover these planets”, said Michel Mayor, also from Geneva Observatory, and HARPS Principal Investigator. “Without any doubt, it is presently the world’s most precise planet-hunting machine”.

The detected velocity variations are between 2 and 3 metres per second, corresponding to about 9 km/h! That’s the speed of a person walking briskly. Such tiny signals could not have been distinguished from ‘simple noise’ by most of today’s available spectrographs.

The newly found planets have minimum masses between 10 and 18 times the mass of the Earth. Extensive theoretical simulations favour an essentially rocky composition for the inner planet, and a rocky/gas structure for the middle one. The outer planet has probably accreted some ice during its formation, and is likely to be made of a rocky/icy core surrounded by a quite massive envelope. Further calculations have also shown that the system is in a dynamically stable configuration.

The outer planet also appears to be located near the inner edge of the habitable zone, where liquid water can exist at the surface of rocky/icy bodies. Although this planet is probably not Earth-like due to its heavy mass, its discovery opens the way to exciting perspectives.

“This alone makes this system already exceptional”, said Willy Benz, from Bern University, and co-author. “But the recent discovery by the Spitzer Space Telescope that the star most likely hosts an asteroid belt is adding the cherry to the cake.”

With three roughly equal-mass planets, one being in the habitable zone, and an asteroid belt, this planetary system shares many properties with our own solar system.

“The planetary system around HD 69830 clearly represents a Rosetta stone in our understanding of how planets form”, said Michel Mayor. “No doubt it will help us better understand the huge diversity we have observed since the first extra-solar planet was found 11 years ago.”

Original Source: ESO News Release

Before the Big Bang

Researchers have developed a model of a shrinking universe that existed prior to the Big Bang. Image credit: NASA. Click to enlarge
The Big Bang describes how the Universe began as a single point 13.7 billion years ago, and has been expanding ever since, but it doesn’t explain what happened before that. Researchers from Penn State University believe that there should be traces of evidence in our current universe that could used to look back before the Big Bang. According to their research, there was a contracting universe with similar space-time geometry to our expanding universe. The universe collapsed and then “bounced” as the Big Bang.

According to Einstein’s general theory of relativity, the Big Bang represents The Beginning, the grand event at which not only matter but space-time itself was born. While classical theories offer no clues about existence before that moment, a research team at Penn State has used quantum gravitational calculations to find threads that lead to an earlier time. “General relativity can be used to describe the universe back to a point at which matter becomes so dense that its equations don’t hold up,” says Abhay Ashtekar, Holder of the Eberly Family Chair in Physics and Director of the Institute for Gravitational Physics and Geometry at Penn State. “Beyond that point, we needed to apply quantum tools that were not available to Einstein.” By combining quantum physics with general relativity, Ashtekar and two of his post-doctoral researchers, Tomasz Pawlowski and Parmpreet Singh, were able to develop a model that traces through the Big Bang to a shrinking universe that exhibits physics similar to ours.

In research reported in the current issue of Physical Review Letters, the team shows that, prior to the Big Bang, there was a contracting universe with space-time geometry that otherwise is similar to that of our current expanding universe. As gravitational forces pulled this previous universe inward, it reached a point at which the quantum properties of space-time cause gravity to become repulsive, rather than attractive. “Using quantum modifications of Einstein’s cosmological equations, we have shown that in place of a classical Big Bang there is in fact a quantum Bounce,” says Ashtekar. “We were so surprised by the finding that there is another classical, pre-Big Bang universe that we repeated the simulations with different parameter values over several months, but we found that the Big Bounce scenario is robust.”

While the general idea of another universe existing prior to the Big Bang has been proposed before, this is the first mathematical description that systematically establishes its existence and deduces properties of space-time geometry in that universe.

The research team used loop quantum gravity, a leading approach to the problem of the unification of general relativity with quantum physics, which also was pioneered at the Penn State Institute of Gravitational Physics and Geometry. In this theory, space-time geometry itself has a discrete ‘atomic’ structure and the familiar continuum is only an approximation. The fabric of space is literally woven by one-dimensional quantum threads. Near the Big-Bang, this fabric is violently torn and the quantum nature of geometry becomes important. It makes gravity strongly repulsive, giving rise to the Big Bounce.

“Our initial work assumes a homogenous model of our universe,” says Ashtekar. “However, it has given us confidence in the underlying ideas of loop quantum gravity. We will continue to refine the model to better portray the universe as we know it and to better understand the features of quantum gravity.”

The research was sponsored by the National Science Foundation, the Alexander von Humboldt Foundation, and the Penn State Eberly College of Science.

Original Source: PSU News Release

Searching For Crater Chains on the Earth

Aorounga impact crater. Image credit: NASA/JPL. Click to enlarge
Comet 73P/Schwassmann Wachmann 3 is a beautiful sight in the night sky, especially now that it’s fractured into many pieces. There’s evidence for these kinds of impacts on several planets and moons in the Solar System, and astronomers watched 23 fragments of Comet Shoemaker-Levy 9 smash into Jupiter in 1993. What if a string of comet fragments like this hit the Earth? There are only a few examples of these kinds of impacts on the Earth; unfortunately, wind, rain and tectonic forces work to hide the evidence.

As the fragments of shattered comet 73P/Schwassmann Wachmann 3 glide harmlessly past Earth this month in full view of backyard telescopes, onlookers can’t help but wonder, what if a comet like that didn’t miss, but actually hit our planet?

For the answer to that question, we look to the Sahara desert.

In a remote windswept area named Aorounga, in Chad, there are three craters in a row, each about 10 km in diameter. “We believe this is a ‘crater chain’ formed by the impact of a fragmented comet or asteroid about 400 million years ago in the Late Devonian period,” explains Adriana Ocampo of NASA headquarters.

Ocampo and colleagues discovered the chain in 1996. The main crater “Aorounga South” had been known for many years?it sticks out of the sand and can be seen from airplanes and satellites. But a second and possibly third crater were buried. They lay hidden until radar onboard the space shuttle (SIR-C) penetrated the sandy ground, revealing their ragged outlines.

“Here on Earth, crater chains are rare,” says Ocampo, but they are common in other parts of the solar system.

The first crater chains were discovered by NASA’s Voyager 1 spacecraft. In 1979 when the probe flew past Jupiter’s moon Callisto, cameras recorded a line of craters, at least fifteen long, evenly spaced as if someone had strafed the moon with a Gatling gun. Eventually, eight chains were found on Callisto and three more on Ganymede.

At first the chains were a puzzle. Were they volcanic? Had an asteroid skipped along the surface of Callisto like a stone skipping across a pond?

The mystery was solved in 1993 with the discovery of Comet Shoemaker-Levy 9. SL-9 was not a single comet, but a “string of pearls,” a chain of 21 comet fragments created a year earlier when Jupiter’s gravity ripped the original comet apart. SL-9 struck back in 1994, crashing into Jupiter. Onlookers watched titanic explosions in the giant planet’s atmosphere, and it only took a little imagination to visualize the result if Jupiter had had a solid surface: a chain of craters.

Astronomers have since realized that fragmented comets and rubble-pile asteroids are commonplace. Comets fall apart rather easily; sunlight alone can shatter their fragile nuclei. Furthermore, there is mounting evidence that many seemingly solid asteroids are assemblages of boulders, dust and rock held together by feeble gravity. When these things hit, they make chains.

In 1994, researchers Jay Melosh and Ewen Whitaker announced their finding of two crater chains on the Moon. One, on the floor of the crater Davy, is spectacular–an almost perfect line of 23 pockmarks each a few miles in diameter. This proved that crater chains exist in the Earth-Moon system.

But where on Earth are they?

Earth tends to hide its craters. “Wind and rain erode them, sediments fill them in, and the tectonic recycling of Earth’s crust completely obliterates them,” says Ocampo. On the Moon, there are millions of well-preserved craters. On Earth, “so far we’ve managed to find only about 174.”

Sounds like a job for Google. Seriously. Amateur astronomer Emilio Gonzalez pioneered the technique in March 2006. “I use Google Earth,” he explains. Google Earth is a digital map of our planet made of stitched-together satellite images. You can zoom in and out, fly around and inspect the landscape in impressive detail. It’s a bit like a video game-except it is real.

Gonzalez began by calling up Kebira impact crater in Libya?the Sahara’s largest. It was so easy to see, he recalls, “I decided to look around for more.” Minutes later he was “flying” over the Libya-Chad border when another crater appeared. And then another. They both had multiple rings and a central peak, the telltale splash of a high-energy impact. “It couldn’t be this easy!” he marveled.

But it was. At least one of the craters had never been catalogued before, and both, almost incredibly, lined up with the Aorounga crater 200 km away: map. In less than 30 minutes, Gonzalez had found two good impact candidates and possibly multiplied the length of the Aorounga chain. Hours of additional searching produced no new results. “Beginner’s luck,” he laughs. (If you would like to hunt for your own craters online, Gonzalez offers these tips.)

Ocampo doubts that these new craters are related to Aorounga. “They don’t appear to be the same age.” But she can’t rule it out either.

“We need to do some fieldwork,” she says. To prove a crater is a crater-and not, say, a volcano-researchers must visit the site to look for signs of extraterrestrial impact such as “shatter cones” and other minerals forged by intense heat and pressure. This kind of geological study can also reveal the age of an impact site, marking it as part of a chain or an independent event.

Answers may have to wait. Civil war in Chad and the possibility of war between Chad and Sudan prevent scientists from mounting an expedition. Meanwhile, researchers are scrutinizing candidate chains in Missouri and Spain. Although those sites are more accessible than Chad, researchers still can’t decide if they are chains or not. It’s difficult work.

Ocampo believes it’s worth the effort. “The history of Earth is shaped by impacts,” she says. “Crater chains can tell us important things about our planet.”

And so the search goes on.

Original Source: NASA News Release

Galaxy Clusters Have Different Supernova Yields

Clusters of galaxies as seen by XMM-Newton. Image credit: ESA. Click to enlarge
Galaxy clusters are the largest objects in the Universe. Each cluster can contain hundreds or even thousands of galaxies held together by gravity. These clusters are filled with hot gas, emitting a tremendous amount of X-ray radiation. ESA’s XMM-Newton observatory recently watched two galaxy clusters enabling astronomers to learn that these clusters have higher quantities of Type 1a supernovae – exploding white dwarf stars – than our own galaxy.

Deep observations of two X-ray bright clusters of galaxies with ESA’s XMM-Newton satellite allowed a group of international astronomers to measure their chemical composition with an unprecedented accuracy. Knowing the chemical composition of galaxy clusters is of crucial importance to understanding the origin of chemical elements in the Universe.

Clusters, or conglomerates, of galaxies are the largest objects in the Universe. By looking at them through optical telescopes it is possible to see hundreds or even thousands of galaxies occupying a volume a few million light years across. However, such telescopes only reveal the tip of the iceberg. In fact most of the atoms in galaxy clusters are in the form of hot gas emitting X-ray radiation, with the mass of the hot gas five times larger than the mass in the cluster’s galaxies themselves.

Most of the chemical elements produced in the stars of galaxy clusters – expelled into the surrounding space by supernova explosions and by stellar winds – become part of the hot X-ray emitting gas. Astronomers divide supernovae into two basic types: ‘core collapse’ and ‘Type Ia’ supernovae. The ‘core collapse’ supernovae originate when a star at the end of its life collapses into a neutron star or a black hole. These supernovae produce lots of oxygen, neon and magnesium. The Type Ia supernovae explode when a white dwarf star consuming matter from a companion star becomes too massive and completely disintegrates. This type produces lots of iron and nickel.

Respectively in November 2002 and August 2003, and for one and a half day each time, XMM-Newton’s made deep observations of the two galaxy clusters called ‘Sersic 159-03’ and ‘2A 0335+096’. Thanks to these data the astronomers could determine the abundances of nine chemical elements in the clusters ‘plasma’ ??bf? a gas containing charged particles such as ions and electrons.

These elements include oxygen, iron, neon, magnesium, silicon, argon, calcium, nickel, and – detected for the first time ever in a galaxy cluster – chromium. “Comparing the abundances of the detected elements to the yields of supernovae calculated theoretically, we found that about 30 percent of the supernovae in these clusters were exploding white dwarfs (‘Type Ia’) and the rest were collapsing stars at the end of their lives (‘core collapse’),” said Norbert Werner, from the SRON Netherlands Institute for Space Research (Utrecht, Netherlands) and one of the lead authors of these results.

“This number is in between the value found for our own Galaxy (where Type Ia supernovae represent about 13 percent of the supernovae ‘population’) and the current frequency of supernovae events as determined by the Lick Observatory Supernova Search project (according to which about 42 percent of all observed supernovae are Type Ia),” he continued.

The astronomers also found that all supernova models predict much less calcium than what is observed in clusters and that the observed nickel abundance cannot be reproduced by these models. These discrepancies indicate that that the details of supernova enrichment is not yet clearly understood. Since clusters of galaxies are believed to be fair samples of the Universe, their X-ray spectroscopy can help to improve the supernova models.

The spatial distribution of elements across a cluster also holds information about the history of clusters themselves. The distribution of elements in 2A 0335+096 indicates an ongoing merger. The distribution of oxygen and iron across Sersic 159-03 indicates that while most of the enrichment by the core collapse supernovae happened long time ago, Type Ia supernovae still continue to enrich the hot gas by heavy elements especially in the core of the cluster.

Original Source: ESA Portal