International Space Station Pictures

International Space Station. Credit: NASA

With most of the construction of the International Space Station now complete, it’s quite an impressive sight to see. In fact, the space station is the brightest manmade object in space. It’s easy to see if you just know when and where to look. Check out our ISS tracking page with links to resources to find the station.

Here are some cool International Space Station pictures.


[/caption]

This is a classic artist’s rendering of what the International Space Station will look like when all of its modules have been attached.


The International Space Station.  Credit: NASA
The International Space Station. Credit: NASA

And here’s another cool picture of the International Space Station.


Space station above the Earth. Image credit: NASA

Here’s a cool image of the International Space Station captured by the space shuttle. It shows the station in orbit above the Earth.


Our Earth's horizon and the International Space Station's solar array panels are featured in this image photographed by the Expedition 17 crew in August 2008.  Credit: NASA
Our Earth's horizon and the International Space Station's solar array panels are featured in this image photographed by the Expedition 17 crew in August 2008. Credit: NASA

You don’t get to see the full station in this picture, but it’s a beautiful view of the Earth’s horizon off to the side.


The Space Station. (NASA)

Another great image of the International Space Station.

We have written many many articles about the International Space Station for Universe Today. Here’s an article about how the station is so bright now it’s visible during the daytime. Here’s a link to NASA’s gallery of space station images.

Hertzsprung-Russell diagram

The Hertzsprung-Russell Diagram.

[/caption]
Stars can be big or small, hot or cool, young or old. In order to properly organize all of the stars out there, astronomers have developed an organizational system called the Hertzsprung-Russell Diagram. This diagram is a scatter chart of stars that shows their absolute magnitude (or luminosity) versus their various spectral types and temperatures. The Hertzsprung-Russell diagram was developed by astronomers Ejnar Hertzsprung and Henry Norris Russell back in 1910.

The first Hertzsprung-Russell diagram showed the spectral type of stars on the horizontal axis and then the absolute magnitude on the vertical axis. Another version of the diagram plots the effective surface temperature of the star on one axis and the luminosity of the star on the other.

By using this diagram, astronomers are able to trace out the life cycle of stars, from young hot protostars, through the main sequence phase and into the dying red giant phases. It also shows how temperature and color relate to the stars at various stages in their lives.

If you look at an image of a Hertzsprung-Russell diagram, you can see there’s a diagonal line from the upper left to the lower right. Almost all stars fall along this line, and it’s known as the main sequence. In general, as luminosity goes down, temperature goes down as well. But there’s a branch that goes off horizontally at the 100 solar luminosity mark. These are the red giant stars nearing the end of their lives. They can be bright and cool, because they’re so large. But this stage usually only lasts a few million years.

Astronomers can also use the Hertzsprung-Russell diagram to estimate how far away stellar clusters are from Earth. By mapping out all the stars in the cluster and grouping them together and comparing them to groups of stars with known distances.

We have written many articles for Universe Today about the star life cycle. Here’s an article about the cluster M13, and how astronomers use the Hertzsprung-Russell diagram to study it.

Here are some good resources on the Internet for Hertzsprung-Russell diagram. Here’s a very simple version of the diagram from the University of Oregon, and here’s more information.

We have recorded an episode of Astronomy Cast about kinds of stars. Listen to it here, Episode 75 – Stellar Populations.

References:
http://cse.ssl.berkeley.edu/segwayed/lessons/startemp/l6.htm
http://cas.sdss.org/dr6/en/proj/advanced/hr/

Albedo Effect

Stains on the ice visible on this satellite image. Credit: British Antarctic Survey

Astronomers define the reflectivity of an object in space using a term called albedo. This is the amount of electromagnetic radiation that reflects away, compared to the amount that gets absorbed. A perfectly reflective surface would get an albedo score of 1, while a completely dark object would have an albedo of 0. Of course, it’s not that black and white in nature, and all objects have an albedo score that ranges between 0 and 1.

Here on Earth, the albedo effect has a significant impact on our climate. The lower the albedo, the more radiation from the Sun that gets absorbed by the planet, and temperatures will rise. If the albedo is higher, and the Earth is more reflective, more of the radiation is returned to space, and the planet cools.

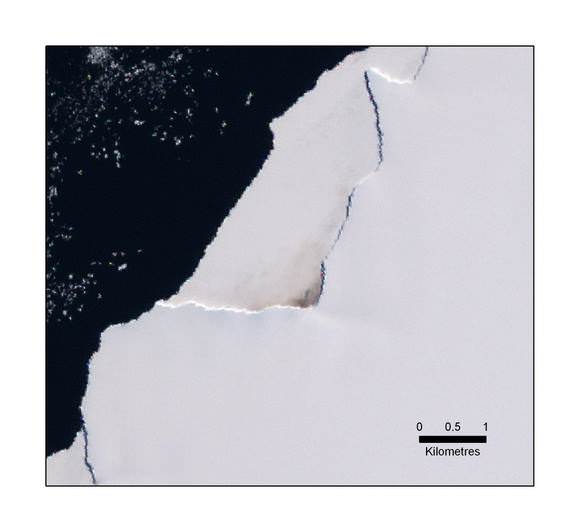
An example of this albedo effect is the snow temperature feedback. When you have a snow covered area, it reflects a lot of radiation. This is why you can get terrible sunburns when you’re skiing. But then when the snow covered area warms and melts, the albedo goes down. More sunlight is absorbed in the area and the temperatures increase. Climate scientists are concerned that global warming will cause the polar ice caps to melt. With these melting caps, dark ocean water will absorb more sunlight, and contribute even more to global warming.

Earth observation satellites are constantly measuring the Earth’s albedo using a suite of sensors, and the reflectivity of the planet can actually be measured through Earthshine – light from the Earth that reflects off the Moon.

Different parts of the Earth contribute to our planet’s overall albedo in different amounts. Trees are dark and have a low albedo, so removing trees might actually increase the albedo of an area; especially regions typically covered in snow during the winter.

Clouds can reflect sunlight, but they can also trap heat warming up the planet. At any time, about half the Earth is covered by clouds so their effect is significant.

Needless to say, the albedo effect is one of the most complicated factors in climate science, and scientists are working hard to develop better models to estimate its impact in the future.

We have written many articles about the albedo effect for Universe Today. Here’s an article discussing the albedo of the Earth, and how decreasing Earthshine could be tied to global warming.

There are some great resources out on the Internet as well. Check out this article from Scientific American Frontiers, and some cool photos of different colors of ice.

We have recorded a whole episode of Astronomy Cast just about the Earth. Listen to it here, Episode 51: Earth.

Reference:
Encyclopedia of Earth

Schwarzschild Radius

Magnetic field around a black hole. Image credit: NASA

[/caption]
A black hole is an object where the gravity is so powerful that nothing, not even light can escape it. They’re called black holes because they emit no radiation. If you take any object and compress it down, there will be a point that it becomes a black hole. If you could compress the Sun down to a radius of 2.5 km, it would be come a black hole. For the Earth, that radius is 0.9 cm. And a large mountain might be smaller than a nanometer. That radius is called the Schwarzschild Radius.

The term was named after the mathematician Karl Schwarzschild, who first developed the formula: Rs = 2 GM/c2. M is the mass of the body, G is the universal constant of gravitation, and c is the speed of light. You can use this formula to calculate the Schwarzschild radius of any object.

And so, an object smaller than its Schwarzschild radius is known as a black hole. The surface of a black hole acts as an event horizon; a point at which nothing, not even light or radiation can escape it.

What actually happens to the mass within the Schwarzschild radius is a mystery. Some theorists believe that an extremely dense state of matter will stop the black hole from compressing any further, while others believe that the black hole will continue compressing infinitely down. It’s unknown if you would encounter the black hole itself when passing through the event horizon, or if you would still continue to travel down to the compressed inner black hole itself. Whatever the case, once you pass within the Schwarzschild radius, there’s no escape.

We have written many articles about black holes for Universe Today. Here’s an article about how you can maximize your time falling into a black hole. And here’s an article about the search for medium-sized black holes.

Want more information? Check out the formula from Wolfram Research, and here’s more info from Swinburne Astronomy Online.

We have recorded an episode of Astronomy Cast all about black holes. Check it out here: Episode 18 – Black Holes Big and Small.

What is Sagittarius A*?

Detection of an unusually bright X-Ray flare from Sagittarius A*, a supermassive black hole in the center of the Milky Way galaxy. Credit: NASA/CXC/Stanford/I. Zhuravleva et al.

At the very heart of the Milky Way is a region known as Sagittarius A*. This region is known the be the home of a supermassive black hole with millions of times the mass of our own Sun. And with the discovery of this object, astronomers have turned up evidence that there are supermassive black holes at the centers most most spiral and elliptical galaxies.

The best observations of Sagittarius A*, using Very Long Baseline Interferometry (VLBI) radio astronomy have determined that it’s approximately 44 million km across (that’s just the distance of Mercury to the Sun). Astronomers have estimated that it contains 4.31 million solar masses.

Of course, astronomers haven’t actually seen the supermassive black hole itself. Instead, they have observed the motion of stars in the vicinity of Sagittarius A*. After 10 years of observations, astronomers detected the motion of a star that came within 17 light-hours distance from the supermassive black hole; that’s only 3 times the distance from the Sun to Pluto. Only a compact object with the mass of millions of stars would be able to make a high mass object like a star move in that trajectory.

The discovery of a supermassive black hole at the heart of the Milky Way helped astronomers puzzle out a different mystery: quasars. These are objects that shine with the brightness of millions of stars. We now know that quasars come from the radiation generated by the disks of material surrounding actively feeding supermassive black holes. Our own black hole is quiet today, but it could have been active in the past, and might be active again in the future.

Some astronomers have suggested other objects that could have the same density and gravity to explain Sagittarius A, but anything would quickly collapse down into a supermassive black hole within the lifetime of the Milky Way.

We have written many articles about Sagittarius A. Here’s an article about how the Milky Way’s black hole is sending out flares, and even more conclusive evidence after 16 years of observations.

Here’s an article from NASA back in 1996 showing how astronomers already suspected it was a supermassive black hole, and the original ESO press release announcing the discovery.

We have recorded an episode of Astronomy Cast all about the Milky Way. Give it a listen: Episode: 99 – The Milky Way

Source: Wikipedia

K-T Boundary

Chicxulub Crater

[/caption]
What killed the dinosaurs? That’s a question that has puzzled paleontologists since dinosaurs were first discovered. Maybe the global climate changed, maybe they were killed by disease, volcanoes, or the rise of mammals. But in the last few decades, a new theory has arisen; an asteroid strike millions of years ago drastically changed the Earth’s environment. It was this event that pushed the dinosaurs over the edge into extinction. What’s the evidence for this asteroid impact? A thin dark line found in layers of sediment around the world; evidence that something devastating happened to the planet 65 million years ago. This line is known as the K-T boundary.

What is the K-T boundary? K is actually the traditional abbreviation for the Cretaceous period, and T is the abbreviation for the Tertiary period. So the K-T boundary is the point in between the Cretaceous and Tertiary periods. Geologists have dated this period to about 65.5 million years ago.

When physicist Luis Alvarez and geologist Walter Alvarez studied the K-T boundary around the world, they found that it had a much higher concentration of iridium than normal – between 30-130 times the amount of iridium you would expect. Iridium is rare on Earth because it sank down into the center of the planet as it formed, but iridium can still be found in large concentrations in asteroids. When they compared the concentrations of iridium in the K-T boundary, they found it matched the levels found in meteorites.

The researchers were even able to estimate what kind of asteroid must have impacted the Earth 65.5 million years ago to throw up such a consistent layer of debris around the entire planet. They estimated that the impactor must have been about 10 km in diameter, and release the energy equivalent of 100 trillion tons of TNT.

When that asteroid struck the Earth 65.5 million years ago, it destroyed a region thousands of kilometers across, but also threw up a dust cloud that obscured sunlight for years. That blocked photosynthesis in plants – the base of the food chain – and eventually starved out the dinosaurs.

Researchers now think that the asteroid strike that created the K-T boundary was probably the Chicxulub Crater. This is a massive impact crater buried under Chicxulub on the coast of Yucatan, Mexico. The crater measures 180 kilometers across, and occurred about 65 million years ago.

Geologists aren’t completely in agreement about the connection between the Chicxulub impact and the extinction of the dinosaurs. Some believe that other catastrophic events might have helped push the dinosaurs over the edge, such as massive volcanism, or a series of impact events.

We have written many articles about the K-T boundary for Universe Today. Here’s an article about how the dinosaurs probably weren’t wiped out by a single asteroid, and here’s an article about how asteroids and volcanoes might have done the trick.

Here’s more information from the USGS, and an article from NASA.

We have recorded an episode of Astronomy Cast all about asteroid impacts. Listen to it here: Episode 29: Asteroids Make Bad Neighbors.

Reference:
USGS

What is a Volcanic Neck?

Devils Tower, a volcanic neck.

Remember that strange rock formation in Close Encounters of the Third Kind. It looked like the top of a toothpaste tube, but made of solid rock. That’s a volcanic neck, and it has nothing to do with space aliens. In reality, a volcanic neck is the solidified magma trapped inside a volcano. After millions of years, the softer outer layer of the volcano erodes, and all that remains is the volcanic neck. The structure in Close Encounters is Devil’s Tower, located in Wyoming.

Volcanic necks are somewhat rare because when a magma plug forms within a volcano, it often leads to an explosive eruption, like what happened with Krakatoa, or more recently with Mount St. Helens. The plug is broken up and ejected as ash and rock in a split second. But if the pressure isn’t great enough to actually detonate the top of the volcano, the plug cools and hardens deep within the Earth.

There are some very famous volcanic necks around the world. Probably the most famous is Devils Tower in Wyoming. It rises 386 meters above the surrounding landscape, a lone prominence of rusty red rock. I’ve actually stood beside it, and it’s one of the most impressive geologic features I’ve ever seen.

The type of erosion will define the shape of the volcanic neck. For example, glaciers will erode away one side of the volcanic neck, but leave a long tail behind.

We have written many articles about volcanoes for Universe Today. Here’s an article about the largest volcano in the Solar System, and here’s an article about the largest volcano on Earth.

You can also find out more information about volcanic necks from the USGS.

We have also recorded an episode of Astronomy Cast dealing with volcanoes on Earth and across the Solar System. Check out Episode 141 – Volcanoes, Hot and Cold.

Mantle Plume

Hotspot

[/caption]
One of the mysteries of Earth science is hotspots. While most volcanoes are found at plate boundaries, where two tectonic plates are rubbing against each other, volcanic hotspots can be anywhere, even in the middle of continents. What causes volcanic hotspots? One theory is the idea of a mantle plume.

A mantle plume is kind of like what’s going on inside a lava lamp. As the light heats up the wax in a lava lamp, it rises up through the oil in large blobs. These blobs reach the top of the lamp, cool and then sink back down to be heated up again.

Inside the Earth, the core of the Earth is very hot, and heats up the surrounding mantle. Heat convection in the mantle slowly transports heat from the core up to the Earth’s surface. These rising columns of heat can come up anywhere, and not just at the plate boundaries. Geologists did fluid dynamic experiments to try and simulate mantle plumes, and they found they formed long thin conduits topped by a bulbous head.

When the top of a mantle plume reaches the base of the Earth’s lithosphere, it flattens out and melts a large area of basalt magma. This whole region can form a continental flood basalt, which only lasts for a few million years. Or it can maintain a continuous stream of magma to a fixed location; this is a hotspot.

As the lithosphere continues to move through plate tectonics, the hotspot appears to be shifting its position over millions of years. But really the hotspot is remaining in a fixed location, and the Earth’s plates are shifting above it.

Two of the most famous places that might have mantle plumes underneath them are the Hawaiian Islands and Iceland.

We have written many articles about volcanoes and the interior of the Earth for Universe Today. Here’s an article about the difference between magma and lava, and here’s an article about magma chambers.

Here’s a great resource on mantle plumes, and here’s another.

We have recorded an entire episode of Astronomy Cast about volcanoes around the Solar System. Listen to it here: Episode 141: Volcanoes, Hot and Cold.

Atmosphere Layers

Atmosphere layers. Image credit: NASA

[/caption]
Seen from space, the Earth’s atmosphere is incredibly thin, like a slight haze around the planet. But the atmosphere has several different layers that scientists have identified; from the thick atmosphere that we breathe to the tenuous exosphere that extends out thousands of kilometers from the Earth. Let’s take a look at the different atmosphere layers.

Scientists have identified 5 distinct layers of the atmosphere, starting with the thickest near the surface, and then thinning out until it eventually merges with space.

The troposphere is the first layer above the surface of the Earth, and it contains 75% of the Earth’s atmosphere, and 99% of its water. Breathe in, that’s the troposphere. The average depth of the troposphere is about 17 km high. It gets deeper in the tropical regions, up to 20 km, and then shallower near the Earth’s poles – down to 7 km thick. Temperature and pressure are at the their highest at sea level, and then decrease with altitude. The troposphere is also where we experience weather.

The next atmosphere layer is the stratosphere, extending above the troposphere to an altitude of 51 km. Unlike the troposphere, temperature actually increases with height. Commercial airlines will typically fly in the stratosphere because it’s very stable; above weather, and allows them to optimize burning jet fuel. You might be surprised to know that bacterial life survives in the stratosphere.

Above that is the mesosphere, which starts at about 50-85 km above the Earth’s surface and extends up to an altitude of 80-90 km. Temperatures decrease the higher you go in the mesosphere, reaching a low of -100 °C, depending on the latitude and season.

Next comes the thermosphere. This region starts around 90 km above the Earth and goes up to about 320 and 380 km. The International Space Station orbits within the thermosphere. This is the region of the atmosphere where ultraviolet radiation causes ionization, and we can see auroras. Temperatures in the thermosphere can actually reach 2,500 °C; however, it wouldn’t feel warm because the atmosphere is so thin.

The 5th and final layer of the Earth’s atmosphere is the exosphere. This starts above the thermosphere and extends out for hundreds and even thousands of kilometers. Air molecules in this region can travel for hundreds of kilometers without bouncing into another particle.

We have written many articles about the Earth’s atmosphere for Universe Today. Here’s an article about the composition of the Earth’s atmosphere, and here’s information about the Earth’s early atmosphere.

Here’s a great article from NASA that explains the different layers of the atmosphere, and here’s more information from NOAA.

We have done a whole episode of Astronomy Cast just about Earth. Listen to it here, Episode 51 – Earth.