On August 19, 2022, solar astronomers using the Daniel K. Inouye Solar Telescope (DKIST) on the Hawaiian island of Maui caught the fading remnants of a C-class solar flare. Their observations showed something unusual: very strong spectral fingerprints of calcium II H and hydrogen-epsilon lines. It was the first time these two light signatures were seen in great detail during the decline of a solar flare. According to computer models, those lines were stronger than expected and play a not well-understood role in how flares heat the solar atmosphere where they occur. The same models can be used to study flares in other stars, as well.
Spectra are produced when the light from an object, in this case, the Sun, passes through a specialized instrument that breaks the light into its component wavelengths. The light can be emitted, absorbed, or reflected. Solar flares always provide interesting spectral lines, and this one was no different. In the case of the flare on August 19th, light was emitted by energized molecules of calcium II H and hydrogen-epsilon. These two are close together in the solar spectrum and provide a window into what's happening in the solar chromosphere. That's the complex layer of the solar atmosphere between the visible surface (photosphere) and corona (outer atmosphere). These absorption lines indicate ionized calcium in the atmosphere, and are clues to chromospheric activity and the strength of magnetic fields in the regions where they exist.
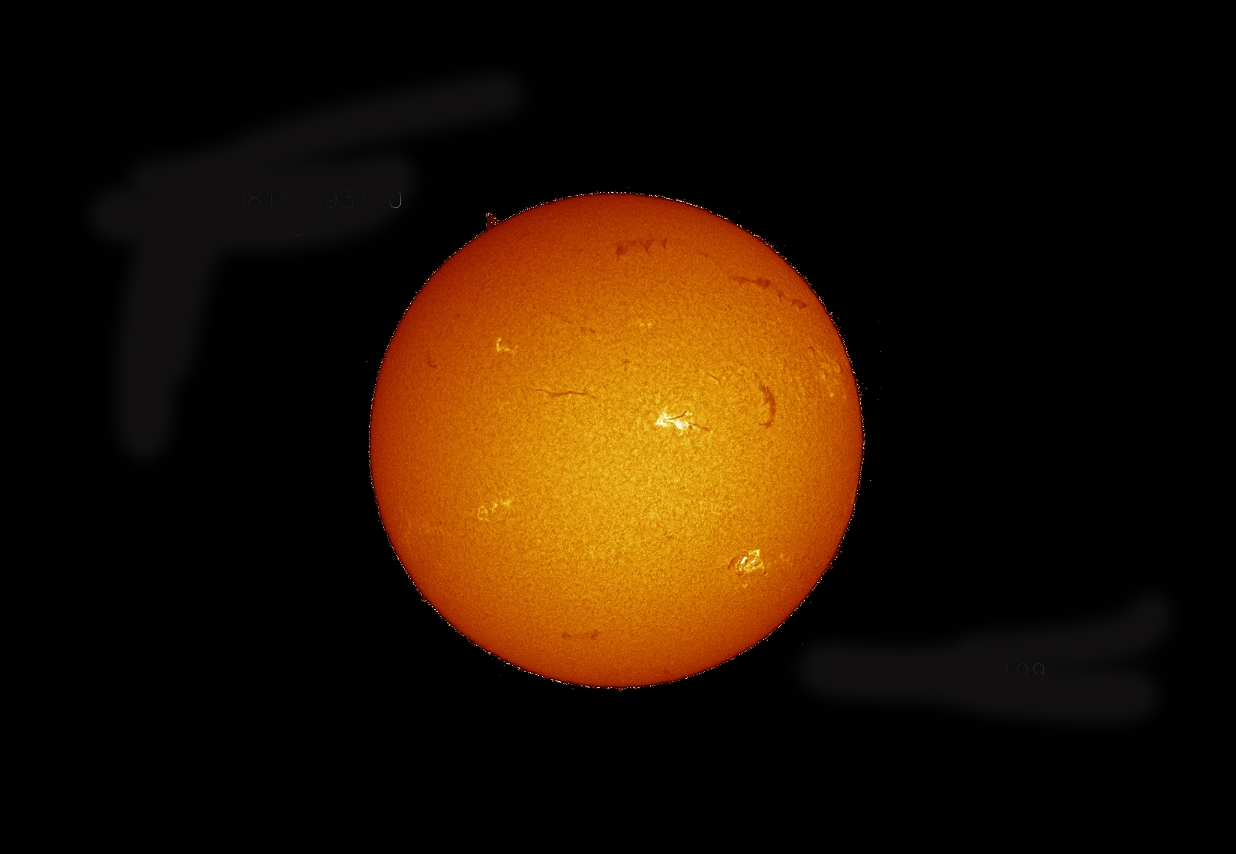
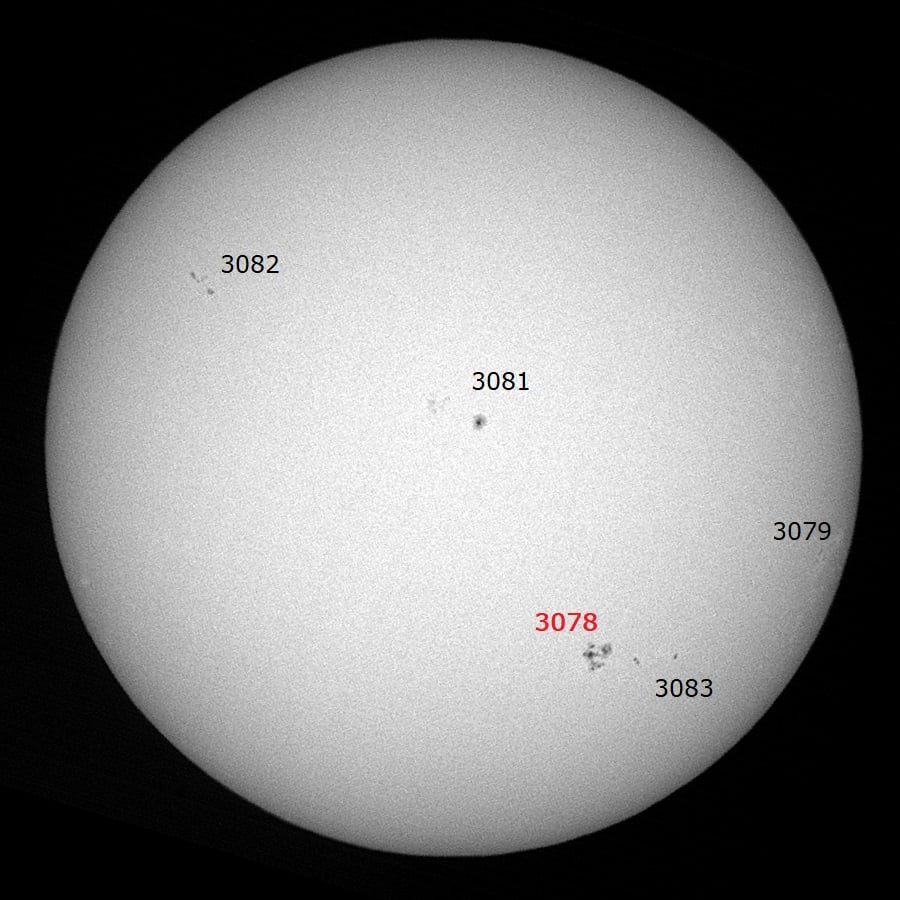 A visible image of the Sun on August 19, 2022, showing sunspots and their active regions, including 3078 where the DKIST observed unusual spectral lines. Courtesy CESAR Helios Observatory.
It hasn't always been easy to study these spectral lines in solar flares from Earth, usually due to constraints on telescope time and instrumentation. The DKIST was able to capture these thanks to its high-resolution capabilities. The lines in the August 2022 studies not only surprised the observers, but also revealed weaknesses in their models of solar physics. When the science team led by student observer Cole Tamburri compared the observations with current computer models that simulate how flares are heated, they found that their models could reproduce some features, but failed to fully explain others. The observed light signatures were broader and differed in brightness in ways the models can't yet explain, particularly as they showed up when the flare was declining. Apparently, there are more complex physics at work that computer simulations of the complex physics of a flare don't quite take into account. Data from these observations will be used to strengthen the models for future use.
How a Solar Flare Unfolds
To understand the surprise in the spectra during the flare's decline, let's take a look at how a solar flare works from start to finish. First, there's a precursor stage. That's when the local magnetic fields over an active region get entangled, like twisted rubber bands. This phase shows soft x-ray emissions. As the fields get more twisted, the flare progresses to the impulsive (explosive) stage. That's where the magnetic fields break and release strong amounts of stored energy in the form of high-energy protons and electrons are accelerated and speed away from the Sun. This stage also shows intense x-ray emissions, gamma rays, and radio waves. The flare brightens in response. Eventually, the flare begins to decline and this decay stage sees the flare's energy levels start to settle down and the region cools down. That's what the models tell scientists to expect. Current models suggest that the heating during a flare happens either by beams of high-energy particles or by heat spreading through the solar atmosphere.
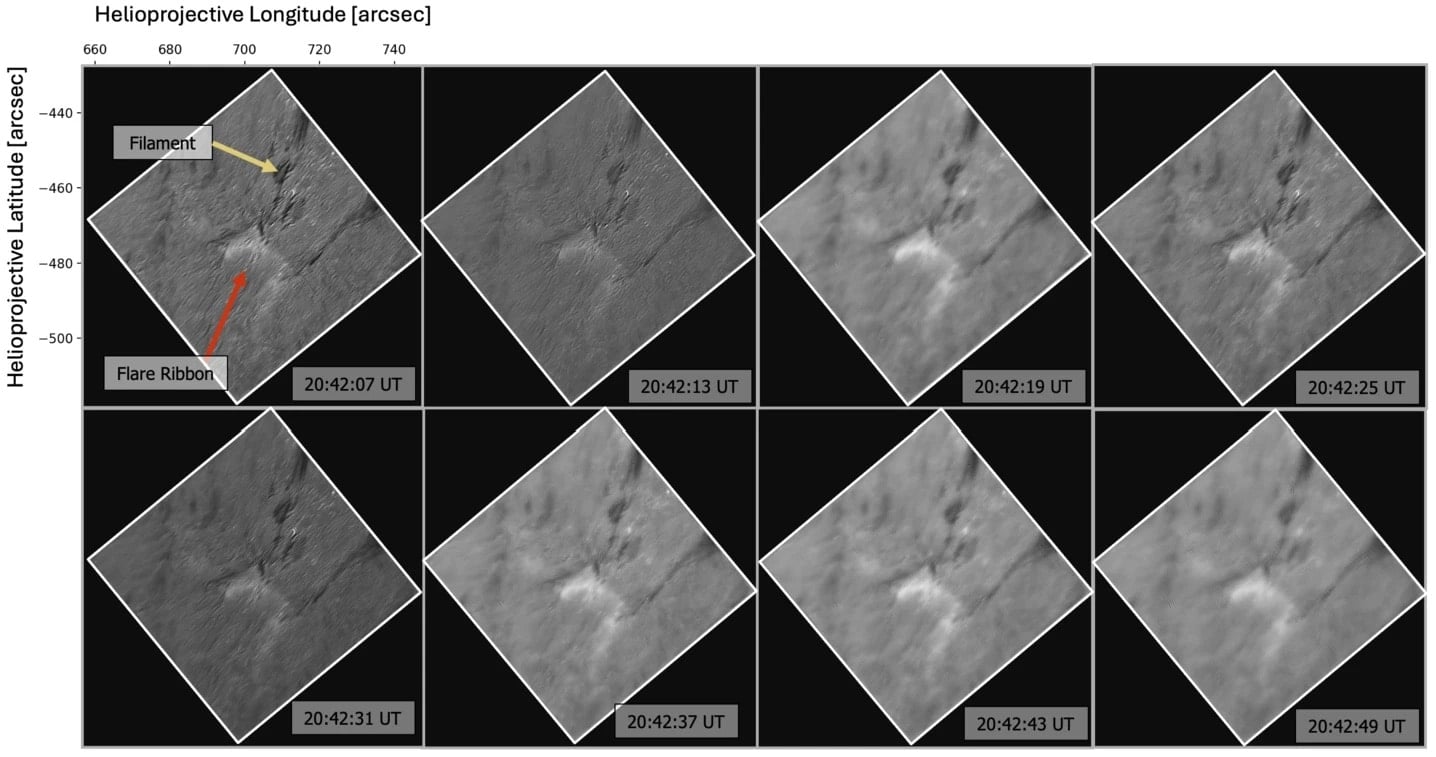 This sequences shows the evolution of a bright flare ribbon using the Visible Broadband Imager on the Daniel K. Inouye Solar Telescope. The flare occurred in active region 13078. Credit: Tamburri, et al.
The team originally had hoped to use DKIST to capture the precursor, "ramp-up" stage of this C6.7-class flare. Instead, they captured the end stage, when activity and emissions were declining. Their observations showed spectral lines for the calcium II H and hydrogen-epsilon emissions that didn't match what was expected for the declining stage of a flare. That told the scientists that the flare's emissions stayed stronger and more complex than they expected even as the flare cooled and decayed.
Reality vs. Models
The surprising observational data, made using the DKIST Visible Spectropolarimeter (ViSP) and the Visible Broadband Imager, gave the team a high-cadence, high-resolution set of spectra and provided simultaneous, high-resolution imaging needed to reveal the physical structure of the flare itself. "Both ground-based, high-resolution observing and state-of-the-art flare modeling are incredibly complex," said Tamburri, who noted that a large team of scientists was required to make observations and analyze the data. "The combined expertise from many NSO scientists in both regimes made this work possible. Collaboration of this type is essential to solving the remaining questions in flare physics using both modern observations and models."
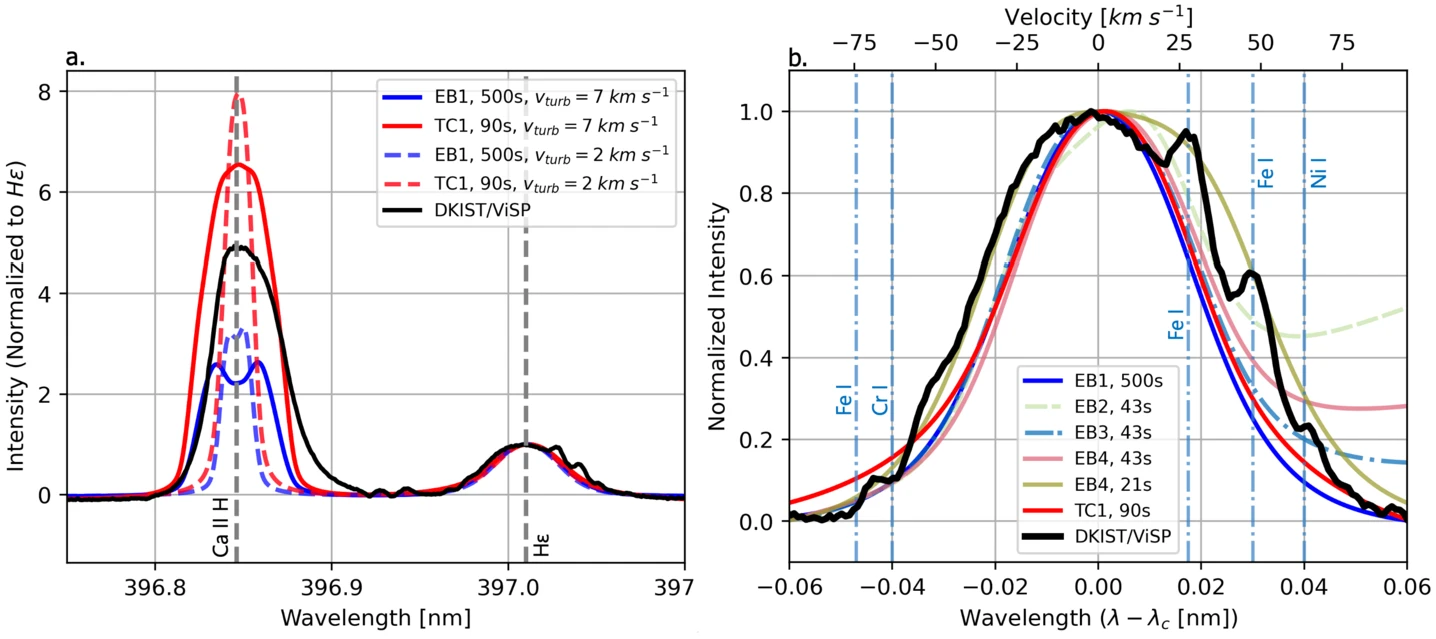 (a) A comparison of a RADYN+RH simulated Ca II H and H lines to observations made by the Daniel K. Inouye Solar Telescope.. (b) A comparison of ViSP observations to the modeled H profiles that are notably in emission in panel (a), using in the input RH atmosphere file. Note also the locations of several other lines within the spectral range of H, from Fe I, Fe I, and Ni I. The two Fe I lines in the red wing are deeper in the quiet Sun than the flare spectra, giving the impression of an emission line when the pre-flare is subtracted. Intensity values include pre-flare subtraction and are normalized to the maximum intensity of H in order to easily compare the widths of observed and modeled lines. The observed line profiles from ViSP at ribbon center at 20:42:07 UT are shown in black. This is a figure from a paper describing the observations (see references below). Courtesy Tamburri, et al.
Team members compared the emissions data they obtained from DKIST with current theoretical physics models for flares, using a computational model called RADYN. It simulates how the solar atmosphere gets heated by flare activity. It turned out that the data agreed with some parts of the models but not others. For example, the physical models actually agreed with the data regarding the shape and width of the hydrogen-epsilon line. However, the models didn't exactly match the calcium II H line shape. The light signatures were very different from what the models suggested. That leaves a big gap to explain how flares heat the solar atmosphere.
The NSO researchers behind the study say improving these models will require rethinking how flare heating works. More observations during solar flare events using DKIST should help strengthen the current models of solar atmospheric heating. In particular, they should be able to use detailed observations of the impulsive (explosive) and cooling phases to test new ideas about how flares behave through all the phases of their activity.