NASA and the NOAA just announced that 2019 was the second hottest year on record. It barely edged out 2016, the previous warmest year. And both 2019 and 2016 are part of the global warming trend: the last five years have been the warmest five years on record. And the last decade was the warmest decade.
Modern record-keeping of the Earth's temperature began in about 1880. There's some quasi-global data that began in 1850, when thermometers were being used methodically. But for climate scientists, the accepted reliable global data began in 1880. That's when global weather stations were considered widespread enough to collectively provide an accurate measurement of global temperatures.
"We crossed over into more than 2 degrees Fahrenheit warming territory in 2015 and we are unlikely to go back." GISS DIRECTOR GAVIN SCHMIDT
And according to all that data we're on a runaway train.
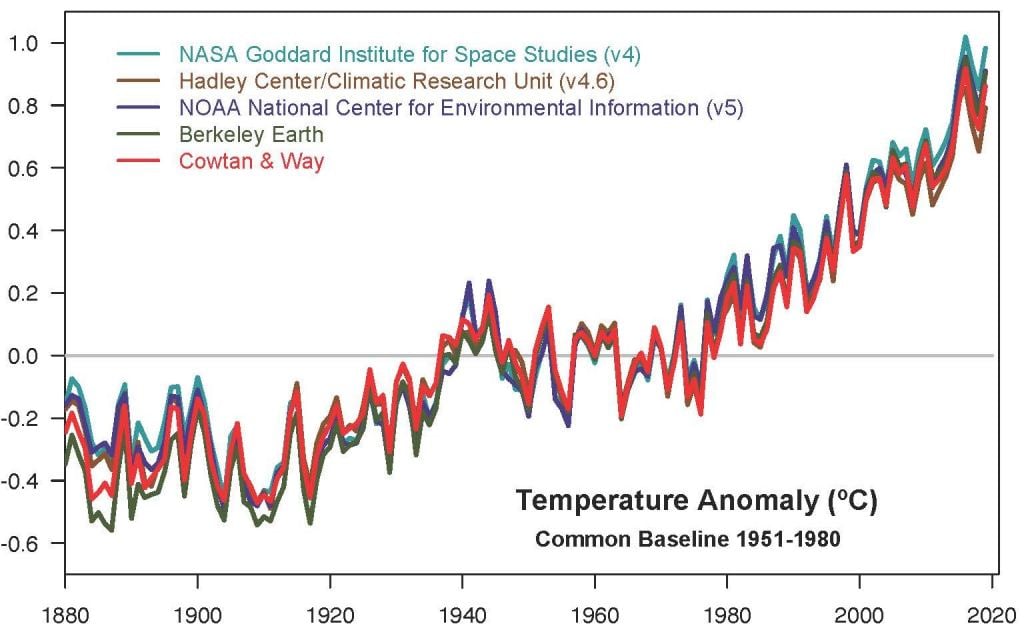
"The decade that just ended is clearly the warmest decade on record," said Goddard Institute for Space Studies Director Gavin Schmidt. "Every decade since the 1960s clearly has been warmer than the one before."
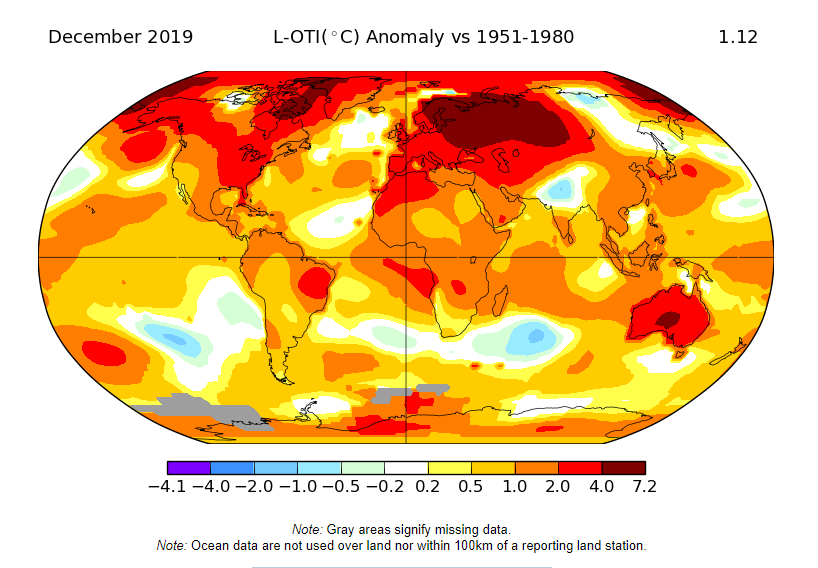
Scientists compare global temperatures to a mean temperature from 1951 to 1980. Compared to that mean, the global temperature was 0.98 degrees Celsius (1.8 Fahrenheit) higher.
"This shows that what’s happening is persistent, not a fluke due to some weather phenomenon." GISS Director Gavin Schmidt
Earth's average global surface temperature has risen more than 1 degree Celsius—or almost 2 degrees Fahrenheit—since the year 1880, when reliable global temperature data became available. In a press release, NASA compares that to the last Ice Age for context, which ended about 11,700 years ago. At that time, the temperature was about 10 degrees Fahrenheit cooler.
Humanity's CO2 emissions are driving the Earth's warming. Other greenhouse gases like methane are contributing, too, as are some natural processes. But the data is clear: we are driving the warming of the Earth and our emissions are still rising.
"We know that the long-term trends are being driven by the increasing levels of greenhouse gases in the atmosphere." GISS DIRECTOR GAVIN SCHMIDT
"We crossed over into more than 2 degrees Fahrenheit warming territory in 2015 and we are unlikely to go back. This shows that what's happening is persistent, not a fluke due to some weather phenomenon: we know that the long-term trends are being driven by the increasing levels of greenhouse gases in the atmosphere," Schmidt said.
Like any set of data, there are some uncertainties. But they're minor. The locations of the weather stations change over time, as does their measurement methods. But scientists are accustomed to measuring the uncertainty too, and in this case NASA says the global mean change in Earth's surface temperature is accurate to within 0.1 degree Fahrenheit.
The global mean surface temperature is an abstraction in some ways, because the temperature rise is not the same everywhere. In the contiguous 48 US states, the temperature was the 34th highest on record. But there's little comfort in that. The Arctic region is warming about three times faster than the rest of the world.

Even a small change in the numerical value of the Earth's global surface temperature has a massive effect on the planet. It contributes to the accelerated loss of ice in the Arctic region, to heat waves that now kill tens of thousands of people, to wildfires that devastate a region like in Australia, and even to extreme precipitation and flooding.
NASA and NOAA temperature data is detailed and rigorous. NASA gets their info from more than 20,000 weather stations, ships, buoys, and Antarctic research stations.
You can read about the nitty-gritty detail of surface temperature data analysis at GISS Surface Temperature Analysis (GISTEMP v4.) At that site you can query the data to create your own maps and graphs.