
Ah, for the days of Snowmageddon and Snowpocalypse back in 2010 and 2011. So far, 2012 is turning out to be a dud as far as getting a snow day or two off from work or school. Even though the Pacific Northwest in the US just got a major snowstorm, on the whole the US isn’t seeing much snowfall this winter. Why such a difference in just one year? In this ScienceCast, JPL climatologist Bill Patzert explains what’s going on.
NASA’s New Climate and Weather Satellite Launches
The National Polar-orbiting Operational Environmental Satellite System Preparatory Project, or NPP, launched successfully on a Delta 2 rocket early today at at 5:48 a.m. EDT 09:48 GMT (or precisely at 2:48:01.828 a.m. PDT, according to NASA’s Twitter feed). The next generation satellite will measure both global climate changes and key weather variables, as well as test new technologies for future Earth observing satellites.
The spacecraft has also successfully separated and is now in orbit. The separation video is below.
Continue reading “NASA’s New Climate and Weather Satellite Launches”
Next Generation Climate and Weather Satellite Ready for Friday Launch
A new satellite that will test key technologies and instruments for the next generation of climate and weather-monitoring satellites is scheduled to launch on Friday, Oct. 28, 2011. The NPOESS Preparatory Project (NPP) mission has a planned liftoff from Vandenberg Air Force Base in California at 5:48 a.m. EDT/2:48 a.m. PDT.
“This is the first mission designed to provide observations for both weather forecasters and climate researchers and will provide data that is critical to climate research,” said Jim Gleason, NPP project scientist during a news briefing last week.
Continue reading “Next Generation Climate and Weather Satellite Ready for Friday Launch”
New Research Finds Venus’ Winds, They Are A-Changin’
[/caption]
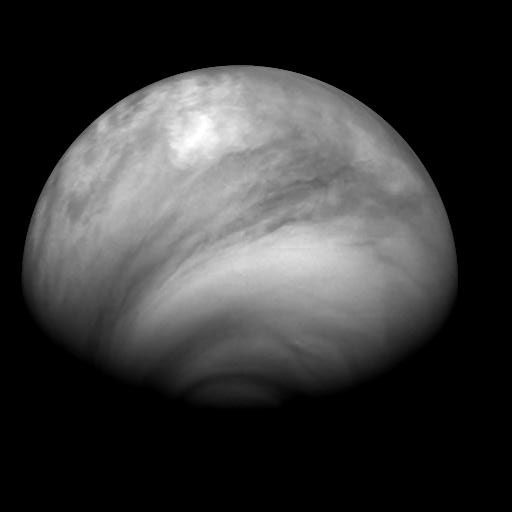
Venus, Earth’s hotheaded neighbor, may have more variability in its weather patterns than previously believed. Using infrared data obtained by ground-based telescopes in Hawaii and Arizona researchers have found that Venus’ mesosphere and thermosphere are less consistent in temperature than layers closer to its surface.
But first let’s talk about Venus itself.
Possibly the most inhospitable of planets in our solar system, Venus is the victim of a runaway greenhouse effect. Our neighboring world is a virtual oven… with a rocky surface baked by 800ºF temperatures and crushed beneath the weight of its own incredibly dense atmosphere, standing “sea level” on Venus would be like being 3,300 feet underwater, just in terms of pressure per square inch. And as if the heat and pressure weren’t enough, Venus’ skies are full of clouds made of corrosive sulphuric acid, lit by bolts of lightning and and whipped along by hurricane-force planetwide winds. All Earth-based probes that have ever landed there only lasted moments on the surface before succumbing to Venus’ destructive environment.
Venus is, quite literally, hellish.

Unlike Earth, Venus does not have much of an axial tilt. This means there’s little, if any, seasonal variation on Venus. (Actually it does have a tilt… Venus is rotated almost completely upside-down relative to its poles, and so in effect still has very little axial tilt.) And since its cloud cover is so dense and it lacks a hydrologic cycle to move heat energy around, it pretty much stays at a constant level of “extreme broil” all across Venus’ surface.
Surface weather on Venus, although unpleasant, is consistent.
Yet based on an international team’s new research this is not the case higher up in Venus’ atmosphere. A new look at old data has uncovered changing weather patterns visible in infrared light at about 68 miles (110 kilometers) above the planet’s surface in the cold, clear air above the acid clouds.
“Any variability in the weather on Venus is noteworthy, because the planet has so many features to keep atmospheric conditions the same,” said Dr. Tim Livengood, a researcher with the National Center for Earth and Space Science Education and the University of Maryland, now stationed at NASA’s Goddard Space Flight Center in Greenbelt.
Dr. Theodor Kostiuk of NASA Goddard explains further: “Although the air over the polar regions in these upper atmospheric layers on Venus was colder than the air over the equator in most measurements, occasionally it appeared to be warmer. In Earth’s atmosphere, a circulation pattern called a ‘Hadley cell’ occurs when warm air rises over the equator and flows toward the poles, where it cools and sinks. Since the atmosphere is denser closer to the surface, the descending air gets compressed and warms the upper atmosphere over Earth’s poles. We saw the opposite on Venus.”
Many factors could be contributing to Venus’ upper-atmospheric variabilities, such as interactions between opposing winds blowing around the planet at over 200 mph, giant vortexes that churn around its poles, and possibly even solar activity, like solar storms and coronal mass ejections which may create turbulence in Venus’ upper atmosphere.
“The mesosphere and thermosphere of Venus are dynamically active. Wind patterns resulting from solar heating and east to west zonal winds compete, possibly resulting in altered local temperatures and their variability over time.”
– Lead author Dr. Guido Sonnabend, University of Cologne, Germany

The team also found that the temperatures of Venus’ atmosphere change over time, spanning weeks, months, years… even decades. Temperatures measured in 1990-91 are warmer than in 2009, and equatorial temperatures were even warmer in 2007.
“In addition to all these changes, we saw warmer temperatures than those predicted for this altitude by the leading accepted model,” said Kostiuk. “This tells us that we have lots of work to do updating our upper atmospheric circulation model for Venus.”
Even though Venus is compositionally similar to Earth and has a similar size as well, at some point in its history it lost all of its water to space and became the cloud-covered oven it is today. Studying Venus will help scientists learn how this may have happened and – hopefully! – learn how to prevent the same fate from ever befalling Earth.
The paper, led by Dr. Guido Sonnabend of the University of Cologne, Germany and co-authored by Drs. Livengood and Kostiuk, appeared July 23 in the online edition of the journal Icarus.
Read more on the NASA feature article here.
Astronomy Cast Ep. 226: Weather

How’s the weather? Maybe a better question is… why’s the weather? What is it about planets and their atmospheres that create weather systems. What have planetary scientists learned about our Earth’s weather, and how does this relate to other planets in the Solar System. What is the most extreme weather we know of?
Click here to download the episode.
Or subscribe to: astronomycast.com/podcast.xml with your podcatching software.
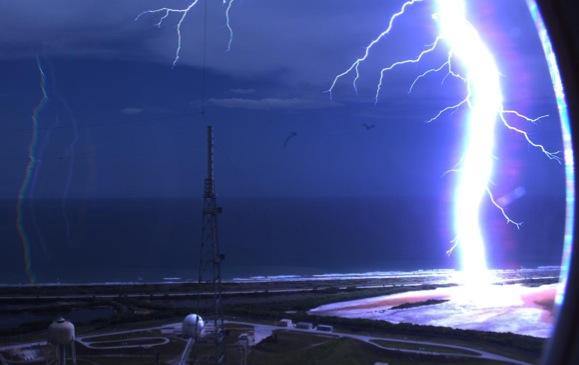
Yikes! Lightning Strike Near KSC Launchpad
[/caption]
That was close! A fixed camera at launchpad B at Kennedy Space Center (which is being torn down/modified) captured an amazing lightning strike earlier this week.
Hat tip to @InsideKSC on Twitter
What is a Warm Front?
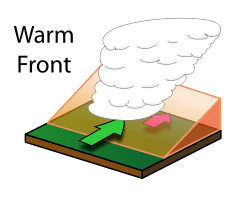
[/caption]A warm front is the transition zone that marks where a warm air mass starts replacing a cold air mass. Warm fronts tend to move from southwest to southeast. Normally the air behind a warm front is warmer than the air in front of it. Normally when a warm front passes through an area the air will get warmer and more humid. Warm fronts signal significant changes in the weather. Here are some of the weather signs that appear as a warm front passes over a region.
First before the warm front arrives the pressure in area start to steadily decrease and temperatures remain cool. The winds tend to blow south to southeast in the northern hemisphere and north to northeast in the southern hemisphere. The precipitation is normally rain, sleet, or snow. Common cloud types that appear would various types of stratus, cumulus, and nimbus clouds. The dew point also rises steadily
While the front is passing through a region temperatures start to warm rapidly. The atmospheric pressure in the area that was dropping starts to level off. The winds become variable and precipitation turns into a light drizzle. Clouds are mostly stratus type clouds formations. The dew point then starts to level off.
After the warm front passes conditions completely reverse. The atmospheric pressure rises slightly before falling. The temperatures are warmer then they level off. The winds in the northern hemisphere blow south-southwest in the northern hemisphere and north-northwest in the southern hemisphere. Cloudy conditions start to clear with only cumulonimbus and stratus clouds. The dew point rises then levels off.
Knowing about how warm fronts work gives a better understanding of how pressure systems interact with geography to create weather. Looking at warm fronts we learn that they are the transition zone between warm humid air masses and cool, dry air masses. We know that these masses interact in a cycle of rising and falling air that alters the pressure of atmosphere causing changes in weather.
We have written many articles about warm front for Universe Today. Here’s an article about cyclones, and here’s an article about cloud formations.
If you’d like more info on warm front, check out NOAA National Weather Service. And here’s a link to NASA’s Earth Observatory.
We’ve also recorded an episode of Astronomy Cast all about planet Earth. Listen here, Episode 51: Earth.
Reference:
http://ww2010.atmos.uiuc.edu/(Gh)/guides/mtr/af/frnts/wfrnt/def.rxml
How Does Fog Form?

Fog is a natural weather conditions that can cause visibility to become zero. It can cause accidents on normally safe roads and is such a serious weather condition that schools delay the start of the day until the sun burns it off. So how does fog form? First it is important to understand that fog is basically a cloud on the ground. This means like clouds it is a collection of tiny water droplets formed when evaporated water is cooled. The way it is cooled determines how fog is formed.
The first way that fog is formed is by infrared cooling. Infrared cooling happens due to the change of seasons from summer to fall and winter. During the summer the ground absorbs solar radiation. As air passes over it is made warm and moist. When the seasons change this mass of warm moist air collides with the cooler that is now prevalent. This cause is the water vapor in the air mass to condense quickly and fog is formed. This fog is often called radiation fog due to the way it forms. This kind is the most common type of fog. It also happens when an unseasonable day of warm weather combined with high humidity is followed by dropping temperatures
The next way that fog forms is through advection. Advection is wind driven fog formation. In this case warm air is pushed by winds across a cool surface where it condenses into fog. There are also other kinds of fog like hail fog or freezing fog. Each of these conditions is where condensed water droplets are cooled to the point of freezing. There is also fog formed over bodies of water. One type is sea smoke. This is a type of fog that forms when cool air passes over a warm body of water or moist land.
In general we see that fog is formed whenever there is a temperature difference between the ground and the air. When the humidity is high enough and there is enough water vapor or moisture fog is sure to form. However the kind of fog and how long is last and its effects will depends on the different conditions mentioned. One interesting kind of fog actually helps to make snow melt faster.
We have written many related articles for Universe Today. Here’s an article about stratus clouds, and here’s an article about acid rain.
If you’d like more info on fog, check out NOAA National Weather Service website. And here’s a link to NASA’s Earth Observatory.
We’ve also recorded an episode of Astronomy Cast all about planet Earth. Listen here, Episode 51: Earth.
Reference:
http://www.crh.noaa.gov/jkl/?n=fog_types
Where do Hurricanes Occur?
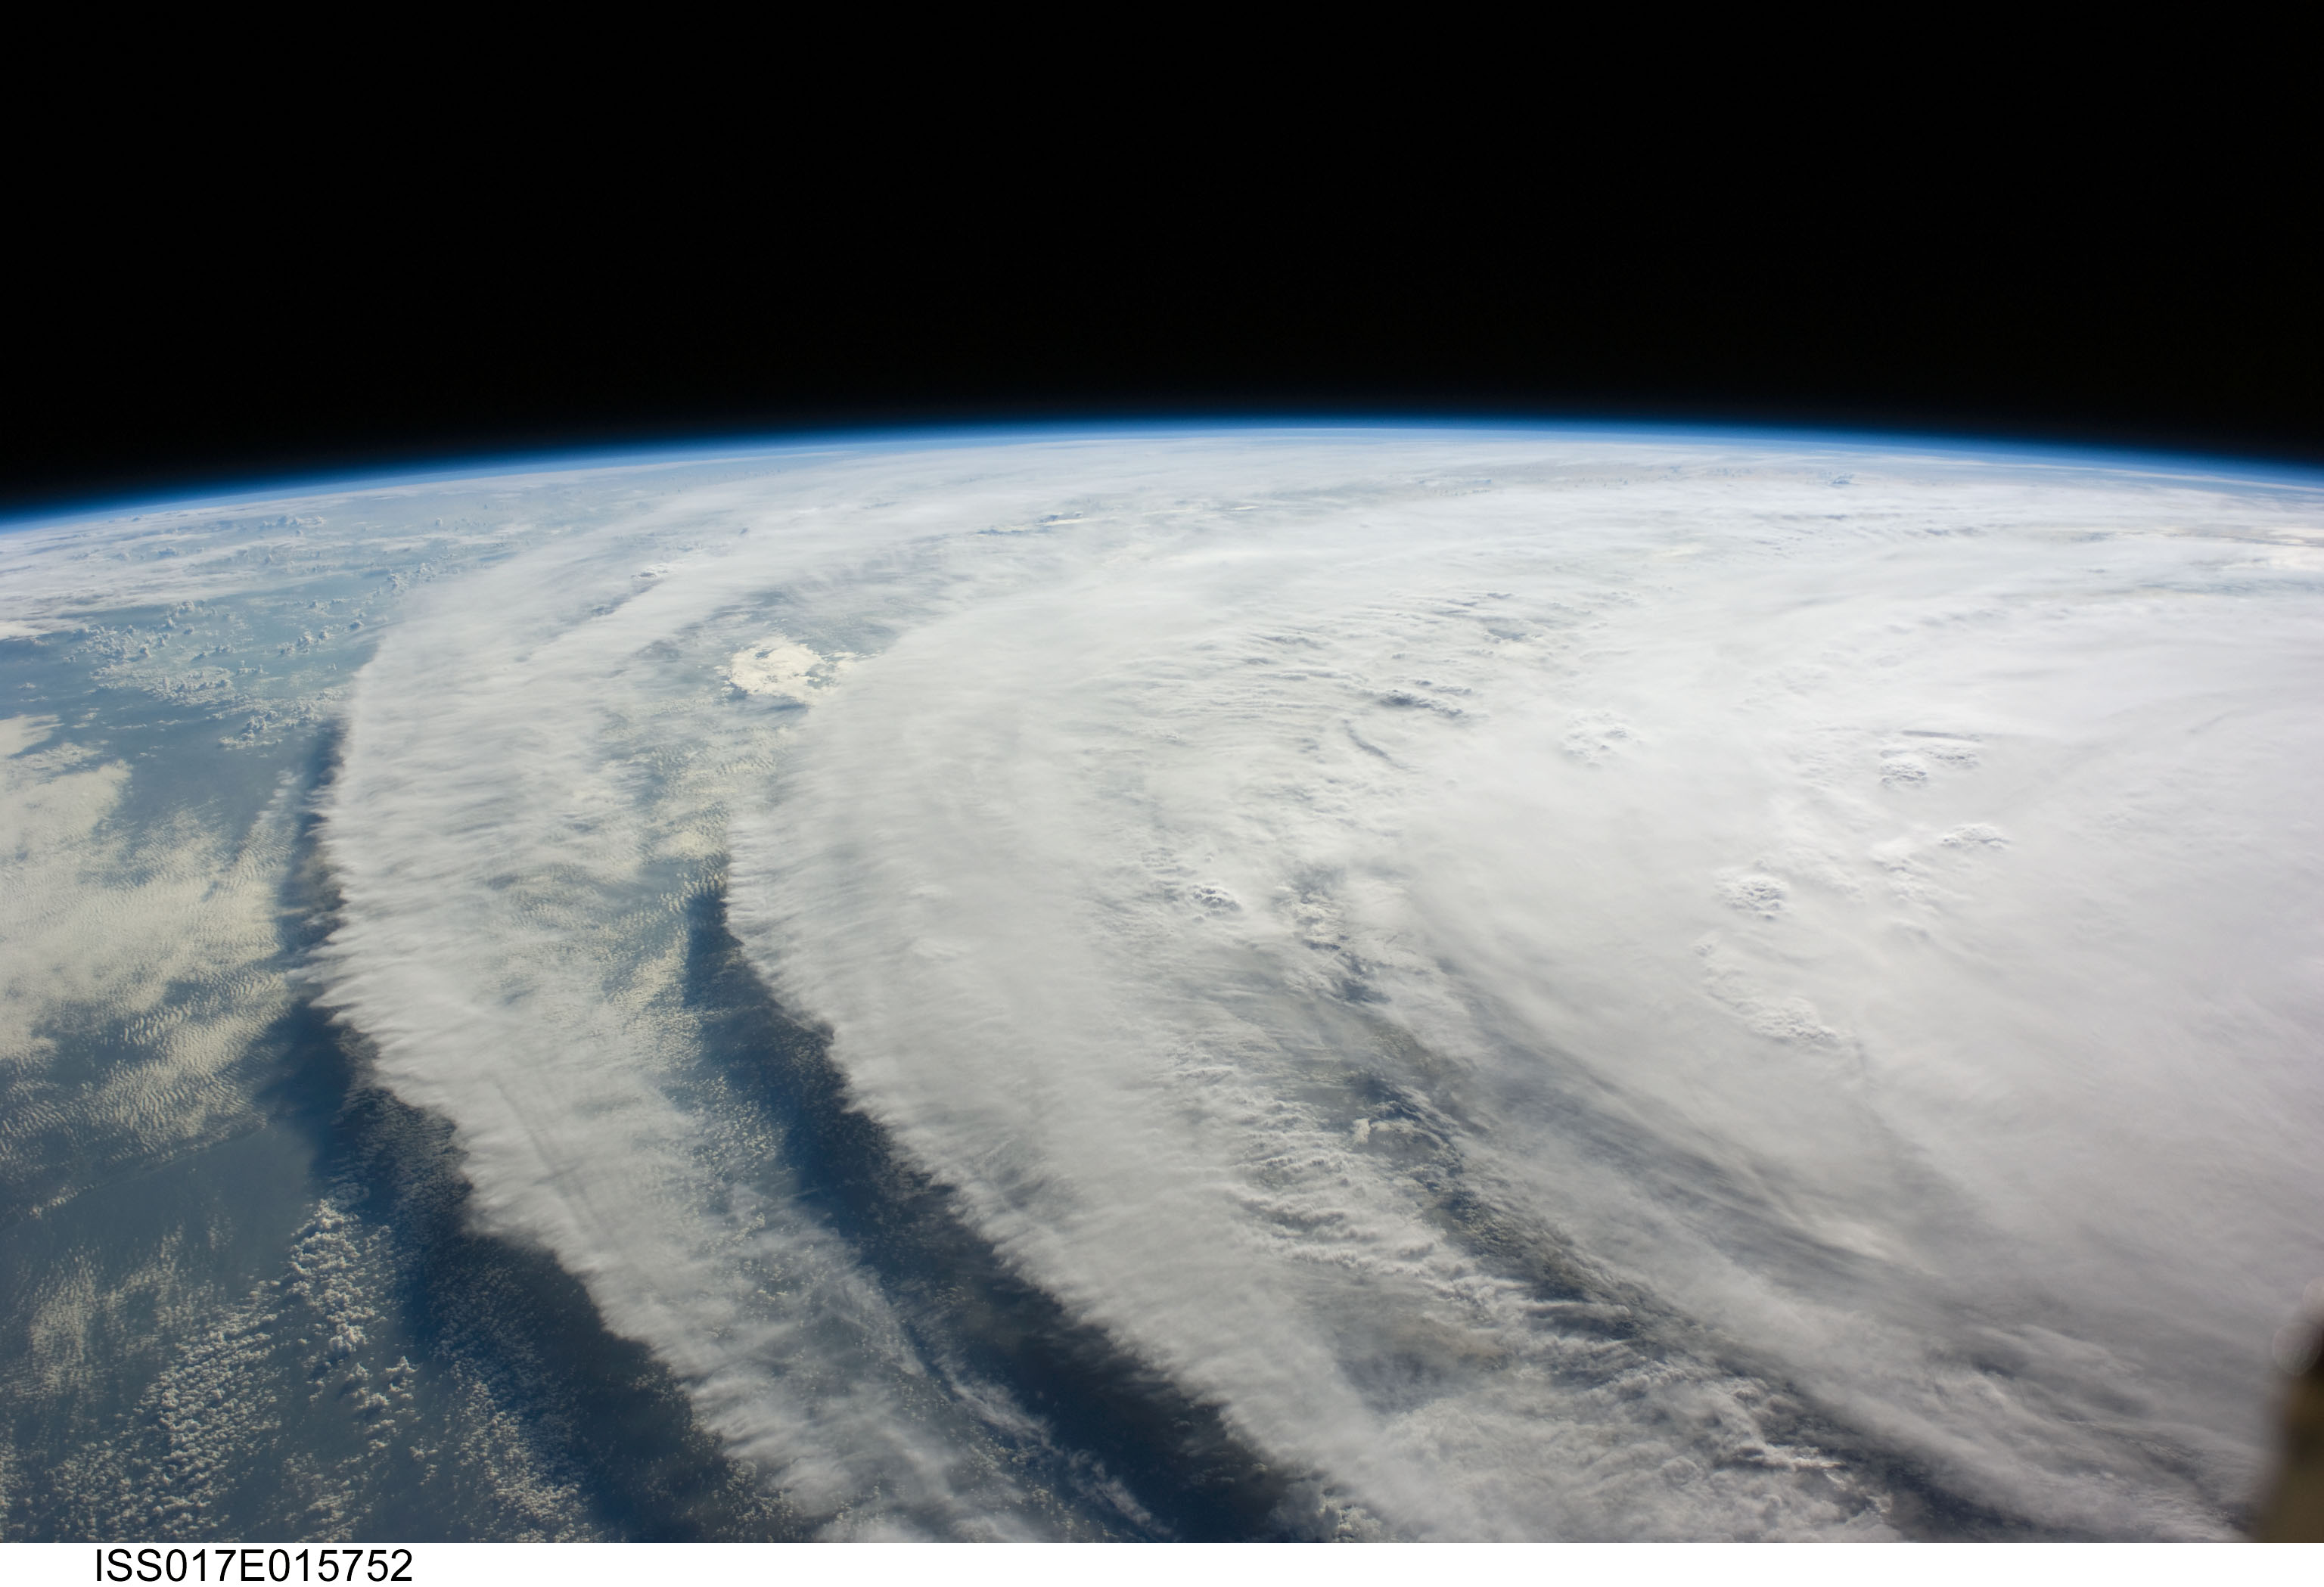
What is a hurricane? Well, a hurricane is a tropical cyclone that occurs in the North Atlantic Ocean or the Northeast Pacific Ocean and remains east of the International Dateline. Tropical cyclones are characterized by a large low pressure center and numerous thunderstorms. These produce strong winds and heavy rain. These cyclones feed on heat released when moist air rises causing condensation of the water vapor that is contained in the moist air. These storms are fueled by a different heat mechanism than other cyclonic windstorms(nor’easters, polar lows, and European windstorms). They are classified as a warm core storm system.
All tropical cyclones are areas of low atmospheric pressure. As a matter of fact, the pressures recorded at the center of tropical cyclones are among the lowest that occur at sea level. A hurricane is characterized and driven by the release of large amounts of latent heat of condensation(water vapor condenses as it moves upward). This heat is distributed vertically around the center of the storm, so, except at the surface of water, it is warmer inside the cyclone than it is outside. At the center of the hurricane is an area of sinking air. If this area is strong enough, it can develop into a large eye. Weather in the eye is normally calm and free of clouds, but the surface of the sea may be tossing violently. The eye is normally circular in shape, and may range in size from 3 km to 370 km in diameter.
While a tropical cyclone’s primary energy source is the release of the heat of condensation, solar heating is the initial source of that evaporation. An initial warm core system(an organized thunderstorm complex) is necessary for the formation of a tropical cyclone, but a large flux of energy is needed to lower atmospheric pressure. The influx of warmth and moisture from the underlying ocean surface is critical for tropical cyclone strengthening and most of it comes from the lower 1 km of the atmosphere. Condensation leads to higher wind speeds. These faster winds and the lower pressure associated with them cause an increase in surface evaporation and more condensation. This positive feedback system continues and feeds the hurricane until the conditions for hurricane formation are gone. The rotation of Earth causes the system to spin,(the Coriolis effect) which gives it a cyclonic appearance and affects its trajectory.
Tropical cyclones are distinguished by the deep convection that fuels them. Since convection is strongest in the tropics it defines the initial domain of the tropical cyclone. To continue to feed itself a tropical cyclone must remain over warm water. When a tropical cyclone passes over land, it is cut off from its heat source and its strength diminishes rapidly. The passage of a tropical cyclone over the ocean can cause the upper layers of the ocean to cool substantially, which can influence subsequent cyclone development. Scientists at the National Center for Atmospheric Research in the US estimate that a tropical cyclone releases heat energy equal to 70 times the world energy consumption, 200 times the worldwide electrical generating capacity, or the same as exploding a 10 megaton nuclear bomb every 20 minutes.
Well, there you have the answer to what is a hurricane. It is a tropical nightmare, but if humans could somehow harness that energy we would never need fossil fuels again.
We have written many articles about hurricanes for Universe Today. Here’s an article about human influences generating more hurricanes, and here’s a NASA video of Hurricane Bill.
If you’d like more info on hurricanes, check out Visible Earth Homepage. And here’s a link to NASA’s Earth Observatory.
We’ve also recorded an episode of Astronomy Cast all about planet Earth. Listen here, Episode 51: Earth.
What Are Tornadoes?

Also known as a twister, a tornado is a rotating column of air that can cause a tremendous amount of damage on the ground. Tornadoes can very in size from harmless dust devils to devastating twisters with wind speeds greater than 450 km/h.
A tornado looks like a swirling funnel of cloud that stretches from bottom of the clouds down to the ground. Depending on the power of the tornado, there might be a swirling cloud of debris down at the ground, where it’s tearing stuff up. Some tornadoes can look like thin white ropes that stretch from the sky down to the ground, and only destroy a thin patch of ground. Others can be very wide, as much as 4 km across, and leave a trail of destruction for hundreds of kilometers.
Tornadoes appear out of special thunderstorms known as supercells. They contain a region of organized rotation in the atmosphere a few kilometers across. Rainfall within the storm can drag down an area of this rotating atmosphere, to bring it closer to the ground. As it approaches the ground, conservation of momentum causes the wind speed to increase until it’s rotating quickly – this is when tornadoes cause the most damage. After a while the tornado’s source of warm air is choked off, and it dissipates.
When a tornado forms over water, it’s called a waterspout. These can be quite common in the Florida Keys and the northern Adriatic Sea. Most are harmless, like dust devils, but powerful waterspouts can be driven by thunderstorms and be quite dangerous.
Scientists have several scales for measuring the strength and speed of tornadoes. The most well known is the Fujita scale, which ranks tornadoes by the amount of damage they do. A F0 tornado damages trees, but that’s about it, while the most powerful F5 tornado can tear buildings off their foundations. Another scale is known as the TORRO scale, which ranges from T0 to T11. In the United States, 80% of tornadoes are F0, and only 1% are the more violent F4 or F5 twisters.
Although they can form anywhere in the world, tornadoes are mostly found in North America, in a region called Tornado Alley. The United States has the most tornadoes of any country in the world; 4 times as many as the entire continent of Europe. The country gets about 1,200 tornadoes a year.
We have written many articles about the tornado for Universe Today. Here’s an article about the biggest tornado, and here’s an article about how tornadoes are formed.
If you’d like more info on tornadoes, check out the National Oceanic & Atmospheric Administration (NOAA) Homepage. And here’s a link to NASA’s Earth Observatory.
We’ve also recorded an episode of Astronomy Cast all about planet Earth. Listen here, Episode 51: Earth.