How Far Away is Fusion? Unlocking the Power of the Sun

Best Energy?
Best Energy?


I’d like to think we’re smarter than the Sun.

Let’s compare and contrast. Humans, on the one hand, have made enormous advances in science and technology, built cities, cars, computers, and phones. We have split the atom for war and for energy.

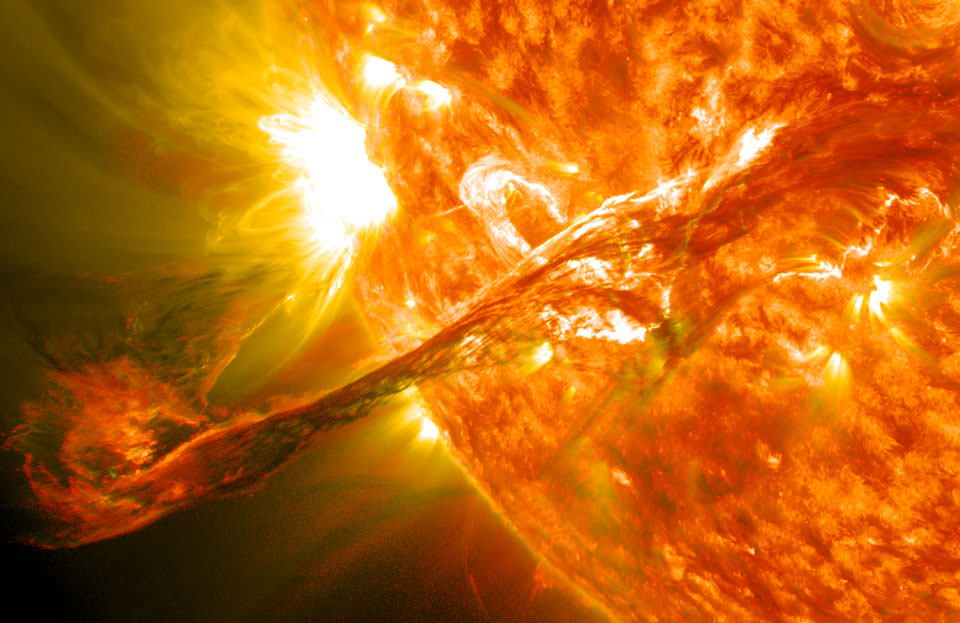
What has the Sun done? It’s a massive ball of plasma, made up of mostly hydrogen and helium. It just, kind of, sits there. Every now and then it burps up hydrogen gas into a coronal mass ejection. It’s not a stretch to say that the Sun, and all inanimate material in the Universe, isn’t the sharpest knife in the drawer.

And yet, the Sun has mastered a form of energy that we just can’t seem to wrap our minds around: fusion. It’s really infuriating, seeing the Sun, just sitting there, effortlessly doing something our finest minds have struggled with for half a century.

Why can’t we make fusion work? How long until we can finally catch up technologically with a sphere of ionized gas?

Our Sun in all its intense, energetic glory. When life appeared on Earth, the Sun would have been much different than it is now; a more intense, energetic neighbor. Image: NASA/SDO.
Our Sun in all its intense, energetic glory. Credit: NASA/SDO.

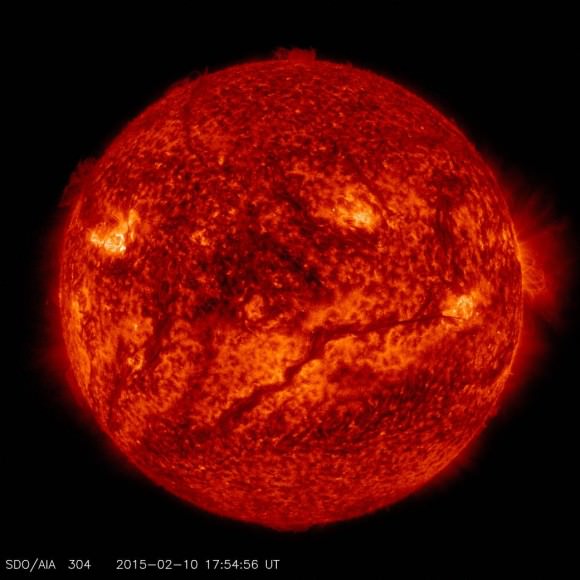
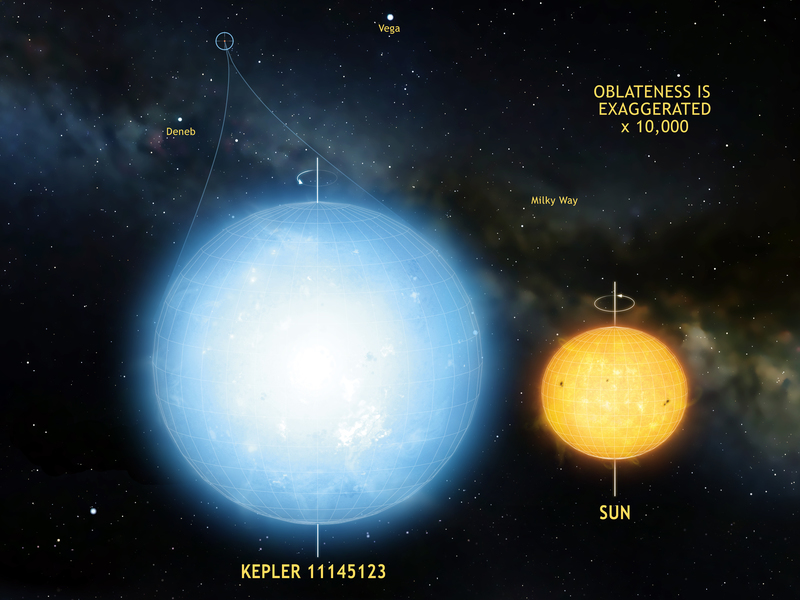
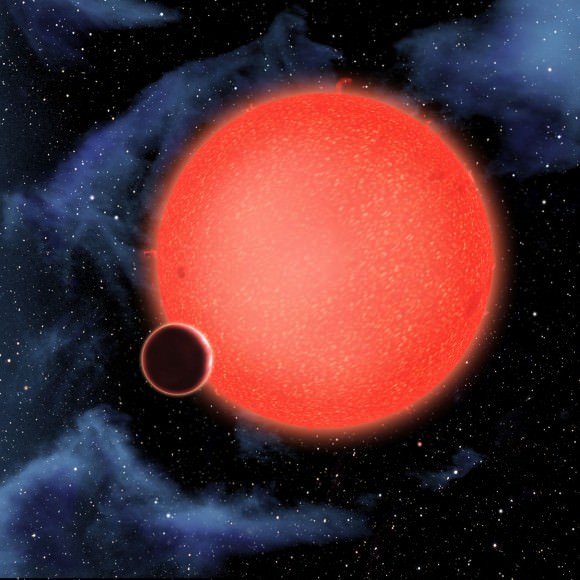
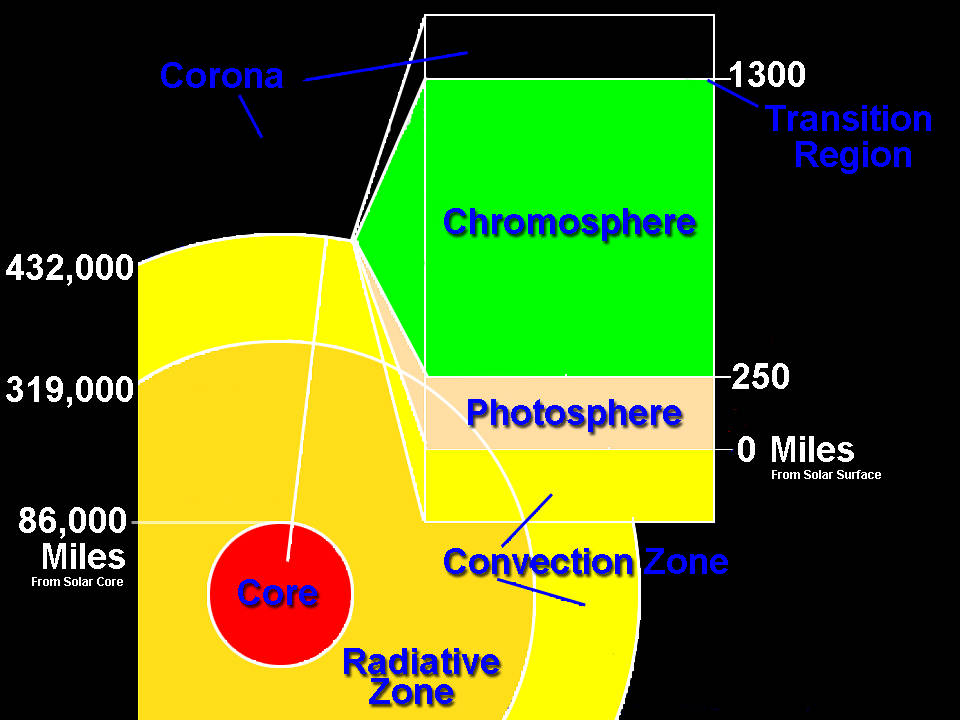
The trick to the Sun’s ability to generate power through nuclear fusion, of course, comes from its enormous mass. The Sun contains 1.989 x 10^30 kilograms of mostly hydrogen and helium, and this mass pushes inward, creating a core heated to 15 million degrees C, with 150 times the density of water.

It’s at this core that the Sun does its work, mashing atoms of hydrogen into helium. This process of fusion is an exothermic reaction, which means that every time a new atom of helium is created, photons in the form of gamma radiation are also released.

The only thing the Sun uses this energy for is light pressure, to counteract the gravity pulling everything inward. Its photons slowly make their way up through the Sun and then they’re released into space. So wasteful.

How can we replicate this on Earth?

Now gathering together a Sun’s mass of hydrogen here on Earth is one option, but it’s really impractical. Where would we put all that hydrogen. The better solution will be to use our technology to simulate the conditions at the core of the Sun.

If we can make a fusion reactor where the temperatures and pressures are high enough for atoms of hydrogen to merge into helium, we can harness those sweet sweet photons of gamma radiation.

Tokamak
Inside a Tokamak. Credit: Princeton Plasma Physics Laboratory

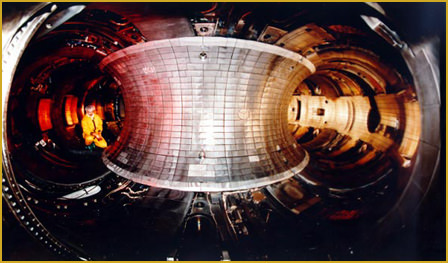
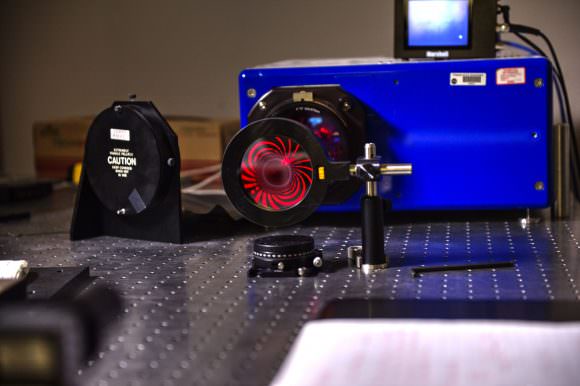
The main technology developed to do this is called a tokamak reactor; it’s a based on a Russian acronym for: “toroidal chamber with magnetic coils”, and the first prototypes were created in the 1960s. There are many different reactors in development, but the method is essentially the same.

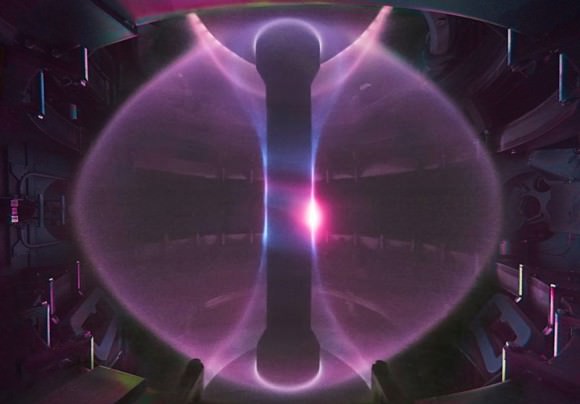
A vacuum chamber is filled with hydrogen fuel. Then an enormous amount of electricity is run through the chamber, heating up the hydrogen into a plasma state. They might also use lasers and other methods to get the plasma up to 150 to 300 million degrees Celsius (10 to 20 times hotter than the Sun’s core).

Superconducting magnets surround the fusion chamber, containing the plasma and keeping it away from the chamber walls, which would melt otherwise.

Once the temperatures and pressures are high enough, atoms of hydrogen are crushed together into helium just like in the Sun. This releases photons which heat up the plasma, keeping the reaction going without any addition energy input.

Excess heat reaches the chamber walls, and can be extracted to do work.

The spherical tokamak MAST at the Culham Centre for Fusion Energy (UK). Photo: CCFE

The challenge has always been that heating up the chamber and constraining the plasma uses up more energy than gets produced in the reactor. We can make fusion work, we just haven’t been able to extract surplus energy from the system… yet.

Compared to other forms of energy production, fusion should be clean and safe. The fuel source is water, and the byproduct is helium (which the world is actually starting to run out of). If there’s a problem with the reactor, it would cool down and the fusion reaction would stop.

The high energy photons released in the fusion reaction will be a problem, however. They’ll stream into the surrounding fusion reactor and make the whole thing radioactive. The fusion chamber will be deadly for about 50 years, but its rapid half-life will make it as radioactive as coal ash after 500 years.

External view of Princeton’s Tokamak Fusion Test Reactor which operated from 1982 to 1997. Credit: Princeton Plasma Physics Laboratory (CC BY 3.0)

Now you know what fusion power is and how it works, what’s the current state, and how long until fusion plants give us unlimited cheap safe power, if ever?

Fusion experiments are measured by the amount of energy they produce compared to the amount of energy you put into them. For example, if a fusion plant required 100MW of electrical energy to produce 10 MW of output, it would have an energy ratio of 0.1. You want at least a ratio of 1. That means energy in equals energy out, and so far, no experiment has ever reached that ratio. But we’re close.

The EAST facility’s tokamak reactor, part of the Institute of Physical Science in Hefei. Credit: ipp.cas.cn

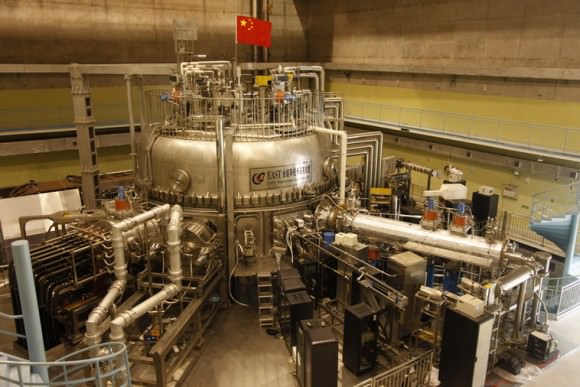
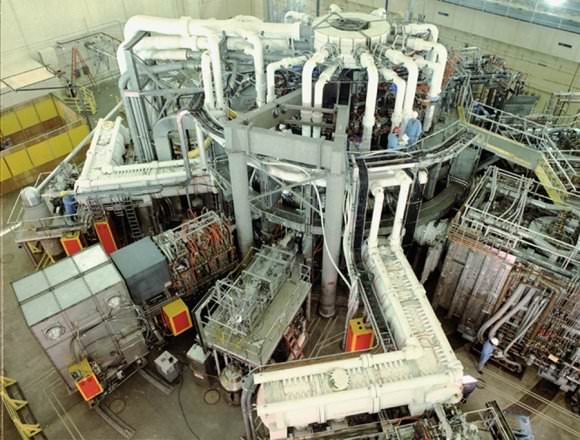
The Chinese are building the Experimental Advanced Superconducting Tokamak, or EAST. In 2016, engineers reported that they had run the facility for 102 seconds, achieving temperatures of 50 million C. If true, this is an enormous advancement, and puts China ahead in the race to create stable fusion. That said, this hasn’t been independently verified, and they only published a single scientific paper on the milestone.

Karlsruhe Institute of Technology’s Wendelstein 7-X (W7X) stellarator. Credit: Max-Planck-Institut für Plasmaphysik, Tino Schulz (CC BY-SA 3.0)

Researchers at the Karlsruhe Institute of Technology (KIT) in Germany recently announced that their Wendelstein 7-X (W7X) stellarator (I love that name), heated hydrogen gas to 80 million C for only a quarter of a second. Hot but short. A stellarator works differently than a tokamak. It uses twisted rings and external magnets to confine the plasma, so it’s good to know we have more options.

The biggest, most elaborate fusion experiment going on in the world right now is in Europe, at the French research center of Cadarache. It’s called ITER, which stands for the International Thermonuclear Experimental Reactor, and it hopes to cross that magic ratio.

The ITER Tokamak Fusion Reactor. Credits: ITER, Illus. T.Reyes

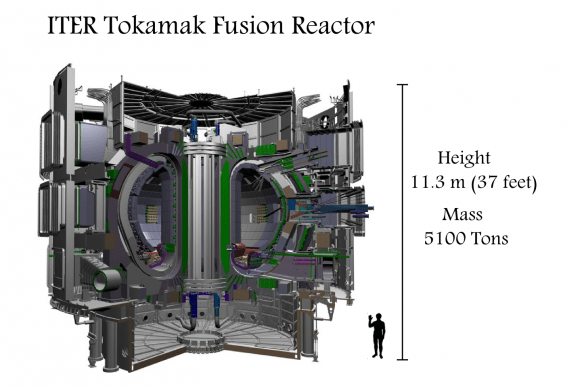
ITER is enormous, measuring 30 meters across and high. And its fusion chamber is so large that it should be able to create a self-sustaining fusion reaction. The energy released by the fusing hydrogen keeps the fuel hot enough to keep reacting. There will still be energy required to run the electric magnets that contain the plasma, but not to keep the plasma hot.

And if all goes well, ITER will have a ratio of 10. In other words, for every 10 MW of energy pumped in, it’ll generate 100 MW of usable power.

ITER is still under construction, and as of June 2015, the total construction costs had reached $14 billion. The facility is expected to be complete by 2021, and the first fusion tests will begin in 2025.

So, if ITER works as planned, we are now about 8 years away from positive energy output from fusion. Of course, ITER will just be an experiment, not an actual powerplant, so if it even works, an actual fusion-based energy grid will be decades after that.

At this point, I’d say we’re about a decade away from someone demonstrating that a self-sustaining fusion reaction that generates more power than it consumes is feasible. And then probably another 2 decades away from them supplying electricity to the power grid. By that point, our smug Sun will need to find a new job.

What Constellation is the Sun in?

The constellations, distant stars that appear close in the night sky, have been organized for millennia based on the shapes they appear to form. Credits: NASA

Since ancient times, astronomers have organized the stars into various constellations. We have the Big Dipper (Ursa Major), Orion the Hunter, and his “Greater Dog” and “Lesser Dog”(Canis Major and Canis Minor). And those are just some of the better-known ones. But have you ever wondered if the Sun belongs to one of these collections of stars?

The simple answer is that – in accordance with both ancient astrological tradition and modern astronomy – the Sun technically has no constellation. But if you were to change locations and travel to a new star system, you would then be able to view the Sun as we do other distant collection of stars. Unfortunately, depending on where you are, the answer would change.

The Zodiac:

First, let us consider the astrological answer to this question. Unless you were born prior to the Scientific Revolution – during which time Nicolaus Copernicus proposed the heliocentric model of the Solar System – you know that the Earth revolves around the Sun. Over the course of a year, the position of the stars changes as the Earth’s position relative to the Sun changes.

A chart of the constellations and signs that make up the zodiac. Credit: NASA

During the year, the Sun passes through each of the constellations of the Zodiac. For example, in August, the Sun is in Leo, and then in September, the Sun is in Virgo. Your astrological sign is based on this. What this means is that the Sun is part of each constellation of the Zodiac over the course of a single year, so it can’t be said to be in any single constellation.

However, astrology is an obsolete and entirely unscientific practice. And if someone were to ask which constellation the Sun is in, surely they are seeking an answer that was astronomical (and not astrological) in nature. For that, we must consider what the constellations are in scientific terms.

The 88 Constellations:

Since ancient times, astronomers and scholars have been keeping track of “asterisms” (aka. constellations) in the night sky. By definition, these are collections of stars that, when viewed from Earth, appear in the same general area as each other night after night. In reality, they are actually located in very different locations, and can sometimes be up to thousands of light-years away from each other.

During the 2nd century CE, Hellenistic astronomer Claudius Ptolemaeus (Ptolemy) organized the constellations into a single treatise. This treatise, known as the Almagest, was the definitive source on Greek astronomy, and contained the names and meanings of the then-known 48 constellations. For over a thousand years, this work would remain canon for European and Islamic Astronomers.

The modern constellations. color-coded by family, with a dotted line denoting the ecliptic. Credit: NASA/Scientific Visualization Studio

Thanks to the Scientific Revolution and “Age of Exploration” – ca. 15th to 18th centuries CE – astronomers became aware of many more constellations. This was due to extensive overseas exploration, which brought European traders, explorers and waves of colonization to the Southern Hemisphere, East Asia and the Americas.

By 1922, the International Astronomical Union (IAU) officially divided the celestial sphere into 88 constellations. Of these, 36 lie predominantly in the northern sky while the other 52 lie predominantly in the southern. While it would take years to work out the exact delineation between these constellations, and many corresponded to their Greco-Roman predecessors, these 88 modern constellations would remain in use until this day.

However, these constellations divide up the night sky based on how it is viewed from Earth. Once again, our Sun cannot be considered to lie in any one of them because – relative to the Earth-bound observer – it passes through them. Alas, the only way to answer this question is to change our perspective.

From Other Star Systems:

If you could move away to another star, then our Sun would indeed appear to be part of the background stars. For example, if you were to travel to a planet orbiting the nearest star to the Solar System – Alpha Centauri (aka. Rigil Kentaurus) – then the Sun would indeed appear to be part of a constellation.

Artist’s impression of the Earth-like exoplanet orbiting Alpha Centauri B Credit: ESO

To be scientifically accurate, let us consider a planet that we actually know of. This would be the rocky extrasolar planet recently discovered around Proxima Centauri, which is known as Proxima b. Viewed from the surface of this planet, the Sun would appear to be part of the Cassiopeia constellation. However, rather than forming a W shape, our Sun would form a sixth point on its “western” end, making it look like a mountain chain (or a scribbled line).

But if you went to a different star system, the Sun’s position would change, depending on the direction. As such, the Sun really isn’t in any constellation per se. But then again, none of the other stars that make up the Milky Way are either. Much like what Einstein’s Theory of Relativity teaches us about space and time, the constellations themselves are relative to the observer.

We have written many interesting articles about the Sun and the constellations here at Universe Today. Here’s What are the Constellations?, Zodiac Signs and their Dates?, Where is the Sun?, and Earth’s Orbit Around the Sun.

For more information on how our Sun looks from Alpha Centauri, be sure to check out this page from Learn Astronomy. SAnd here’s an article about all 88 recognized constellations.

Astronomy Cast also has episodes on the subject. Here’s Episode 30: The Sun, Spots and All and Episode 157: Constellations.

Sources:

Solar Probe Plus Will ‘Touch’ The Sun

NASA's Solar Probe Plus will enter the sun's corona to understand space weather using a Faraday cup developed by the Smithsonian Astrophysical Observatory and Draper. Credit: NASA/Johns Hopkins University Applied Physics Laboratory

Coronal Mass Ejections (aka. solar flares) are a seriously hazardous thing. Whenever the Sun emits a burst of these charged particles, it can play havoc with electrical systems, aircraft and satellites here on Earth. Worse yet is the harm it can inflict on astronauts stationed aboard the ISS, who do not have the protection of Earth’s atmosphere. As such, it is obvious why scientists want to be able to predict these events better.

For this reason, the Smithsonian Astrophysical Observatory and the Charles Stark Draper Laboratory – a Cambridge, Massachusetts-based non-profit engineering organization – are working to develop specialized sensors for NASA’s proposed solar spacecraft. Launching in 2018, this spacecraft will fly into the Sun atmosphere and “touch” the face of the Sun to learn more about its behavior.

This spacecraft – known as the Solar Probe Plus (SPP) – is currently being designed and built by the Johns Hopkins University Applied Physics Laboratory. Once it is launched, the SPP will use seven Venus flybys over nearly seven years to gradually shrink its orbit around the Sun. During this time, it will conduct 24 flybys of the Sun and pass into the Sun’s upper atmosphere (corona), passing within 6.4 million km (4 million mi) of its surface.

At this distance, it will have traveled 37.6 million km (23.36 million mi) closer to the Sun than any spacecraft in history. At the same time, it will set a new record for the fastest moving object ever built by human beings – traveling at speeds of up to 200 km/sec (124.27 mi/s). And last but not least, it will be exposed to heat and radiation that no spacecraft has ever faced, which will include temperatures in excess of 1371 °C (2500 °F).

As Seamus Tuohy, the Director of the Space Systems Program Office at Draper, said in a CfA press release:

“Such a mission would require a spacecraft and instrumentation capable of withstanding extremes of radiation, high velocity travel and the harsh solar condition—and that is the kind of program deeply familiar to Draper and the Smithsonian Astrophysical Observatory.”

In addition to being an historic first, this probe will provide new data on solar activity and help scientists develop ways of forecasting major space-weather events – which impact life on Earth. This is especially important in an age when people are increasingly reliant on technology that can be negatively impacted by solar flares – ranging from aircraft and satellites to appliances and electrical devices.

According to a recent study by the National Academy of Sciences, it is estimated that a huge solar event today could cause two trillion dollars in damage in the US alone – and places like the eastern seaboard would be without power for up to a year. Without electricity to provide heating, utilities, light, and air-conditioning, the death toll from such an event would be significant.

As such, developing advanced warning systems that could reliably predict when a coronal mass ejection is coming is not just a matter of preventing damage, but saving lives. As Justin C. Kasper, the principal investigator at the Smithsonian Astrophysical Observatory and a professor in space science at the University of Michigan, said:

“[I]n addition to answering fundamental science questions, the intent is to better understand the risks space weather poses to the modern communication, aviation and energy systems we all rely on. Many of the systems we in the modern world rely on—our telecommunications, GPS, satellites and power grids—could be disrupted for an extended period of time if a large solar storm were to happen today. Solar Probe Plus will help us predict and manage the impact of space weather on society.”

To this end, the SPP has three major scientific objectives. First, it will seek to trace the flow of energy that heats and accelerates the solar corona and solar wind. Second, its investigators will attempt to determine the structure and dynamics of plasma and magnetic fields as the source of solar wind. And last, it will explore the mechanisms that accelerate and transport energetic particles – specifically electrons, protons, and helium ions.

To do this, the SPP will be equipped with an advanced suite of instruments. One of the most important of these is the one built by the Smithsonian Astrophysical Observatory with technical support from Draper. Known as the Faraday Cup – and named after famous electromagnetic scientists Michael Faraday – this device will be operated by SAO and the University of Michigan in Ann Arbor.

Designed to withstand interference from electromagnetic radiation, the Farady Cup will measure the velocity and direction of the Sun’s charged particles, and will be only two positioned outside of the SPP’s protective sun shield – another crucial component. Measuring 11.43 cm (4.5 inches) thick, this carbon composition shield will ensure that the probe can withstand the extreme conditions as it conducts its many flybys through the Sun’s corona.

Naturally, the mission presents several challenges, not the least of which will be capturing data while operating within an extreme environment, and while traveling at extreme speeds. But the payoff is sure to be worth it. For years, astronomers have studied the Sun, but never from inside the Sun’s atmosphere.

By flying through the birthplace of the highest-energy solar particles, the SPP is set to advance our understanding of the Sun and the origin and evolution of the solar wind. This knowledge could not only help us avoid a natural catastrophe here on Earth, but help advance our long-term goal of exploring (and even colonizing) the Solar System.

Further Reading: CfA

What is an Astronomical Unit?

Apsis
The Earth revolves around the Sun like this.

When it comes to dealing with the cosmos, we humans like to couch things in familiar terms. When examining exoplanets, we classify them based on their similarities to the planets in our own Solar System – i.e. terrestrial, gas giant, Earth-size, Jupiter-sized, Neptune-sized, etc. And when measuring astronomical distances, we do much the same.

For instance, one of the most commonly used means of measuring distances across space is known as an Astronomical Unit (AU). Based on the distance between the Earth and the Sun, this unit allows astronomers to characterize the vast distances between the Solar planets and the Sun, and between extra-solar planets and their stars.

Definition:

According to the current astronomical convention, a single Astronomical Unit is equivalent to 149,597,870.7 kilometers (or 92,955,807 miles). However, this is the average distance between the Earth and the Sun, as that distance is subject to variation during Earth’s orbital period. In other words, the distance between the Earth and the Sun varies in the course of a single year.

Earth’s orbit around the Sun, showing its average distance (or 1 AU). Credit: Huritisho/Wikipedia Commons

During the course of a year, the Earth goes from distance of 147,095,000 km (91,401,000 mi) from the Sun at perihelion (its closest point) to 152,100,000 km (94,500,000 mi) at aphelion (its farthest point) – or from a distance of 0.983 AUs to 1.016 AUs.

History of Development:

The earliest recorded example of astronomers estimating the distance between the Earth and the Sun dates back to Classical Antiquity. In the 3rd century BCE work, On the Sizes and Distances of the Sun and Moon – which is attributed to Greek mathematician Aristarchus of Samos – the distance was estimated to be between 18 and 20 times the distance between the Earth and the Moon.

However, his contemporary Archimedes, in his 3rd century BCE work Sandreckoner, also claimed that Aristarchus of Samos placed the distance of 10,000 times the Earth’s radius. Depending on the values for either set of estimates, Aristarchus was off by a factor of about 2 (in the case of Earth’s radius) to 20 (the distance between the Earth and the Moon).

The oldest Chinese mathematical text – the 1st century BCE treatise known as Zhoubi Suanjing – also contains an estimate of the distance between the Earth and Sun. According to the anonymous treatise, the distance could be calculated by conducting geometric measurements of the length of noontime shadows created by objects spaced at specific distances. However, the calculations were based on the idea that the Earth was flat.

Illustration of the Ptolemaic geocentric conception of the Universe, by Bartolomeu Velho (?-1568), from his work Cosmographia, made in France, 1568. Credit: Bibilotèque nationale de France, Paris

Famed 2nd century CE mathematician and astronomer Ptolemy relied on trigonometric calculations to come up with a distance estimate that was equivalent to 1210 times the radius of the Earth. Using records of lunar eclipses, he estimated the Moon’s apparent diameter, as well as the apparent diameter of the shadow cone of Earth traversed by the Moon during a lunar eclipse.

Using the Moon’s parallax, he also calculated the apparent sizes of the Sun and the Moon and concluded that the diameter of the Sun was equal to the diameter of the Moon when the latter was at it’s greatest distance from Earth. From this, Ptolemy arrived at a ratio of solar to lunar distance of approximately 19 to 1, the same figure derived by Aristarchus.

For the next thousand years, Ptolemy’s estimates of the Earth-Sun distance (much like most of his astronomical teachings) would remain canon among Medieval European and Islamic astronomers. It was not until the 17th century that astronomers began to reconsider and revise his calculations.

This was made possible thanks to the invention of the telescope, as well as Kepler’s Three Laws of Planetary Motion, which helped astronomers calculate the relative distances between the planets and the Sun with greater accuracy. By measuring the distance between Earth and the other Solar planets, astronomers were able to conduct parallax measurements to obtain more accurate values.

With parallax technique, astronomers observe object at opposite ends of Earth’s orbit around the Sun to precisely measure its distance. Credit: Alexandra Angelich, NRAO/AUI/NSF.

By the 19th century, determinations of about the speed of light and the constant of the aberration of light resulted in the first direct measurement of the Earth-Sun distance in kilometers.  By 1903, the term “astronomical unit” came to be used for the first time. And throughout the 20th century, measurements became increasingly precise and sophisticated, thanks in part to accurate observations of the effects of Einstein’s Theory of Relativity.

Modern Usage:

By the 1960s, the development of direct radar measurements, telemetry, and the exploration of the Solar System with space probes led to precise measurements of the positions of the inner planets and other objects. In 1976, the International Astronomical Union (IAU) adopted a new definition during their 16th General Assembly. As part of their System of Astronomical Constants, the new definition stated:

“The astronomical unit of length is that length (A) for which the Gaussian gravitational constant (k) takes the value 0.01720209895 when the units of measurement are the astronomical units of length, mass and time. The dimensions of k² are those of the constant of gravitation (G), i.e., L³M-1T2. The term “unit distance” is also used for the length A.”

In response to the development of hyper-precise measurements, the International Committee for Weights and Measures (CIPM) decided to modify the the International System of Units (SI) in 1983. Consistent with this, they redefined the meter to be measured in terms of the speed of light in vacuum.

Infographic comparing the orbit of the planet around Proxima Centauri (Proxima b) with the same region of the Solar System. Credit: ESO

However, by 2012, the IAU determined that the equalization of relativity made the measurement of AUs too complex, and redefined the astronomical unit in terms of meters. In accordance with this, a single AU is equal to 149597870.7 km exactly (92.955807 million miles), 499 light-seconds, 4.8481368×10⁻⁶ of a parsec, or 15.812507×10⁻⁶ of a light-year.

Today, the AU is used commonly to measure distances and create numerical models for the Solar System. It is also used when measuring extra-solar systems, calculating the extent of protoplanetary clouds or the distance between extra-solar planets and their parent star. When measuring interstellar distances, AUs are too small to offer convenient measurements. As such, other units – such as the parsec and the light year – are relied upon.

The Universe is a huge place, and measuring even our small corner of it producing some staggering results. But as always, we prefer to express them in ways that are as relatable and familiar.

We’ve written many interesting articles about distances in the Solar System here at Universe Today. Here’s How Far are the Planets from the Sun?, How Far is Mercury from the Sun?, How Far is Venus from the Sun?, How Far is Earth from the Sun?, How Far is Mars from the Sun?, How Far is Jupiter from the Sun?, How Far is Saturn from the Sun?, How Far is Uranus from the Sun?, How Far is Neptune from the Sun?, How Far is Pluto from the Sun?

If you’d like more information about the Earth’s orbit, check out NASA’s Solar System Exploration page.

We’ve also recorded an episode of Astronomy Cast dedicated to the measurement of distances in astronomy. Listen here, Episode 10: Measuring Distance in the Universe.

Sources:

How Far is the Asteroid Belt from the Sun?

It's long been thought that a giant asteroid, which broke up long ago in the main asteroid belt between Mars and Jupiter, eventually made its way to Earth and led to the extinction of the dinosaurs. New studies say that the dinosaurs may have been facing extinction before the asteroid strike, and that mammals were already on the rise. Image credit: NASA/JPL-Caltech

In the 18th century, observations made of all the known planets (Mercury, Venus, Earth, Mars, Jupiter and Saturn) led astronomers to discern a pattern in their orbits. Eventually, this led to the Titius–Bode law, which predicted the amount of space between the planets. In accordance with this law, there appeared to be a discernible gap between the orbits of Mars and Jupiter, and investigation into it led to a major discovery.

Eventually, astronomers realized that this region was pervaded by countless smaller bodies which they named “asteroids”. This in turn led to the term “Asteroid Belt”, which has since entered into common usage. Like all the planets in our Solar System, it orbits our Sun, and has played an important role in the evolution and history of our Solar System.

Structure and Composition:

The Asteroid Belt consists of several large bodies, along with millions of smaller size. The larger bodies, such as Ceres, Vesta, Pallas, and Hygiea, account for half of the belt’s total mass, with almost one-third accounted for by Ceres alone. Beyond that, over 200 asteroids that are larger than 100 km in diameter, and 0.7–1.7 million asteroids with a diameter of 1 km or more.

Ceres compared to asteroids visited to date, including Vesta, Dawn's mapping target in 2011. Image by NASA/ESA. Compiled by Paul Schenck.
Ceres compared to asteroids visited to date, including Vesta, Dawn’s mapping target in 2011. Credit: NASA/ESA/Paul Schenck

It total, the Asteroid Belt’s mass is estimated to be 2.8×10²¹ to 3.2×10²¹ kilograms – which is equivalent to about 4% of the Moon’s mass. While most asteroids are composed of rock, a small portion of them contain metls such as iron and nickel. The remaining asteroids are made up of a mix of these, along with carbon-rich materials. Some of the more distant asteroids tend to contain more ices and volatiles, which includes water ice.

Despite the impressive number of objects contained within the belt, the Main Belt’s asteroids are also spread over a very large volume of space. As a result, the average distance between objects is roughly 965,600 km (600,000 miles), meaning that the Main Belt consists largely of empty space. In fact, due to the low density of materials within the Belt, the odds of a probe running into an asteroid are now estimated at less than one in a billion.

The main (or core) population of the asteroid belt is sometimes divided into three zones, which are based on what is known as “Kirkwood gaps”. Named after Daniel Kirkwood, who announced in 1866 the discovery of gaps in the distance of asteroids, these gaps are similar to what is seen with Saturn’s and other gas giants’ systems of rings.

Origin:

Originally, the Asteroid Belt was thought to be the remnants of a much larger planet that occupied the region between the orbits of Mars and Jupiter. This theory was originally suggested by Heinrich Olbders to William Herschel as a possible explanation for the existence of Ceres and Pallas. However, this hypothesis has since been shown to have several flaws.

For one, the amount of energy required to destroy a planet would have been staggering, and no scenario has been suggested that could account for such events. Second, there is the fact that the mass of the Asteroid Belt is only 4% that of the Moon (and 22% that of Pluto). The odds of a cataclysmic collision with such a tiny body are very unlikely. Lastly, the significant chemical differences between the asteroids do no point towards a common origin.

Today, the scientific consensus is that, rather than fragmenting from an original planet, the asteroids are remnants from the early Solar System that never formed a planet at all. During the first few million years of the Solar System’s history, gravitational accretion caused clumps of matter to form out of an accretion disc. These clumps gradually came together, eventually undergoing hydrostatic equilibrium (become spherical) and forming planets.

However, within the region of the Asteroid Belt, planestesimals were too strongly perturbed by Jupiter’s gravity to form a planet. As such, these objects would continue to orbit the Sun as they had before, with only one object (Ceres) having accumulated enough mass to undergo hydrostatic equilibrium. On occasion, they would collide to produce smaller fragments and dust.

The asteroids also melted to some degree during this time, allowing elements within them to be partially or completely differentiated by mass. However, this period would have been necessarily brief due to their relatively small size. It likely ended about 4.5 billion years ago, a few tens of millions of years after the Solar System’s formation.

Though they are dated to the early history of the Solar System, the asteroids (as they are today) are not samples of its primordial self. They have undergone considerable evolution since their formation, including internal heating, surface melting from impacts, space weathering from radiation, and bombardment by micrometeorites. Hence, the Asteroid Belt today is believed to contain only a small fraction of the mass of the primordial belt.

Computer simulations suggest that the original asteroid belt may have contained mass equivalent to the Earth. Primarily because of gravitational perturbations, most of the material was ejected from the belt a million years after its formation, leaving behind less than 0.1% of the original mass. Since then, the size distribution of the asteroid belt is believed to have remained relatively stable.

When the asteroid belt was first formed, the temperatures at a distance of 2.7 AU from the Sun formed a “snow line” below the freezing point of water. Essentially, planetesimals formed beyond this radius were able to accumulate ice, some of which may have provided a water source of Earth’s oceans (even more so than comets).

Distance from the Sun:

Located between Mars and Jupiter, the belt ranges in distance between 2.2 and 3.2 astronomical units (AU) from the Sun – 329 million to 478.7 million km (204.43 million to 297.45 million mi). It is also an estimated to be 1 AU thick (149.6 million km, or 93 million mi), meaning that it occupies the same amount of distance as what lies between the Earth to the Sun.

The asteroids of the inner Solar System and Jupiter: The donut-shaped asteroid belt is located between the orbits of Jupiter and Mars. Credit: Wikipedia Commons

The distance of an asteroid from the Sun (its semi-major axis) depends upon its distribution into one of three different zones based on the Belt’s “Kirkwood Gaps”. Zone I lies between the 4:1 resonance and 3:1 resonance Kirkwood gaps, which are roughly 2.06 and 2.5 AUs (3 to 3.74 billion km; 1.86 to 2.3 billion mi) from the Sun, respectively.

Zone II continues from the end of Zone I out to the 5:2 resonance gap, which is 2.82 AU (4.22 billion km; 2.6 mi) from the Sun. Zone III, the outermost section of the Belt, extends from the outer edge of Zone II to the 2:1 resonance gap, located some 3.28 AU (4.9 billion km; 3 billion mi) from the Sun.

While many spacecraft have been to the Asteroid Belt, most were passing through on their way to the outer Solar System. Only in recent years, with the Dawn mission, that the Asteroid Belt has been a focal point of scientific research. In the coming decades, we may find ourselves sending spaceships there to mine asteroids, harvest minerals and ices for use here on Earth.

We’ve written many articles about the Asteroid Belt here at Universe Today. Here’s What is the Asteroid Belt?, How Long Does it Take to get to the Asteroid Belt?, How Far is the Asteroid Belt from Earth?, Why Isn’t the Asteroid Belt a Planet?, and Why the Asteroid Belt Doesn’t Threaten Spacecraft.

To learn more, check out NASA’s Lunar and Planetary Science Page on asteroids, and the Hubblesite’s News Releases about Asteroids.

Astronomy Cast also some interesting episodes about asteroids, like Episode 55: The Asteroid Belt and Episode 29: Asteroids Make Bad Neighbors.

Sources:

This Star Is The Roundest Natural Object Ever Seen

The star Kepler 11145123 is the roundest natural object ever measured in the universe, with a difference of just 3 km between the radius at the equator and the poles. Credit and ©: Mark A. Garlick

At one time, scientists believed that the Earth, the Moon, and all the other planets in our Solar System were perfect spheres. The same held true for the Sun, which they considered to be the heavenly orb that was the source of all our warmth and energy. But as time and research showed, the Sun is far from perfect. In addition to sunspots and solar flares, the Sun is not completely spherical.

For some time, astronomers believed this was the case with other stars as well. Owing to a number of factors, all stars previously studied by astronomers appeared to experience some bulging at the equator (i.e. oblateness). However, in a study published by a team of international astronomers, it now appears that a slowly rotating star located 5000 light years away is as close to spherical as we’ve ever seen!

Until now, observation of stars has been confined to only a few of the fastest-rotating nearby stars, and was only possible through interferometry. This technique, which is typically used by astronomers to obtain stellar size estimates, relies on multiple small telescopes obtaining electromagnetic readings on a star. This information is then combined to create a higher-resolution image that would be obtained by a large telescope.

Artist's impression of a white dwarf star in orbit around Sirius (a white supergiant). Credit: NASA, ESA and G. Bacon (STScI)
Artist’s impression of a Sirius, an A-type Main Sequence White star. Credit: NASA, ESA and G. Bacon (STScI)

However, by conducting asteroseismic measurements of a nearby star, a team of astronomers – from the Max Planck Institute, the University of Tokyo, and New York University Abu Dhabi (NYUAD) – were able to get a much more precise idea of its shape. Their results were published in a study titled “Shape of a Slowly Rotating Star Measured by Asteroseismology“, which recently appeared in the American Association for the Advancement of Science.

Laurent Gizon, a researcher with the Max Planck Institute, was the lead authjor on the paper. As he explained their research methodology to Universe Today via email:

“The new method that we propose in this paper to measure stellar shapes, asteroseismology, can be several orders of magnitude more precise than optical interferometry. It applies only to stars that oscillate in long-lived non-radial modes. The ultimate precision of the method is given by the precision on the measurement of the frequencies of the modes of oscillation. The longer the observation duration (four years in the case of Kepler), the better the precision on the mode frequencies. In the case of  KIC 11145123 the most precise mode frequencies can be determined to one part in 10,000,000. Hence the astonishing precision of asteroseismology.”

Located 5000 light years away from Earth, KIC 11145123 was considered a perfect candidate for this method. For one, Kepler 11145123 is a hot and luminous, over twice the size of our Sun, and rotates with a period of 100 days. Its oscillations are also long-lived, and correspond directly to fluctuations in its brightness. Using data obtained by NASA’s Kepler mission over a more than four year period, the team was able to get very accurate shape estimates.

The variations in brightness can be interpreted as vibrations, or oscillations within the stars, using a technique called asteroseismology. The oscillations reveal information about the internal structure of the stars, in much the same way that seismologists use earthquakes to probe the Earth's interior. Credit: Kepler Astroseismology team.
The variations in brightness can be interpreted as vibrations, or oscillations within the stars, using a technique called asteroseismology. Credit: Kepler Astroseismology team.

“We compared the frequencies of the modes of oscillation that are more sensitive to the low-latitude regions of the star to the frequencies of the modes that are more sensitive to higher latitudes,” said Gizon. “This comparison showed that the difference in radius between the equator and the poles is only 3 km with a precision of 1 km. This makes Kepler 11145123 the roundest natural object ever measured, it is even more round than the Sun.”

For comparison, our Sun has a rotational period of about 25 days, and the difference between its polar and equatorial radii is about 10 km. And on Earth, which has a rotational period of less than a day (23 hours 56 minutes and 4.1 seconds), there is a difference of over 23 km (14.3 miles) between its polar and equator. The reason for this considerable difference is something of a mystery.

In the past, astronomers have found that the shape of a star can come down to multiple factors – such as their rotational velocity, magnetic fields, thermal asphericities, large-scale flows, strong stellar winds, or the gravitational influence of stellar companions or giant planets. Ergo, measuring the “asphericity” (i.e. the degree to which a star is NOT a sphere) can tell astronomers much about the star structures and its system of planets.

Ordinarily, rotational velocity has been seen to have a direct bearing on the stars asphericity – i.e. the faster it rotates, the more oblate it is. However, when looking at data obtained by the Kepler probe over a period of four years, they noticed that its oblateness was only a third of what they expected, given its rotational velocity.

Laurent Gizon, the lead researcher of the study, pictured comparing images of our Sun and Kepler 11145123. Credit: Max Planck Institute for Solar System Research, Germany.
Laurent Gizon, the lead researcher of the study, pictured with asteroseismic readings of Kepler 11145123. Credit: Max Planck Institute for Solar System Research, Germany.

As such, they were forced to conclude that something else was responsible for the star’s highly spherical shape. “”We propose that the presence of a magnetic field at low latitudes could make the star look more spherical to the stellar oscillations,” said Gizon. “It is known in solar physics that acoustic waves propagate faster in magnetic regions.”

Looking to the future, Gizon and his colleagues hope to examine other stars like Kepler 11145123. In our Galaxy alone, there are many stars who’s oscillations can be accurately measured by observing changes in their brightness. As such, the international team hopes to apply their asteroseismology method to other stars observed by Kepler, as well as upcoming missions like TESS and PLATO.

“Just like helioseismology can be used to study the Sun’s magnetic field, asteroseismology can be used to study magnetism on distant stars,” Gizon added. “This is the main message of this study.”

Further Reading: ScienceMag, Max Planck Institute

Why Are Stars Different Colors?

Artist's impression of a white dwarf star in orbit around Sirius (a white supergiant). Credit: NASA, ESA and G. Bacon (STScI)

Stars are beautiful, wondrous things. Much like planets, planetoids and other stellar bodies, they come in many sizes, shapes, and even colors. And over the course of many centuries, astronomers have come to discern several different types of stars based on these fundamental characteristics.

For instance, the color of a star – which varies from bluish-white and yellow to orange and red – is primarily due to its composition and effective temperature. And at all times, stars emit light which is a combination of several different wavelengths. On top of that, the color of a star can change over time.

Composition:

Different elements emit different wavelengths of electromagnetic radiation when heated. In the case of stars, his includes its main constituents (hydrogen and helium), but also the various trace elements that make it up. The color that we see is the combination of these different electromagnetic wavelengths, which are referred to as as a Planck’s curve.

Diagram illustrating Wein's Law (colored curves), which describes the emission of radiation from a black body. Credit: Wikipedia Commons/Darth Kule
Diagram illustrating Wein’s Law, which describes the emission of radiation from a black body based on its peak wavelength. Credit: Wikipedia Commons/Darth

The wavelength at which a star emits the most light is called the star’s “peak wavelength” (which known as Wien’s Law), which is the peak of its Planck curve. However, how that light appears to the human eye is also mitigated by the contributions of the other parts of its Planck curve.

In short, when the various colors of the spectrum are combined, they appear white to the naked eye. This will make the apparent color of the star appear lighter than where star’s peak wavelength falls on the color spectrum. Consider our Sun. Despite the fact that its peak emission wavelength corresponds to the green part of the spectrum, its color appears pale yellow.

A star’s composition is the result of its formation history. Ever star is born of a nebula made up of gas and dust, and each one is different. While nebulas in the interstellar medium are largely composed of hydrogen, which is the main fuel for star creation, they also carry other elements. The overall mass of the nebula, as well as the various elements that make it up, determine what kind of star will result.

The change in color these elements add to stars is not very obvious, but can be studied thanks to the method known as spectroanalysis. By examining the various wavelengths a star produces using a spectrometer, scientists are able to determine what elements are being burned inside.

Temperature and Distance:

The other major factor effecting a star’s color is its temperature. As stars increase in heat, the overall radiated energy increases, and the peak of the curve moves to shorter wavelengths. In other words, as a star becomes hotter, the light it emits is pushed further and further towards the blue end of the spectrum. As stars grow colder, the situation is reversed (see below).

A third and final factor that will effect what light a star appears to be emitting is known as the Doppler Effect. When it comes to sound, light, and other waves, the frequency can increase or decrease based on the distance between the source and the observer.

When it comes to astronomy, this effect causes the what is known as “redshift” and “blueshift” – where the visible light coming from a distant star is shifted towards the red end of the spectrum if it is moving away, and the blue end if it is moving closer.

Modern Classification:

Modern astronomy classifies stars based on their essential characteristics, which includes their spectral class (i.e. color), temperature, size, and brightness. Most stars are currently classified under the Morgan–Keenan (MK) system, which classifies stars based on temperature using the letters O, B, A, F, G, K, and M, – O being the hottest and M the coolest.

Each letter class is then subdivided using a numeric digit with 0 being hottest and 9 being coolest (e.g. O1 to M9 are the hottest to coldest stars). In the MK system, a luminosity class is added using Roman numerals. These are based on the width of certain absorption lines in the star’s spectrum (which vary with the density of the atmosphere), thus distinguishing giant stars from dwarfs.

Luminosity classes 0 and I apply to hyper- or supergiants; classes II, III and IV apply to bright, regular giants, and subgiants, respectively; class V is for main-sequence stars; and class VI and VII apply to subdwarfs and dwarf stars. There is also the Hertzsprung-Russell diagram, which relates stellar classification to absolute magnitude (i.e. intrinsic brightness), luminosity, and surface temperature.

The same classification for spectral types are used, ranging from blue and white at one end to red at the other, which is then combined with the stars Absolute Visual Magnitude (expressed as Mv) to place them on a 2-dimensional chart (see below).

The Hertzspirg-Russel diagram, showing the relation between star's color, AM. luminosity, and temperature. Credit: astronomy.starrynight.com
The Hertzspirg-Russel diagram, showing the relation between star’s color, AM. luminosity, and temperature. Credit: astronomy.starrynight.com

On average, stars in the O-range are hotter than other classes, reaching effective temperatures of up to 30,000 K. At the same time, they are also larger and more massive, reaching sizes of over 6 and a half solar radii and up to 16 solar masses. At the lower end, K and M type stars (orange and red dwarfs) tend to be cooler (ranging from 2400 to 5700 K), measuring 0.7 to 0.96 times that of our Sun, and being anywhere from 0.08 to 0.8 as massive.

Stellar Evolution:

Stars also go through an evolutionary life cycle, during which time their sizes, temperatures and colors change. For example, when our Sun exhausts all the hydrogen in its the core, it will become unstable and collapse under its own weight. This will cause the core to heat up and get denser, causing the Sun to grow in size.

At this point, it will have left its Main Sequence phase and entered into the Red Giant Phase of its life, which (as the name would suggest) will be characterized by expansion and it becoming a deep red. When this happens, it is theorized that our Sun will expand to encompass the orbits of Mercury and even Venus.

Earth, if it survives this expansion, will be so close that it will be rendered uninhabitable. When our Sun then reaches its post-Red Giant Phase, the Sun will begin to eject mass, leaving an exposed core known as a white dwarf. This remnant will survive for trillions of years before fading to black.

This is believed to be the case with all stars that have between 0.5 to 1 Solar Mass (half, or as much mass of our Sun). The situation is slightly different when it comes to low mass stars (i.e. red dwarfs), which typically have around 0.1 Solar Masses.

It is believed that these stars can remain in their Main Sequence for some six to twelve trillion years and will not experience a Red Giant Phase. However, they will gradually increase in both temperature and luminosity, and will exist for several hundred billion more years before they eventually collapse into a white dwarf.

On the other hand, supergiant stars (up to 100 Solar Masses or more) have so much mass in their cores that they will likely experience helium ignition as soon as they exhaust their supplies of hydrogen. As such, they will likely not survive to become Red Supergiants, and will instead end their lives in a massive supernova.

To break it all down, stars vary in color depending on their chemical compositions, their respective sizes and their temperatures. Over time, as these characteristics change (as a result of them spending their fuel) many will darken and become redder, while others will explode magnificently. The more stars observe, the more we come to know about our Universe and its long, long history!

We have written many articles about stars on Universe Today. Here’s What is the Biggest Star in the Universe?, What is a Binary Star?, Do Stars Move?, What are the Most Famous Stars?, What is the Brightest Star in the Sky, Past and Future?

Want more information on stars? Here’s Hubblesite’s News Releases about Stars, and more information from NASA’s imagine the Universe.

We have recorded several episodes of Astronomy Cast about stars. Here are two that you might find helpful: Episode 12: Where Do Baby Stars Come From, and Episode 13: Where Do Stars Go When they Die?

Sources:

How Can We Save The Sun?

How Can We Save The Sun?

Remember the movie Sunshine, where astronomers learn that the Sun is dying? So a plucky team of astronauts take a nuclear bomb to the Sun, and try to jump-start it with a massive explosion. Yeah, there’s so much wrong in that movie that I don’t know where to start. So I just won’t.

Seriously, a nuclear bomb to cure a dying Sun?

Here’s the thing, the Sun is actually dying. It’s just that it’s going to take about another 5 billion years to run of fuel in its core. And when it does, Cillian Murphy won’t be able to restart it with a big nuke.

But the Sun doesn’t have to die so soon. It’s made of the same hydrogen and helium as the much less massive red dwarf stars. And these stars are expected to last for hundreds of billions and even trillions of years.

Is there anything we can do to save the Sun, or jump-start it when it runs out of fuel in the core?

First, let me explain the problem. The Sun is a main sequence star, and it measures 1.4 million kilometers across. Like ogres and onions, the Sun is made of layers.

The interior structure of the Sun. Credit: Wikipedia Commons/kelvinsong

The innermost layer is the core. That’s the region where the temperature and pressure is so great that atoms of hydrogen are mashed together so tightly they can fuse into helium. This fusion reaction is exothermic, which means that it gives off more energy than it consumes.

The excess energy is released as gamma radiation, which then makes its way through the star and out into space. The radiation pushes outward, and counteracts the inward force of gravity pulling it together. This balance creates the Sun we know and love.

Outside the core, temperatures and pressures drop to the point that fusion can no longer happen. This next region is known as the radiative zone. It’s plenty hot, and the photons of gamma radiation generated in the core of the Sun need to bounce randomly from atom to atom, maybe for hundreds of thousands of years to finally escape. But it’s not hot enough for fusion to happen.

Outside the radiative zone is the convective zone. This is where the material in the Sun is finally cool enough that it can move around like a lava lamp. Hot blobs of plasma pick up enormous heat from the radiative zone, float up to the surface of the Sun, release their heat and then sink down again.

The only fuel the Sun can use for fusion is in the core, which accounts for only 0.8% of the Sun’s volume and 34% of its mass. When it uses up that hydrogen in the core, it’ll blow off its outer layers into space and then shrink down into a white dwarf.

The radiative zone acts like a wall, preventing the mixing convective zone from reaching the solar core.

If the Sun was all convective zone, then this wouldn’t be a problem, it would be able to go on mixing its fuel, using up all its hydrogen instead of this smaller fraction. If the Sun was more like a red dwarf, it could last much longer.

GJ1214b, shown in this artist’s view, is a super-Earth orbiting a red dwarf star 40 light-years from Earth. Credit: NASA, ESA, and D. Aguilar (Harvard-Smithsonian Center for Astrophysics)
Red dwarf stars burn for much longer than our Sun. Credit: NASA, ESA, and D. Aguilar (Harvard-Smithsonian Center for Astrophysics)

In order to save the Sun, to help it last longer than the 5 billion years it has remaining, we would need some way to stir up the Sun with a gigantic mixing spoon. To get that unburned hydrogen from the radiative and convective zones down into the core.

One idea is that you could crash another star into the Sun. This would deliver fresh fuel, and mix up the Sun’s hydrogen a bit. But it would be a one time thing. You’d need to deliver a steady stream of stars to keep mixing it up. And after a while you would accumulate enough mass to create a supernova. That would be bad.

But another option would be to strip material off the Sun and create red dwarfs. Stars with less than 35% the mass of the Sun are fully convective. Which means that they don’t have a radiative zone. They fully mix all their hydrogen fuel into the core, and can last much longer.

Imagine a future civilization tearing the Sun into 3 separate stars, each of which could then last for hundreds of billions of years, putting out only 1.5% the energy of the Sun. Huddle up for warmth.

But if you want to take this to the extreme, tear the Sun into 13 separate red dwarf stars with only 7.5% the mass of the Sun. These will only put out .015% the light of the Sun, but they’ll sip away at their hydrogen for more than 10 trillion years.

Stick the Earth in the middle and you'd have some very odd sunsets, not to mention orbital dynamics. Created with Universe Sandbox ²
Stick the Earth in the middle and you’d have some very odd sunrises and sunsets, not to mention orbital dynamics. Created with Universe Sandbox ²

But how can you get that hydrogen off the Sun? Lasers, of course. Using a concept known as stellar lifting, you could direct a powerful solar powered laser at a spot on the Sun’s surface. This would heat up the region, and generate a powerful solar wind. The Sun would be blasting its own material into space. Then you could use magnetic fields or gravity to direct the outflows and collect them into other stars. It boggles our imagination, but it would be a routine task for Type III Civilization engineers on star dismantling duty.

So don’t panic that our Sun only has a few billion years of life left. We’ve got options. Mind bendingly complicated, solar system dismantling options. But still… options.

What are the Parts of the Sun?

The interior structure of the Sun. Credit: Wikipedia Commons/kelvinsong

From here on Earth, the Sun like a smooth ball of light. And prior to Galileo’s discovery of sunposts, astronomers even thought it was a perfect orb with no imperfections. However, thanks to improved instruments and many centuries of study, we know that the Sun is much like the planets of our Solar System.

In addition to imperfections on its surface, the Sun is also made up of several layers, each of which serves its own purpose. It’s this structure of the Sun that powers this massive engine that provides the planets with all the light and heat they receive. And here on Earth, it is what provides all life forms with the energy they need to thrive and survive.

Composition:

If you could take the Sun apart, and stack up its various elements, you would find that the Sun is made of hydrogen (74%) and helium (about 24%). Astronomers consider anything heavier than helium to be a metal. The remaining amount of the Sun is made of iron, nickel, oxygen, silicon, sulfur, magnesium, carbon, neon, calcium and chromium. In fact, the Sun is 1% oxygen; and everything else comes out of that last 1%.

Where did these elements come from? The hydrogen and helium came from the Big Bang. In the early moments of the Universe, the first element, hydrogen, formed from the soup of elementary particles. The pressure and temperatures were still so intense that the entire Universe had the same conditions as the core of a star.

Hydrogen was fused into helium until the Universe cooled down enough that this reaction couldn’t happen any more. The ratios of hydrogen and helium that we see in the Universe today were created in those first few moments after the Big Bang. The other elements were created in other stars. Stars are constantly fusing hydrogen into helium in their cores.

Once the hydrogen in the core runs out, they switch to fusing heavier and heavier elements, like helium, lithium, oxygen. Most of the heavier metals we see in the Sun were formed in other stars at the end of their lives. The heaviest elements, like gold and uranium, were formed when stars many times more massive that our Sun detonated in supernova explosions.

In a fraction of a second, as a black hole was forming, elements were crushed together in the intense heat and pressure to form the heaviest elements. The explosion scattered these elements across the region, where they could contribute to the formation of new stars.

Our Sun is made up of elements left over from the Big Bang, elements formed from dying stars, and elements created in supernovae. That’s pretty amazing.

Structure:

Although the Sun is mostly just a ball of hydrogen and helium, it’s actually broken up into distinct layers. The layers of the Sun are created because the temperatures and pressures increase as you move towards the center of the Sun. The hydrogen and helium behave differently under the changing conditions.

The Core: Let’s start at the innermost layer of the Sun, the core of the Sun. This is the very center of the Sun, where temperatures and pressures are so high that fusion can happen. The Sun is combining hydrogen into helium atoms, and this reaction gives off the light and heat that we see here on Earth. The density of the core is 150 times the density of water, and the temperatures are thought to be 13,600,000 degrees Kelvin.

Astronomers believe that the core of the Sun extends from the center out to about 0.2 solar radius. And within this region, temperatures and pressures are so high that hydrogen atoms are torn apart to form separate protons, neutrons and electrons. With all of these free floating particles, the Sun is able to reform them into atoms of helium.

This reaction is exothermic. That means that the reaction gives off a tremendous amount of heat – 3.89 x 1033 ergs of energy every second. The light pressure of all this energy streaming from the core of the Sun is what stops it from collapsing inward on itself.

Radiative Zone: The radiative zone of the Sun starts at the edge of the core of the Sun (0.2 solar radii), and extends up to about 0.7 radii. Within the radiative zone, the solar material is hot and dense enough that thermal radiation transfers the heat of the core outward through the Sun.

The core of the Sun is where nuclear fusion reactions are happening – protons are merged together to create atoms of helium. This reaction produces a tremendous amount of gamma radiation. These photons of energy are emitted, absorbed, and then emitted again by various particles in the radiative zone.

The path that photons take is called the “random walk”. Instead of going in a straight beam of light, they travel in a zigzag direction, eventually reaching the surface of the Sun. In fact, it can take a single photon upwards of 200,000 years to make the journey through the radiative zone of the Sun.

As they transfer from particle to particle, the photons lose energy. That’s a good thing, since we wouldn’t want only gamma radiation streaming from the Sun. Once these photons reach space, they take a mere 8 minutes to get to Earth.

Most stars will have radiative zones, but their size depends on the star’s size. Small stars will have much smaller radiative zones, and the convective zone will take up a larger portion of the star’s interior. The smallest stars might not have a radiative zone at all, with the convective zone reaching all the way down to the core. The largest stars would have the opposite situation, where the radiative zone reaches all the way up to the surface.

Convective Zone: Outside the radiative zone is another layer, called the convective zone, where heat from inside the Sun is carried up by columns of hot gas. Most stars have a convective zone. In the case of the Sun, it starts at around 70% of the Sun’s radius and goes to the outer surface (the photosphere).

Gas deeper inside the star is heated up so that it rises, like globs of wax in a lava lamp. As it gets to the surface, the gas loses some of its heat, cools down, and sinks back towards the center to pick up more heat. Another example would be a pot of boiling water on the stove.

The surface of the Sun looks granulated. These granules are the columns of hot gas that carry heat to the surface. They can be more than 1,000 km across, and typically last about 8 to 20 minutes before dissipating. Astronomers think that low mass stars, like red dwarfs, have a convective zone that goes all the way down to the core. Unlike the Sun, they don’t have a radiative zone at all.

Photosphere: The layer of the Sun that we can see from Earth is called the photosphere. Below the photosphere, the Sun becomes opaque to visible light, and astronomers have to use other methods to probe its interior. The temperature of the photosphere is about 6,000 Kelvin, and gives off the yellow-white light that we see.

Above the photosphere is the atmosphere of the Sun. Perhaps the most dramatic of these is the corona, which is visible during a total solar eclipse.

This graphic shows a model of the layers of the Sun, with approximate mileage ranges for each layer: for the inner layers, the mileage is from the sun's core; for the outer layers, the mileage is from the sun's surface. The inner layers are the Core, Radiative Zone and Convection Zone. The outer layers are the Photosphere, the Chromosphere, the Transition Region and the Corona. Credit: NASA
Graphic showing a model of the layers of the Sun, with approximate mileage ranges for each layer. Credit: NASA

Diagram:

Below is a diagram of the Sun, originally developed by NASA for educational purposes.

  • Visible, IR and UV radiation – The light that we see coming from the Sun is visible, but if you close your eyes and just feel the warmth, that’s IR, or infrared radiation. And the light that gives you a sunburn is ultraviolet (UV) radiation. The Sun produces all of these wavelengths at the same time.
  • Photosphere 6000 K – The photosphere is the surface of the Sun. This is the region where light from the interior finally reaches space. The temperature is 6000 K, which is the same as 5,700 degrees C.
  • Photosphere 6000 K – The photosphere is the surface of the Sun. This is the region where light from the interior finally reaches space. The temperature is 6000 K, which is the same as 5,700 degrees C.
  • Radio emissions – In addition to visible, IR and UV, the Sun also gives off radio emissions, which can be detected by a radio telescope. These emissions rise and fall depending on the number of sunspots on the surface of the Sun.
  • Coronal Hole – These are regions on the Sun where the corona is cooler, darker and has less dense plasma.
  • 2100000 – This is the temperature of the Sun’s radiative zone.
  • Convective zone/Turbulent convection – This is the region of the Sun where heat from the core is transferred through convection. Warm columns of plasma rise to the surface in columns, release their heat and then fall back down to heat up again.
  • Coronal loops – These are loops of plasma in the Sun’s atmosphere that follows magnetic flux lines. They look like big arches, stretching up from the surface of the Sun for hundreds of thousands of kilometers.
  • Core – The is the heart of the Sun, where the temperatures and pressures are so high that nuclear fusion reactions can happen. All of the energy coming from the Sun originates from the core.
  • 14500000 K – The temperature of the core of the Sun.
  • Radiative Zone – The region of the Sun where energy can only be transferred through radiation. It can take a single photon 200,000 years to get from the core, through the radiative zone, out to the surface and into space.
  • Neutrinos – Neutrinos are nearly mass-less particles blasted out from the Sun as part of the fusion reactions. There are millions of neutrinos passing through your body every second, but they don’t interact, so you can’t feel them.
  • Chromospheric Flare – The Sun’s magnetic field can get twisted up and then snap into a different configuration. When this happens, there can be powerful X-ray flares emanating from the surface of the Sun.
  • Magnetic Field Loop – The Sun’s magnetic field extends out above its surface, and can be seen because hot plasma in the atmosphere follows the field lines.
  • Spot – A sunspot. These are areas on the Sun’s surface where the magnetic field lines pierce the surface of the Sun, and they’re relatively cooler than the surrounding areas.
  • Prominence – A bright feature that extends above the surface of the Sun, often in the shape of a loop.
  • Energetic particles – There can be energetic particles blasting off the surface of the Sun to create the solar wind. In solar storms, energetic protons can be accelerated to nearly the speed of light.
  • X-rays – In addition to the wavelengths we can see, there are invisible X-rays coming from the Sun, especially during flares. The Earth’s atmosphere protects us from this radiation.
  • Bright spots and short-lived magnetic regions – The surface of the Sun has many brighter and dimmer spots caused by changing temperature. The temperature changes from the constantly shifting magnetic field.

Yes, the Sun is like an onion. Peel back one layer and you’ll find many more. But in this case, each layers is responsible for a different function. And what they add to is a giant furnace and light source that keeps us living beings here on Earth warm and illuminated!

And be sure to enjoy this video from the NASA Goddard Center, titled “Snapshots from the Edge of the Sun”:

We have written many interesting articles about the Sun here at Universe Today. Here’s Ten Interesting Facts About the Sun, What Color is the Sun?, What is the Life Cycle of the Sun?, What Kind of Star is the Sun?, How Far is the Earth from the Sun?, and Could We Terraform the Sun?

For more information, check out NASA’s page on the Sun, and Sun Facts at Eight Planets.

Astronomy Cast also has an episode on the subject: Episode 320: The Layers of the Sun

Sources:

The Photon Sieve Could Revolutionize Optics

Scientists at NASA"s Goddard Space Flight Center are developing small, inexpensive optics to study the Sun's corona. Credit: NASA's GSFC, SDO AIA Team

Ever since astronomers first began using telescopes to get a better look at the heavens, they have struggled with a basic conundrum. In addition to magnification, telescopes also need to be able to resolve the small details of an object in order to help us get a better understanding of them. Doing this requires building larger and larger light-collecting mirrors, which requires instruments of greater size, cost and complexity.

However, scientists working at NASA Goddard’s Space Flight Center are working on an inexpensive alternative. Instead of relying on big and impractical large-aperture telescopes, they have proposed a device that could resolve tiny details while being a fraction of the size. It’s known as the photon sieve, and it is being specifically developed to study the Sun’s corona in the ultraviolet.

Basically, the photon sieve is a variation on the Fresnel zone plate, a form of optics that consist of tightly spaced sets of rings that alternate between the transparent and the opaque. Unlike telescopes which focus light through refraction or reflection, these plates cause light to diffract through transparent openings. On the other side, the light overlaps and is then focused onto a specific point – creating an image that can be recorded.

This image shows how the photon sieve brings red laser light to a pinpoint focus on its optical axis, but produces exotic diffraction patterns when viewed from the side. Credits: NASA/W. Hrybyk
Image showing the photon sieve bringing red laser light to a pinpoint focus on its optical axis, and producing exotic diffraction patterns. Credits: NASA/W. Hrybyk

The photon sieve operates on the same basic principles, but with a slightly more sophisticated twist. Instead of thin openings (i.e. Fresnel zones), the sieve consists of a circular silicon lens that is dotted with millions of tiny holes. Although such a device would be potentially useful at all wavelengths, the Goddard team is specifically developing the photon sieve to answer a 50-year-old question about the Sun.

Essentially, they hope to study the Sun’s corona to see what mechanism is heating it. For some time, scientists have known that the corona and other layers of the Sun’s atmosphere (the chromosphere, the transition region, and the heliosphere) are significantly hotter than its surface. Why this is has remained a mystery. But perhaps, not for much longer.

As Doug Rabin, the leader of the Goddard team, said in a NASA press release:

“This is already a success… For more than 50 years, the central unanswered question in solar coronal science has been to understand how energy transported from below is able to heat the corona. Current instruments have spatial resolutions about 100 times larger than the features that must be observed to understand this process.”

With support from Goddard’s Research and Development program, the team has already fabricated three sieves, all of which measure 7.62 cm (3 inches) in diameter. Each device contains a silicon wafer with 16 million holes, the sizes and locations of which were determined using a fabrication technique called photolithography – where light is used to transfer a geometric pattern from a photomask to a surface.

Doug Rabin, Adrian Daw, John O’Neill, Anne-Marie Novo-Gradac, and Kevin Denis are developing an unconventional optic that could give scientists the resolution they need to see finer details of the physics powering the sun’s corona. Other team members include Joe Davila, Tom Widmyer, and Greg Woytko, who are not pictured. Credits: NASA/W. Hrybyk
The Goddard team led by Doug Rabin (left) is working on a new optic device that will drastically reduce the size of telescopes. Credits: NASA/W. Hrybyk

However, in the long-run, they hope to create a sieve that will measure 1 meter (3 feet) in diameter. With an instrument of this size, they believe they will be able to achieve up to 100 times better angular resolution in the ultraviolet than NASA’s high-resolution space telescope – the Solar Dynamics Observatory. This would be just enough to start getting some answers from the Sun’s corona.

In the meantime, the team plans to begin testing to see if the sieve can operate in space, a process which should take less than a year. This will include whether or not it can survive the intense g-forces of a space launch, as well as the extreme environment of space. Other plans include marrying the technology to a series of CubeSats so a two-spacecraft formation-flying mission could be mounted to study the Sun’s corona.

In addition to shedding light on the mysteries of the Sun, a successful photon sieve could revolution optics as we know it. Rather than being forced to send massive and expensive apparatus’ into space (like the Hubble Space Telescope or the James Webb Telescope), astronomers could get all the high-resolution images they need from devices small enough to stick aboard a satellite measuring no more than a few square meters.

This would open up new venues for space research, allowing private companies and research institutions the ability to take detailed photos of distant stars, planets, and other celestial objects. It would also constitute another crucial step towards making space exploration affordable and accessible.

Further Reading: NASA