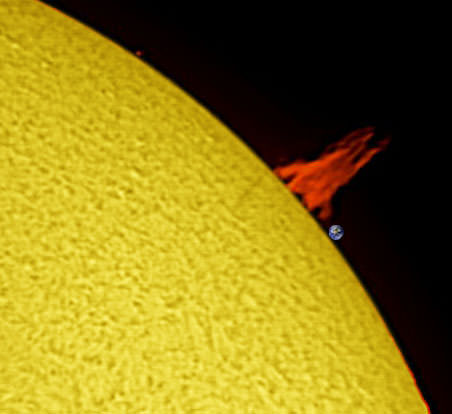
Compare the size of Eath to a prominence on the Sun on October 10, 2011. Credit: Ron Cottrell
[/caption]
The Sun is big. And comparatively, Earth is a tiny Lilliputian. We’ve all seen images comparing the size of Earth to the Sun, but here are two images from October 10, 2011 that really bring home the size-scale of features on the Sun when compared to the size of Earth. Amateur astronomer Ron Cottrell from Oro Valley, Arizona took these images of two different features on the the Sun yesterday, overlaying the size of the Earth for reference. Both are viewed in Hydrogen- Alpha light, and the first is a fiery-looking huge prominence from the northwest limb of the Sun. Yikes!
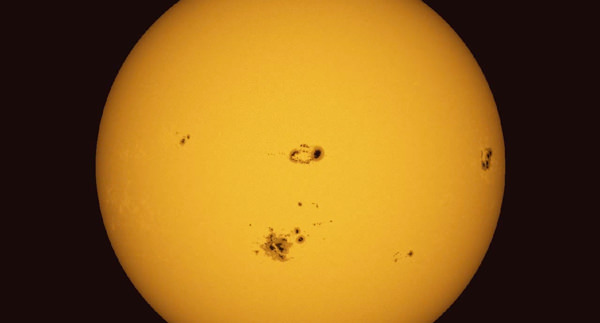
Below, see a comparison of Earth to a current sunspot:
The Earth compared to Sunspot 1312 on 10-10-11. Credit: Ron Cottrell.
This is sunspot 1312 which has a classic sunspot shape with a core a that’s larger than the Earth.
Ron used a 40mm Coronado telescope and a webcam to capture the images. He explains the colors of the Sun in Hydrogen-Alpha, and in particular why the prominence appears fiery red:
“The red color of the prominence is very close to the color collected in the image. The yellow disk is enhanced. I actually capture the disk image in black and white and add the color. I can choose any color. The final image is a composite of two separate images. Prominences are, in general, much fainter than the bright disk. Therefore, the prominence image is captured at a slower shutter speed, e.g. 1/25 sec, compared to the disk image captured at 1/100 sec. The two images are combined in PhotoShop.”
And speaking of the Sun, activity on our closest star has been ramping up and last week a series of active regions were lined up one after the other across the upper half of the Sun. Interestingly, the Solar Dynamics Observatory was able to capture how these regions twisted and interacted with each other. The video shows activity from Sept. 28 – Oct. 2, 2011, as seen in extreme UV light. The magnetically intense active regions sported coils of arcing loops and numerous times these magnetic field lines above them can be seen connecting with the active region next door. Towards the end of the clip, a leading active region blasted out a coronal mass ejection, quickly succeeded by a blast from another active region. The disruption of the magnetic field from one likely triggered the second, a phenomenon that has been observed before by SDO.
Stanford researchers have found a way to detect sunspots such as these two days before they reach the surface of the Sun. Image Credit: Thomas Hartlep
[/caption]
For solar enthusiasts, we’re all quite aware of sunspots and their implications. Able to disrupt power grids, shut down satellite communications and pose hazards to astronauts, these “cool” customers are revealing themselves ahead of their surface appearance. Thanks to the Michelson Doppler Imager aboard NASA’s Solar and Heliospheric Observatory satellite, known as SOHO, researchers were able to take 15 years of “sound” data from our nearest star… and develop a new technique for detecting sunspots before they emerge.
By combining information with NASA’s Solar Dynamics Observatory satellite, which carries the Helioseismic and Magnetic Imager, scientists have discovered a new method for detecting sunspots as deep as 65,000 kilometers below the solar surface. The areas of intense magnetic fields produce acoustic waves from the turbulence of plasma and gases. Near the surface, a convection cell echoes the information which travels back to the solar interior – only to be refracted again. By comparing their findings to seismic waves studied here on Earth, researchers measure the waves between points to predict anomalies.
Detection of Emerging Sunspot Regions – 18 August 2011: Movie showing the detected travel-time perturbations before the emergence of active region 10488 in the photosphere. The first 10 seconds of the movie show intensity observations of the Sun. The intensity later fades out and the photospheric magnetic field is shown. In the next 20 seconds, we zoom in to a region where a sunspot group would emerge. The upper layer shows magnetic field observations at the surface and the lower layer shows simultaneous travel-time perturbations, detected at a depth of about 60,000 km. After the emergence, intensity observations show the full development of this active region, until it rotates out of view on the west solar limb. (movie made by Thomas Hartlep) Courtesy of the Helioseismic and Magnetic Imager.
“We know enough about the structure of the Sun that we can predict the travel path and travel time of an acoustic wave as it propagates through the interior of the Sun,” said Junwei Zhao, a senior research scientist at Stanford’s Hansen Experimental Physics Lab. “Travel times get perturbed if there are magnetic fields located along the wave’s travel path.”
By comparing and measuring millions of pairs and points, researchers are able to pinpoint areas where sunspots are likely to happen. What they have discovered is larger spots rise to the surface faster than smaller ones… a prediction which can be made in approximately 24 hours. For less ominous appearances, lead times increase to up to two days.
“Researchers have suspected for a long time that sunspot regions are generated in the deep solar interior, but until now the emergence of these regions through the convection zone to the surface had gone undetected,” Ilonidis said. “We have now successfully detected them four times and tracked them moving upward at speeds between 1,000 and 2,000 kilometers per hour.”
The ultimate goal is to improve space weather forecasting. If events can be predicted three days prior, advance notice can be given and proper precautions taken.
Early Tuesday morning (August 9, 2011,) the Sun erupted with the largest solar flare of Cycle 24, registering as an X7-class flare. This flare had an X-ray magnitude of X6.9, meaning it was more than 3 times larger than the previous largest flare of this solar cycle – the X2.2 that occurred on Feb 15, 2011, NASA said. The source was Sunspot 1263 which is nearing the western limb of the Sun, and because of its location, scientists do not anticipate that this explosion will hit Earth directly. Therefore, the impact on communications and electric grids will likely (and luckily) be minimal. Continue reading “Sun Erupts with Largest Solar Flare of the Cycle”
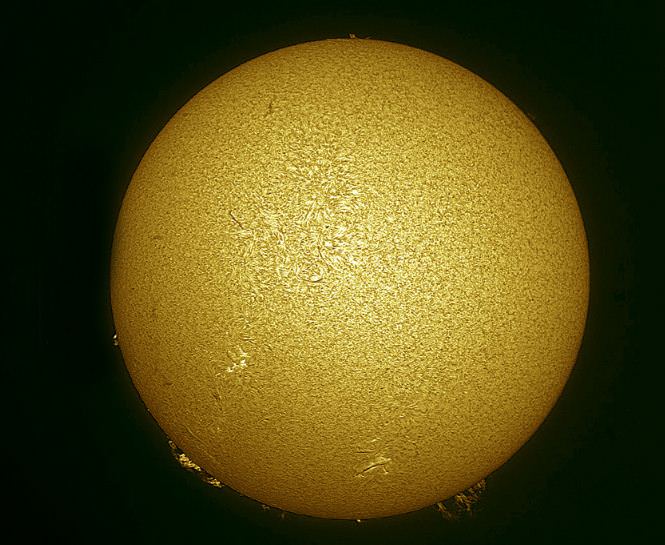
Our Sun on June 6, 2011. Credit: Credit: Cesar Cantu from the Chilidog Observatory in Monterrey, Mexico.
[/caption]
Are we headed into the 21st century version of the Maunder Minimum? Three researchers studying three different aspects of the Sun have all come up with the same conclusion: the Sun’s regular solar cycles could be shutting down or going into hibernation. A major decrease in solar activity is predicted to occur for the next solar cycle (cycle #25), and our current solar cycle (#24) could be the last typical one. “Three very different types of observations all pointing in the same direction is very compelling,” said Dr. Frank Hill from the National Solar Observatory, speaking at a press briefing today. “Cycle 24 may be the last normal one, and 25 may not even happen.”
Even though the Sun has been active recently as it heads towards solar maximum in 2013, there are three lines of evidence pointing to a solar cycle that may be going on hiatus. They are: a missing jet stream, slower activity near the poles of the sun and a weakening magnetic field, meaning fading sunspots. Hill, along with Dr. Richard Altrock from the Air Force Research Laboratory and Dr. Matt Penn from the National Solar Observatory independently studied the different aspects of the solar interior, the visible surface, and the corona and all concur that cycle 25, will be greatly reduced or may not happen at all.
Solar activity, including sunspot numbers, rises and falls on average about every 11 years – sometimes the cycles are as short as 9 years, other times it is as long as 13 years. The Sun’s magnetic poles reverse about every 22 years, so 11 years is half of that magnetic interval cycle.
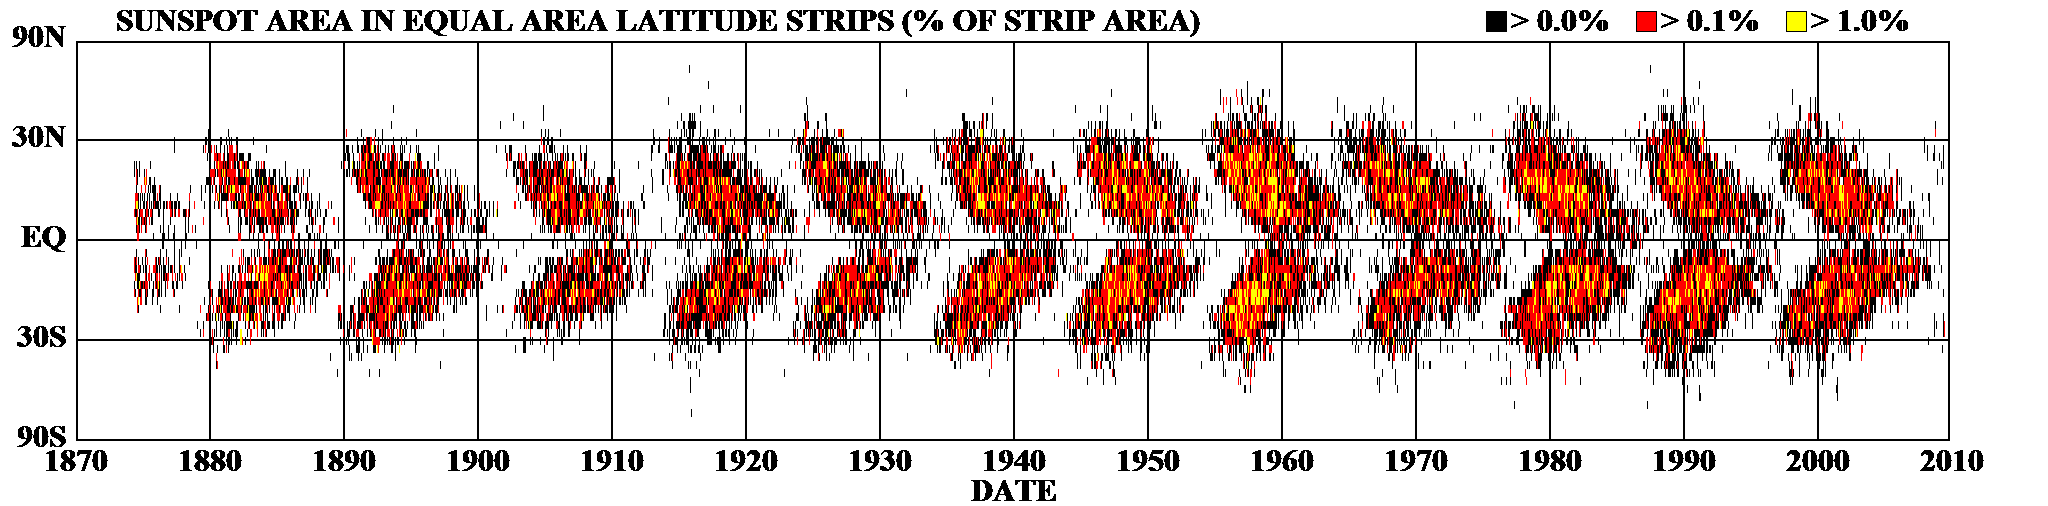
"Butterfly diagram" shows the position of sunspots over 12 solar cycles. Sunspots emerge over a range of latitudes centered on migratory jet streams that follow a clear pattern, trending from higher latitudes to lower latitudes on the Sun. The active latitudes are associated with mobile zonal flows or "jet streams" that vary through the cycle. Credit: SWRI
The first line of evidence is a slowing of a plasma flow inside the Sun, an east/west flow of gases under the surface of the Sun detected via seismology with spacecraft like the Solar Dynamics Observatory (SDO)or SOHO and also with the Global Oscillation Network Group (GONG) observing stations, a system that measures pulsations on the solar surface to understand the internal structure of the sun. The flow of plasma normally indicates the onset of sunspot formation for the next solar cycle. While this river ebbs and flows during the cycle, the “torsional oscillations,” — which starts at mid-latitudes and migrates towards the equator — and normally begins forming for the next solar cycle has not yet been detected.
Latitude-time plots of jet streams under the Sun's surface show the surprising shutdown of the solar cycle mechanism. New jet streams typically form at about 50 degrees latitude (as in 1999 on this plot) and are associated with the following solar cycle 11 years later. New jet streams associated with a future 2018-2020 solar maximum were expected to form by 2008 but are not present even now, indicating a delayed or missing Cycle 25. Credit: SWRI
Hill said the above graphic is key for understanding the issue. “The flow for Cycle 25 should have appeared in 2008 or 2009 but it has not and we see no sign of it,” he said. “This indicates that the start of Cycle 25 may be delayed to 2021 or 2022, with a minimum great that what we just experienced, or may not happen at all.”
Plots of coronal brightness against solar latitude show a "rush to the poles" that reflects the formation of subsurface shear in the solar polar regions. The current "rush to the poles" is delayed and weak, reflecting the lack of new shear under the photosphere. Note the graph depicts both north and south hemispheres overlaid into one map of solar magnetic activity, and that the patterns correspond with the butterfly diagram above. Credit: SWRI
The second line of evidence is slowing of the “rush to the poles,” the rapid poleward march of magnetic activity observed in the Sun’s faint corona. Altrock said the activity in the solar corona follows same oscillation pattern described by Hill, and that they have been observing the pattern for about 40 years. The researchers now see a very weak and slow pattern in this movement.
“A key thing to understand is that those wonderful, delicate coronal features are actually powerful, robust magnetic structures rooted in the interior of the Sun,” Altrock said. “Changes we see in the corona reflect changes deep inside the Sun.”
In a well-known pattern, new solar activity emerges first at about 70 degrees latitude at the start of a cycle, then towards the equator as the cycle ages. At the same time, the new magnetic fields push remnants of the older cycle as far as 85 degrees poleward. “In previous solar cycles, solar maximum occurred when the rush to the poles reached an average latitude of 76 degrees,” Altrock said. “Cycle 24 started out late and slow and may not be strong enough to create a rush to the poles, indicating we’ll see a very weak solar maximum in 2013, if at all. It is not clear whether solar max as we know it.”
Altrock added that if the “rush” doesn’t occur, no one knows what will happen in the future because no one has modeled what takes place without this rush to the poles.
Average magnetic field strength in sunspot umbras has been steadily declining for over a decade. The trend includes sunspots from Cycles 22, 23, and (the current cycle) 24. Credit: SWRI
The third line of evidence is a long-term weakening trend in the strength of sunspots. Penn, along with his colleague William Livingston predict that by Cycle 25, magnetic fields erupting on the Sun will be so weak that few if any sunspots will be formed.
Using more than 13 years of sunspot data collected at the McMath-Pierce Telescope at Kitt Peak in Arizona, Penn and Livingston observed that the average field strength declined about 50 gauss per year during Cycle 23 and now in Cycle 24. They also observed that spot temperatures have risen exactly as expected for such changes in the magnetic field. If the trend continues, the field strength will drop below the 1,500 gauss threshold and spots will largely disappear as the magnetic field is no longer strong enough to overcome convective forces on the solar surface.
“Things are erupting on the sun,” Penn said, “but they don’t have the energy to create sunspots.”
But back in 1645-1715 was the period known as the Maunder Minimum, a 70-year period with virtually no sunspots. The Maunder Minimum coincided with the middle – and coldest part – of the Little Ice Age, during which Europe and North America experienced bitterly cold winters. It has not been proven whether there is a causal connection between low sunspot activity and cold winters. However lower earth temperatures have been observed during low sunspot activity. If the researchers are correct in their predictions, will we experience a similar downturn in temperatures?
Hill said that some researchers say that the Sun’s activity can also play a role in climate change, but in his opinion, the evidence is not clear-cut. Altrock commented he doesn’t want to stick his neck out about how the Sun’s declining activity could affect Earth’s climate, and Penn added that Cycle 25 may provide a good opportunity to find out if the activity on the Sun contributes to climate change on Earth.
Lead image thanks to César Cantú in Monterrey, Mexico at the Chilidog Observatory. See more at his website, Astronomía Y Astrofotografía.
You can follow Universe Today senior editor Nancy Atkinson on Twitter: @Nancy_A. Follow Universe Today for the latest space and astronomy news on Twitter @universetoday and on Facebook.
The largest solar flare recorded in nearly five years was triggered by interactions between five rotating sunspots, say researchers who studied observations of the flaring region of the Sun taken by the Solar Dynamics Observatory over a period of five days. The flare occurred at 1.44am on February 15,2011, when the Sun released the largest recorded solar flare since December 2006 and the first flare of the current solar cycle to be classified as the most powerful “X-class”. Continue reading “Interacting Sunspots Spawn Gigantic Solar Flare”
The sunspot butterfly diagram. This modern version is constructed (and regularly updated) by the solar group at NASA Marshall Space Flight Center.
[/caption]
You’ll have to forgive my title. After writing so many articles as moderately as I could, I couldn’t help but engage in a bit of sensationalism of my own, especially in the interest of sarcasm. Although it’s not especially exciting that the sun has indeed been working for nearly two centuries (indeed, much longer than that), what is interesting is how using historical data, scientists have confirmed that process we see today have been relatively consistent since 1825.
The observations revolve around a familiar diagram known as the Butterfly diagram (pictured above). This diagram depicts the position of sunspots at various latitudes on the sun’s surface as time progresses. At the beginning of a cycle, sunspots start of at high latitudes and as the cycle progresses, appear at lower and lower latitudes until they disappear and the cycle repeats. The pattern formed resembles the wings of a butterfly, thereby giving the diagram its name.
Although sunspots have been observed as far back as 364 BC by Chinese astronomers, telescopic observations of them did not start until the early 1600’s. Continuous observation of the sun and its spots started in 1876 at the Royal Greenwich Observatory. There Edward Maunder recognized the pattern of sunspots and published them in the format that is the now famous Butterfly diagram in 1904. The diagram, as its usually shown only comprises data starting from around 1876 and continuing until present day. But the use of new records have extended the diagram back an additional 51 years, covering four new solar cycles. Although many observations exist with total sunspot counts, this new set of data includes detailed documentation of the position of the spots on the solar disc.
The observations were created by German astronomer Heinrich Schwabe. Originally an apothecary, he won a telescope in a lottery in 1825 and was fascinated, selling his family business four years later. Schwabe observed the Sun compulsively attempting to discover a new planet with an orbit interior to Mercury by witnessing it transiting the Sun. Although this effort was doomed to failure, Schwabe maintained detailed records of the sunspots. He even recognized the pattern of spots occurred in an 11 year cycle and published the discovery in 1843. It was met with little attention for several years until it was included in Alexander von Humboldt’s Kosmos. Due to this discovery, the 11 year solar cycle is also referred to as the Schwabe cycle.
From 1825 until 1867, Schwabe compiled at least 8468 observations of the Sun’s disc, drawn on 5cm circles. On his death, these documents, as well as the rest of his scientific works, were donated to the Royal Astronomical Society of London, and in 2009, were provided to a team of researchers for digitization. From the 8468 drawings, 7299 “have a coordinate system which is found to be aligned with the celestial equator” making them suitable for translation into scientific data.
Thus far, the team has converted 11% of the images into usable data and already, it has created a detailed butterfly diagram preceding those produced elsewhere. From it, the astronomers undertaking the conversion have made some interesting observations. The cycle beginning around 1834 was weaker than others around that time. The following one, starting around 1845, displayed a notable asymmetry where sunspots in the southern hemisphere were conspicuously lacking for the first 1-2 years of the cycle, whereas most cycles are fairly well mirrored. Although unusual, such phase shifts are not unprecedented. In fact, another study using historical records has demonstrated that, for the last 300 years, one hemisphere has always led (although not usually so greatly) for several cycles before trading off.
As with the recently discussed historical project on weather trends this reanalysis of historical data is one of many such projects giving us a broader picture of the trends we see today and how they have changed over time. While undoubtedly, many will be demonstrated to be mundane and familiar, undeserving of the exaggerated significance of my title, this is how science works: by expanding our knowledge to test our expectations.
NOTE: I’d Emailed the team asking for permission to show their image of the historical butterfly diagram, but since I haven’t gotten permission, I didn’t reproduce it here. But you can still view it in the paper. Go do so. It’s awesomely familiar.
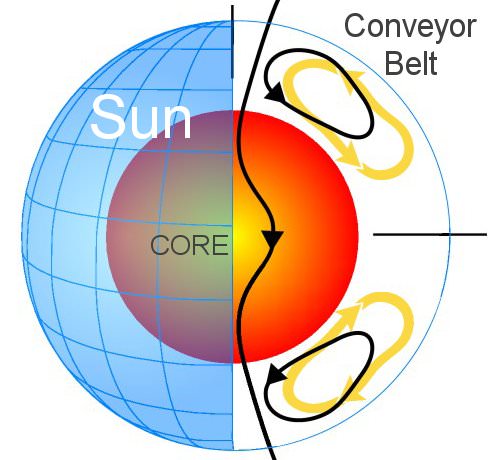
The conveyor belt of the Sun - a large flow of plasma that circulates under the surface - may be responsible for the duration of solar cycles. Image Credit: Science@NASA
[/caption]
The Sun seems to finally be waking up in earnest from the long slumber of the past cycle. Solar cycles tend to last on average about 11 years, but the last cycle – solar cycle 23 – was 12.5 years long. The cause of the most recent lull in the Sun’s activity is somewhat enigmatic, but it may be explained by the “conveyor belt” of plasma that circulates in the Sun’s chromosphere and photosophere. Just how far this conveyor belt of plasma extends underneath the Sun may heavily influence the duration of solar cycles.
In a recent paper published in Geophysical Research Letters, Dr. Mausumi Dikpati of the High Altitude Observatory National Center for Atmospheric Research in Boulder, Colorado and her team modeled data from the Mount Wilson Observatory for the duration of the last solar cycle. When they analyzed and modeled surface Doppler measurements of the flow of plasma currents that course underneath the surface of the Sun, they discovered that the flow extended all the way to the poles.
This is in contrast to data from previous, average-length solar cycles, in which the meridional plasma flow – or the Sun’s conveyor belt – flowed only to about 60 degrees latitude. This flow is not unlike thermohaline circulation here on Earth, in which the ocean transports heat around the globe.
Dr. Dikpati said in an email interview, “This is the first time that the Sun’s conveyor-belt has been measured accurately enough for two consecutive cycles (cycles 22 spanning approximately 1986-1996.5 and cycle 23 spanning 1996.5-2009). From these data we now know that cycle 22 had a shorter conveyor-belt reaching only to 60-degree latitude, while cycle 23 had a long conveyor-belt extending all the way to the pole.”
The cycles of the Sun are intricately linked to the magnetic field permeating our nearest star. Gigantic loops of the magnetic field of the Sun are what cause sunspots, and as the contours of the magnetic field change over the cycle of the Sun, more or fewer sunspots are seen, as well as solar flares and other activity. There is always a lack of sunspots between the cycles, but the minimum at the end of cycle 23 was unusually long.
The conveyor belt of plasma flowing in the chromosphere and photosphere essentially drags along with it the magnetic flux of the Sun. Because the extent of the conveyor belt reached a higher latitude, it took the magnetic flux longer to return to the equator, resulting in the delay of sunspots marking the onset of cycle 24.
Dr. Dikpati and her team determined that it wasn’t the speed of the flow of plasma conveyor belt that lengthened the solar cycle, but the extent into higher latitudes, and slower return to the equator. Though the speed of the conveyor belt was a bit higher than usual over the past five years, it also stretched much further than during a normal cycle.
Dr. Dikpati said of using data from previous solar cycles to better refine their model of the conveyor belt:
From the same data source (Mount Wilson data from Roger Ulrich) there is evidence of a short conveyor-belt in cycles 19, 20 and 21 also. All these cycles had periods (10.5 years) like cycle 22. Back beyond that we are hoping that others in the community will search for evidence of the latitudinal extent of the conveyor-belt in even earlier cycles. In fact, theory of the conveyor-belt in high-latitudes indicates that a shorter conveyor belt should be more common in the Sun, rather this long conveyor belt in cycle 23 may be the exception. There is already evidence from Mount Wilson data that, at the start of cycle 24, the conveyor-belt is shortening again, suggesting that cycle 24 is going to be more like cycles 19 – 22 in length.
By getting a better model of the interplay between the plasma flow and the Sun’s magnetic field, solar scientists may be able to better predict and explain the length of future and past solar cycles.
Dr. Dikpati said, “The conveyor belt also governs the memory of the Sun about its past magnetic features. This is an important ingredient for building prediction models for solar cycles.”
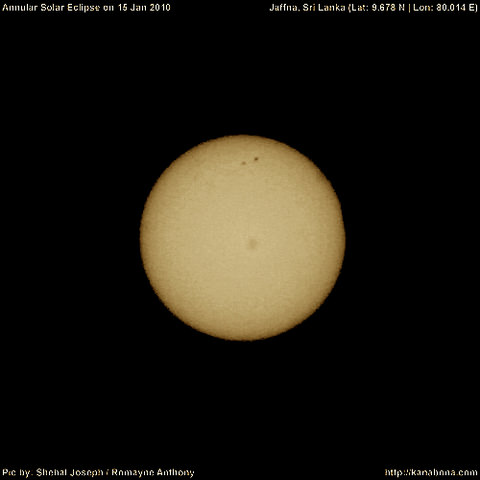
Sun sunspots show up during the recent annular eclipse. Credit: Shehal Joseph and Romayne Anthony
[/caption]
Astrophotographers capturing the recent annular solar eclipse on January 15, 2010 got an added bonus: upon closer inspection, they found sunspot 1040 also showed up on their images, too. “We didn’t mean to catch sunspots in our Jaffna Eclipse expedition, nor did we plan to,” said Prasanna Deshapriya, one of the members of the Eclipse Hunt 2010 crew, featured in our eclipse photo and video collection. “But surprisingly this is what really happened.”
SOHO image of sunspot 1040 on January 15, 2010. credit: SOHO/MDI
The rather big sunspot 1040, which was also captured by the SOHO spacecraft on Jan. 15 has just disappeared over the sun’s western limb, currently leaving the visible disk of the sun blank once again in this uncharacteristically long solar minimum. But our old friend, sunspot 1039 should be showing up soon, as the sun rotates around. We know it is still there, because the STEREO spacecraft can show us what is going on the sun’s far side. Sunspot 1039 should emerge for direct viewing from Earth within the next 48 hours. Spaceweather.com encourages those amateur astronomers with solar telescopes to monitor the Sun’s east limb for developments.
STEREO B captures the largest solar flare in two years. Click for larger movie.
Additionally on Jan. 19th at 1340 UT, STEREO-B recorded the strongest solar flare in almost two years. Click the image to see the action on an ultraviolet movie of the blast. The M2-class eruption came from sunspot 1039, so that sunspot is likely still very active.
Spaceweather.com said that considering the sunspot was not even visible from Earth at the time of the eruption, the flare was probably much stronger than its M2 classification would suggest. This active region has produced at least three significant eruptions since Jan. 17th and it shows no signs of cooling off.
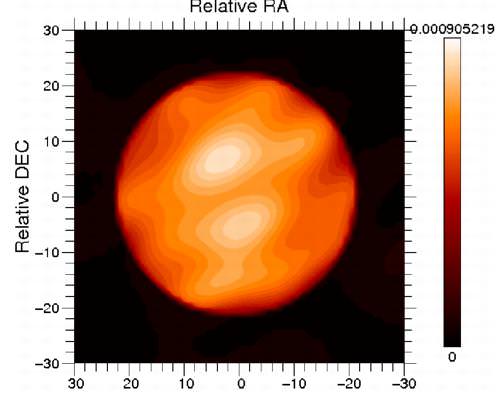
Caption:The surface of Betelgeuse in near infrared at 1.64 micron in wavelength, obtained with the IOTA interferometer (Arizona). The image has been re-constructed with two different algorithms, which yield the same details, of 9 milliarcseconds (mas). The star diameter is about 45 milliarcseconds. Credit: Copyright 2010 Haubois / Perrin (LESIA, Observatoire de Paris)
An international team of astronomers has obtained an unprecedented image of the surface of the red supergiant Betelgeuse, in the constellation Orion. The image reveals the presence of two giant bright spots, which cover a large fraction of the surface. Their size is equivalent to the Earth-Sun distance. This observation provides the first strong and direct indication of the presence of the convection phenomenon, transport of heat by moving matter, in a star other than the Sun. This result provides a better understanding of the structure and evolution of supergiants.
Betelgeuse is a red supergiant located in the constellation of Orion, and is quite different from our Sun. First, it is a huge star. If it were the center of our Solar System it would extend to the orbit of Jupiter. At 600 times larger than our Sun, it radiates approximately 100,000 times more energy. Additionally, with an age of only a few million years, the Betelgeuse star is already nearing the end of its life and is soon doomed to explode as a supernova. When it does, the supernova should be seen easily from Earth, even in broad daylight.
But we now know Betelgeuse has some similarities to the Sun, as it also has sunspots. The surface has bright and dark spots, which are actually regions that are hot and cold spots on the star. The spots appear due to convection, i.e., the transport of heat by matter currents. This phenomenon is observed every day in boiling water. On the surface of the Sun, these spots are rather well-known and visible. However, it is not at all the case for other stars and in particular supergiants. The size, physical characteristics, and lifetime of these dynamical structures remain unknown.
Betelgeuse is a good target for interferometry because its size and brightness make it easier to observe. Using simultaneously the three telescopes of the Infrared Optical Telescope Array (IOTA) interferometer on Mount Hopkins in Arizona (since removed), and the Paris Observatory (LESIA) the astronomers were able to obtain a numerous high-precision measurements. These made it possible to reconstruct an image of the star surface thanks to two algorithms and computer programs.
Two different algorithms gave the same image. One was created by Eric Thiebaut from the Astronomical Research Center of Lyon (CRAL) and the other was developed by Laurent Mugnier and Serge Meimon from ONERA. The final image reveals the star surface with unprecedented, never-before-seen details. Two bright spots clearly show up next to the center of the star.
The analysis of the brightness of the spots shows a variation of 500 degrees compared to the average temperature of the star (3,600 Kelvin). The largest of the two structures has a dimension equivalent
to the quarter of the star diameter (or one and a half the Earth-Sun distance). This marks a clear difference with the Sun where the convection cells are much finer and reach hardly 1/20th of the solar radius (a few Earth radii). These characteristics are compatible with the idea of luminous spots produced by convection. These results constitute a first strong and direct indication of the presence of convection on the surface of a star other than the Sun.
Convection could play an important role in the explanation of the mass-loss phenomenon and in the gigantic plume of gas that is expelled from Betelgeuse. The latter has been discovered by a team led by Pierre Kervella from Paris Observatory (read our article about this discovery). Convection cells are potentially at the origin of the hot gas ejections.
The astronomers say this new discovery provides new insights into supergiant stars, opening up a new field of research.
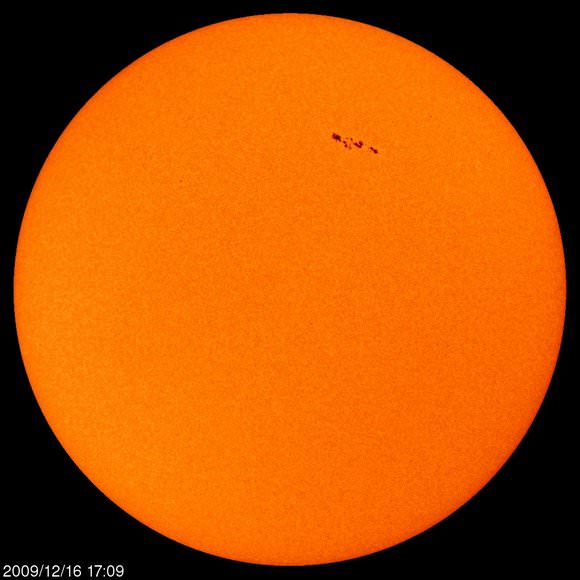
The current solar cycle (24) has been pretty boring, but a new sunspot — 1035 — is growing rapidly and now is seven times wider than Earth. Solar astronomers are predicting it could grow to be the largest sunspot of the year. There’s not been a lot of competition for the biggest sunspot, though: for 259 days (or 74%) of 2009, the sun has been spotless. But maybe the (solar) tide is turning. There’s been other action recently besides the new sunspot. A long-duration C4-class solar flare erupted this morning at 0120 UT from around the sunspot, which hurled a coronal mass ejection (CME) towards Earth. (See below for image of the CME that blasted off the sun on Dec. 14) Observers at high-latitude could see some aurora action when the CME arrives on or about Dec. 18th. Keep cheering; maybe the sun will come out of its doldrums.
CME on Dec. 14, 2009. Credit: NASA, SoHO
Remember, don’t look at the Sun directly to try and see the sunspot. NASA has a great site that gives real-time data and updated images of the Sun from SoHO (Solar and Heliospheric Observatory.) Or check out Spaceweather.com, which also provides updates. And if you have a safe way of observing and imaging the sunspot, feel free to post images here, or send to Nancy.


 and are associated with the following solar cycle 11 years later. New jet streams associated with a future 2018-2020 solar maximum were expected to form by 2008 but are not present even now, indicating a delayed or missing Cycle 25. Credit: SWRI")

 24. Credit: SWRI")