
It’s eclipse season for the Solar Dynamics Observatory! Twice a year near each equinox, the orbital dynamics lines up so that from SDO’s vantage point, the Earth passes between SDO and the Sun. Eclipse season lasts for about three weeks and each eclipse can last up to 72 minutes in the middle of an eclipse season. This current eclipse season started on September 11 and lasts until October 4. There’s no way to avoid the loss of images, the SDO team says, but the continuous contact with the ground station SDO’s orbit allows was judged to outweigh the loss of some images.
Something New On the Sun: SDO Spots a Late Phase in Solar Flares
The Sun’s surface dances. Giant loops of magnetized solar material burst up, twist, and fall back down. Some erupt, shooting radiation flares and particles out into space. Forced to observe this dance from afar, scientists use all the tools at their disposal to look for patterns and connections to discover what causes these great explosions. Mapping these patterns could help scientists predict the onset of space weather that bursts toward Earth from the Sun, interfering with communications and Global Positioning System (GPS) signals.
Analysis of 191 solar flares since May 2010 by NASA’s Solar Dynamics Observatory (SDO) has recently shown a new piece in the pattern: some 15 percent of the flares have a distinct “late phase flare” some minutes to hours later that has never before been fully observed. This late phase of the flare pumps much more energy out into space than previously realized.
“We’re starting to see all sorts of new things,” says Phil Chamberlin, deputy project scientist for SDO at NASA’s Goddard Space Flight Center in Greenbelt, Md. “We see a large increase in emissions a half-hour to several hours later, that is sometimes even larger than the original, traditional phases of the flare. In one case on November 3, 2010, measuring only the effects of the main flare would mean underestimating the amount of energy shooting into Earth’s atmosphere by 70 percent.”
The entire space weather system, from the Sun’s surface to the outer edges of the solar system, is dependent on how energy transfers from one event to another – magnetic reconnection near the Sun transferred to movement energy barreling across space to energy deposited into Earth’s atmosphere, for example. Better understanding of this late phase flare will help scientists quantify just how much energy is produced when the sun erupts.
The team found evidence for these late phases when SDO first began collecting data in May of 2010 and the Sun decided to put on a show. In that very first week, in the midst of an otherwise fairly quiet time for the sun, there sprouted some nine flares of varying sizes. Flare sizes are divided into categories, named A, B, C, M and X, that have long been defined by the intensity of the X-rays emitted at the flare’s peak as measured by the GOES (Geostationary Operational Environmental Satellite) satellite system. GOES is a NOAA-operated network of satellites that has been in geosynchronous orbit near Earth since 1976. One of the GOES satellites measures only X-ray emissions and is a crucial source of information on space weather that the sun sends our way.
That May 2010, however, SDO observed those flares with its multi-wavelength vision. It recorded data indicating that some other wavelengths of light weren’t behaving in sync with the X-rays, but peaked at other times.
“For decades, our standard for flares has been to watch the x-rays and see when they peak,” says Tom Woods, a space scientist at the University of Colorado, Boulder, Colo. who is first author on a paper on this subject that goes online September 7 in the Astrophysical Journal. “That’s our definition for when a flare goes off. But we were seeing peaks that didn’t correspond to the X-rays.” Woods says that at first they were worried the data were an anomaly or a glitch in the instruments. But as they confirmed the data with other instruments and watched the patterns repeat over many months, they began to trust what they were seeing. “And then we got excited,” he says.
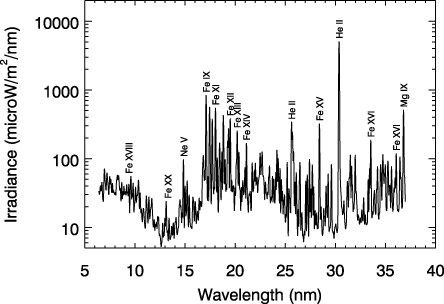
Over the course of a year, the team used the EVE (for Extreme ultraviolet Variability Experiment) instrument on SDO to record data from many more flares. EVE doesn’t snap conventional images. Woods is the principal investigator for the EVE instrument and he explains that it collects all the light from the sun at once and then precisely separates each wavelength of light and measures its intensity. This doesn’t produce pretty pictures the way other instruments on SDO do, but it provides graphs that map out how each wavelength of light gets stronger, peaks, and diminishes over time. EVE collects this data every 10 seconds, a rate guaranteed to provide brand new information about how the sun changes, given that previous instruments only measured such information every hour and a half or didn’t look at all the wavelengths simultaneously – not nearly enough information to get a complete picture of the heating and cooling of the flare.
[/caption]
Recording extreme ultraviolet light, the EVE spectra showed four phases in an average flare’s lifetime. The first three have been observed and are well established. (Though EVE was able to measure and quantify them over a wide range of light wavelengths better than has ever been done.) The first phase is the hard X-ray impulsive phase, in which highly energetic particles in the sun’s atmosphere rain down toward the sun’s surface after an explosive event in the atmosphere known as magnetic reconnection. They fall freely for some seconds to minutes until they hit the denser lower atmosphere, and then the second phase, the gradual phase, begins. Over the course of minutes to hours, the solar material, called plasma, is heated and explodes back up, tracing its way along giant magnetic loops, filling the loops with plasma. This process sends off so much light and radiation that it can be compared to millions of hydrogen bombs.
The third phase is characterized by the Sun’s atmosphere — the corona –losing brightness, and so is known as the coronal dimming phase. This is often associated with what’s known as a coronal mass ejection, in which a great cloud of plasma erupts off the surface of the Sun.
But the fourth phase, the late phase flare, spotted by EVE was new. Anywhere from one to five hours later for several of the flares, they saw a second peak of warm coronal material that didn’t correspond to another X-ray burst.
“Many observations have spotted an increased extreme ultraviolet peak just seconds to minutes after the main phase of the flare, and this behavior is considered a normal part of the flare process. But this late phase is different,” says Goddard’s Chamberlin, who is also a co-author on the paper. “These emissions happen substantially later. And it happens after the main flare exhibits that initial peak.”
To try to understand what was happening, the team looked at the images collected from SDO’s Advanced Imaging Assembly (AIA) as well. They could see the main phase flare eruption in the images and also noticed a second set of coronal loops far above the original flare site. These extra loops were longer and become brighter later than the original set (or the post-flare loops that appeared just minutes after that). These loops were also physically set apart from those earlier ones.
“The intensity we’re recording in those late phase flares is usually dimmer than the X-ray intensity,” says Woods. “But the late phase goes on much longer, sometimes for multiple hours, so it’s putting out just as much total energy as the main flare that typically only lasts for a few minutes.” Because this previously unrealized extra source of energy from the flare is equally important to impacting Earth’s atmosphere, Woods and his colleagues are now studying how the late phase flares can influence space weather.
The late phase flare is, of course, just one piece of the puzzle as we try to understand the star with which we live. But keeping track of the energy, measuring all the different wavelengths of light, using all the instruments NASA has at its disposal, such information helps us map out all the steps of the Sun’s great dance.
Sun Erupts with Spectacular Flares
The Sun sent two flares yesterday from active region 1283. This video shows the second flare, at 6:12 p.m. EDT (2212 GMT) on Tuesday an even bigger flare than the M-class flare from early on Sept. 6, at about 0150 GMT. This was an X-class flare, major events that can trigger planet-wide radio blackouts and long-lasting radiation storms. The latest update says the CMEs could sail north of Earth, delivering a glancing blow to Earth’s magnetic field, and could arrive between September 8 -10. Spaceweather.com says high-latitude sky watchers should be alert for auroras in the nights ahead.
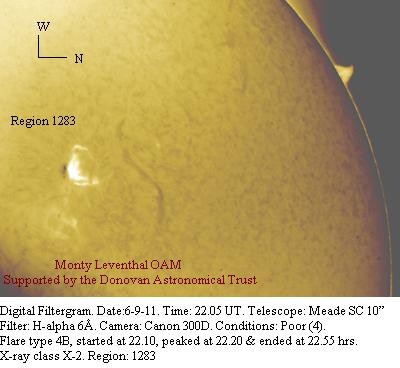
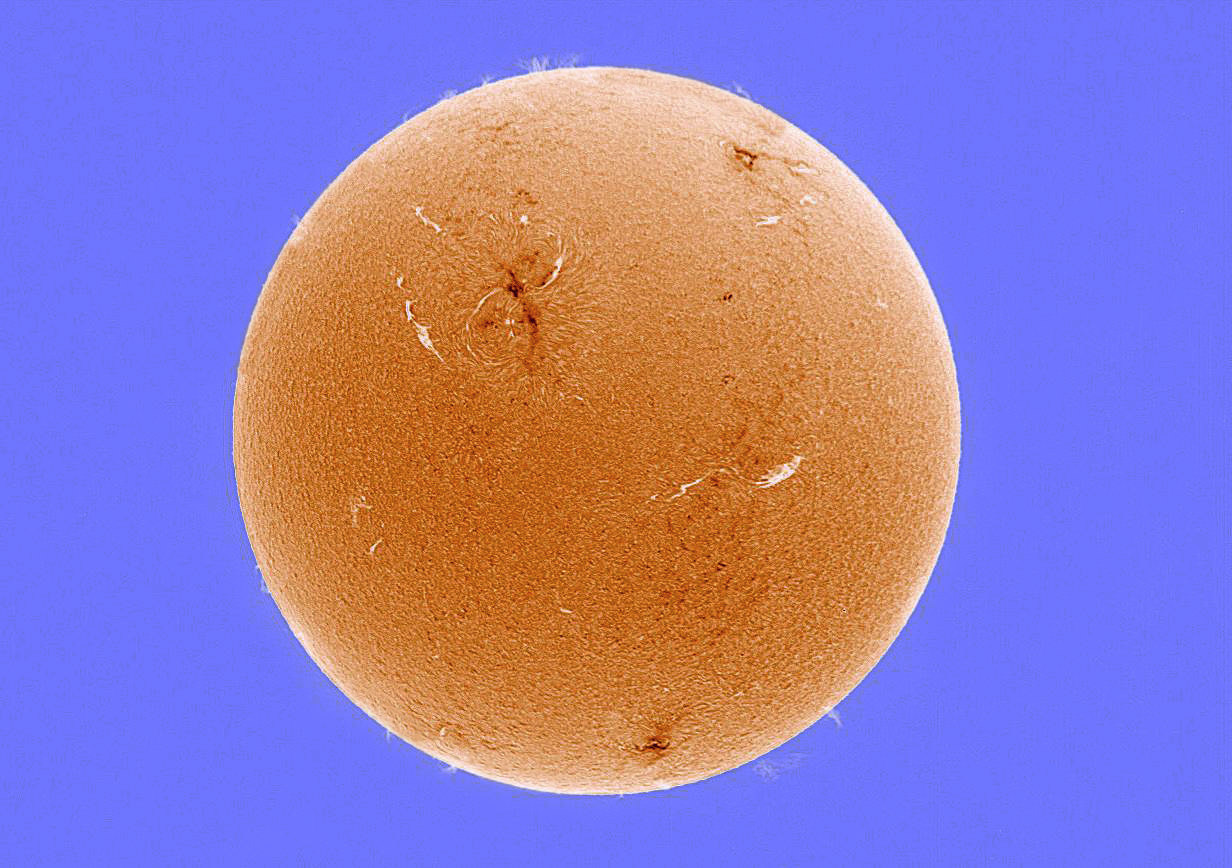
The image below was sent in to Universe Today by Monty Leventhal showing the type 4B Flare with an X-ray class of X-2 in active region 1283.
[/caption]
Here are the details and equipment Monty used:
Date:- 6-9-11
Time:- 22.05 U.T.
Conditions:- Poor
Camera:- Canon 300D
Filter:- H-alpha. 6Å.
Telescope:- Meade S.C. 10 inch
Enhanced Technique for Tracking Solar Storms All the Way From Sun to Earth
Heliophysicists announced today that new data processing techniques have enabled them to track solar storms from their origin in the Sun’s fiery corona all the way to impact with the Earth in unprecedented detail. “For the first time we’ve been able to image a coronal mass ejection all the way through its entire life cycle, from inside the solar corona until it reaches Earth,” said Craig DeForest, speaking at a NASA press briefing. DeForest is the lead author paper published in the Astrophysical Journal.
Continue reading “Enhanced Technique for Tracking Solar Storms All the Way From Sun to Earth”
SDO’s Guide to Solar Flares
X-Class, M-Class, C-Class… What does it all that mean, and just what is a solar flare? This video from the Solar Dynamics Observatory tells all about solar flares and how they might affect us here on Earth. Find out why NASA and NOAA are constantly monitoring the Sun for activity that could create long lasting radiation storms which can harm satellites, communications systems, and even ground-based technologies and power grids.
Sun Erupts with Largest Solar Flare of the Cycle
Early Tuesday morning (August 9, 2011,) the Sun erupted with the largest solar flare of Cycle 24, registering as an X7-class flare. This flare had an X-ray magnitude of X6.9, meaning it was more than 3 times larger than the previous largest flare of this solar cycle – the X2.2 that occurred on Feb 15, 2011, NASA said. The source was Sunspot 1263 which is nearing the western limb of the Sun, and because of its location, scientists do not anticipate that this explosion will hit Earth directly. Therefore, the impact on communications and electric grids will likely (and luckily) be minimal.
Continue reading “Sun Erupts with Largest Solar Flare of the Cycle”
Solar Storm Heading Our Way
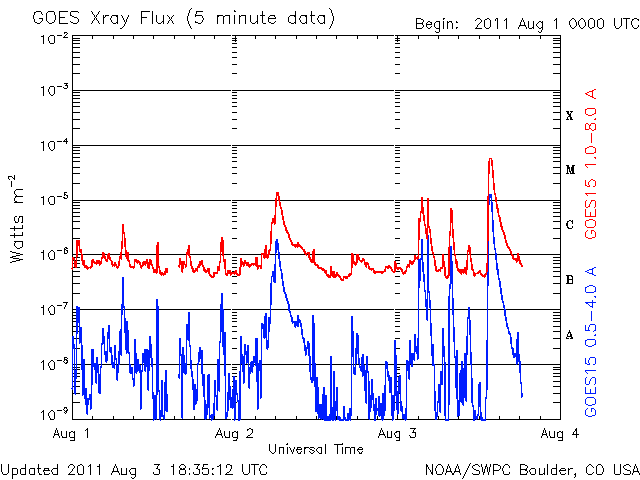
Early today, (Aug 3, 2011) two active regions on the Sun, sunspot 1261 and 1263 unleashed solar flares, which was captured by NASA’s Solar Dynamics Observatory. The above video shows an M6 class flare from 1261 in a couple of different wavelengths. SolarstormWatch, a citizen science project through the Royal Observatory in Greenwich, England predicts the solar storm from the larger flare to reach Earth at 15:00 UTC on August 5, 2011, and also predict direct hit on Earth.
See below for a graph of the activity:
[/caption]
Solar storms are a concern if they hit Earth directly since under the right conditions, they can create extra electrical currents in Earth’s magnetosphere. The electrical power grid is vulnerable to any extra currents, which can infiltrate high-voltage transmission lines, causing transformers to overheat and possibly burn out.
Check SpaceWeather.com and the National Weather Service’s Space Weather Prediction Center for more information.
Activity Heating Up on the Sun!
[/caption]
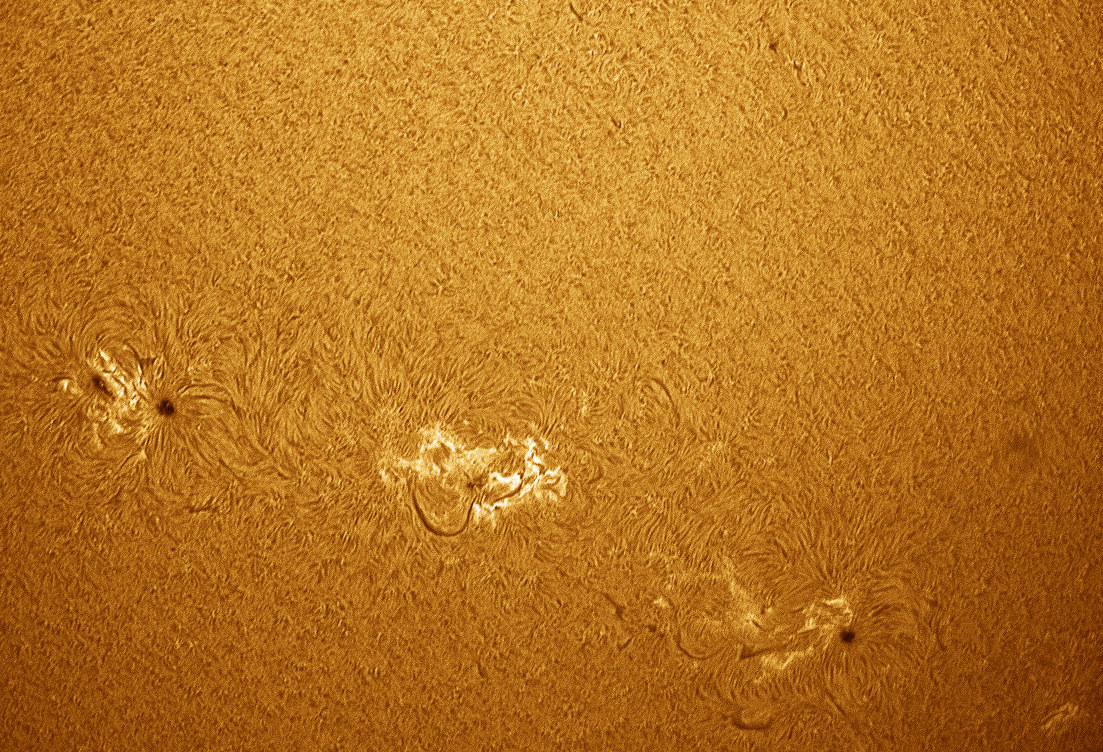
The summer Sun (for us in the northern hemisphere) is getting active! Here are images and videos of recent activity, which include sunspots and an M-class flare. Above is a close-up look at four active regions taken by César Cantú from the Chilidog Observatory in Monterrey, Mexico.
Below, see a strong but brief M9-class solar flare which occurred on July 31, 2011 from Active Region 1261, captured by the Solar Dynamics Observatory. Scientists from SDO say that because it was brief it appears not to have hurled a large coronal mass ejection (CME) outwards.

Here’s a comparative look at the sunspots from August 1, 2011, taken by César Cantú from the Chilidog Observatory in Mexico. “Taking advantage of the program that I could attach Lucam Recorder in AVI (video) different bands of light, here is this comparative look in negative, white light, the calcium band and hydrogen-alpha band,” said Cantú. He used a 90 Coronado telescope and camera with dual ektalon DMK41.
See more at the Chilidog Observatory website, Astronomía Y Astrofotografía.
Here’s a video clip from SDO showing an interesting alignment of three good-sized sunspot groups that appear to be marching across the Sun, taken July 28-29, 2011.
See more, and keep up with all the activity on the Sun at the SDO website.
SDO Finds the Man in the Sun
We all know about the Man in the Moon, but the Solar Dynamics Observatory spacecraft has now detected an old man in the Sun, too. He was there, at least back on Dec. 9, 2010 when these images were taken, but has since disappeared. In different wavelengths, at times he appears happy, mischievous or even downright angry.
The movie underscores the fact that images taken at different wavelengths do reveal different features. The different wavelengths are shown in order from the lowest temperature material being imaged to the highest. The images also start at the Sun’s surface and gradually move out to the Sun’s upper corona.
SDO never fails to inform as well as amuse!
Awesome Astrophotos: A Negative Sun
[/caption]
Here’s an unusual if not stunning way to look at the Sun: César Cantu from the Chilidog Observatory in Mexico has taken a few images of the Sun, and reversed the colors, or made a negative. This increases the contrast and allows structures to be seen — or at least stand out — that otherwise are not visible.
“The picture is made under normal procedure,” César tells us. He creates an Avi file, then reverses the colors, and also applies false color, leaving the sky to look blue and the Sun to yellow-orange and the chromosphere as red. “This is to delight the author!” César says.
The solar prominences, in all sorts of shapes and sizes, really stand out.
Below, you can see a comparison of “normal” image which has then been “negativised.”

Thanks to César for sharing his stunning images. See more at his website, Astronomía Y Astrofotografía.