An image of debris, ejected from Cabeus crater and into the sunlight, about 20 seconds after the LCROSS impact. The inset shows a close-up with the direction of the sun and the Earth. Image courtesy of Science/AAAS
An image of water-filled debris ejected from Cabeus crater about 20 seconds after the 2009 LCROSS impact. Courtesy of Science/AAAS.
Comets? Asteroids? The Earth? The origins of water now known to exist within the Moon’s soil — thanks to recent observations by various lunar satellites and the impact of the LCROSS mission’s Centaur rocket in 2009 — has been an ongoing puzzle for scientists. Now, new research supports that the source of at least some of the Moon’s water is the Sun, with the answer blowing in the solar wind.
Spectroscopy research conducted on Apollo samples by a team from the University of Tennessee, University of Michigan and Caltech has revealed “significant amounts” of hydroxyl within microscopic glass particles found inside lunar soil, the results of micrometeorite impacts.
According to the research team, the hydroxyl “water” within the lunar glass was likely created by interactions with protons and hydrogen ions from the solar wind.
“We found that the ‘water’ component, the hydroxyl, in the lunar regolith is mostly from solar wind implantation of protons, which locally combined with oxygen to form hydroxyls that moved into the interior of glasses by impact melting,” said Youxue Zhang, Professor of Geological Sciences at the University of Michigan.
Hydroxyl is the pairing of a single oxygen atom to a single hydrogen atom (OH). Each molecule of water contains two hydroxyl groups.
Although such glass particles are widespread on the surface of the Moon — the researchers studied samples returned from Apollo 11, Apollo 16 and Apollo 17 missions — the water in hydroxyl form is not something that could be easily used by future lunar explorers. Still, the findings suggest that solar wind-derived hydroxyl may also exist on the surface of other airless worlds, like Mercury, Vesta or Eros… especially within permanently-shadowed craters and depressions.
“These planetary bodies have very different environments, but all have the potential to produce water,” said Yang Liu, University of Tennessee scientist and lead author of the team’s paper.
The discovery of hydroxyl within lunar glasses presents an “unanticipated, abundant reservoir” of water on the Moon, and possibly throughout the entire Solar System.
The study was published online Sunday in the journal Nature Geoscience.
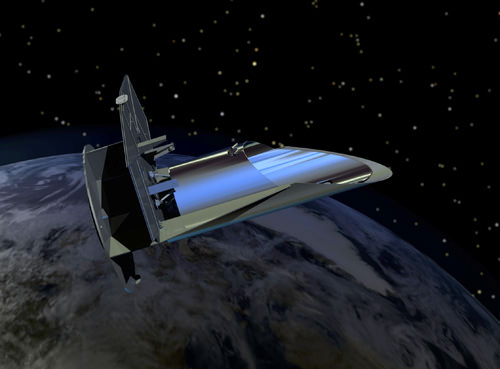
FINESSE would observe exoplanets from a position in low-Earth orbit (NASA/JPL-Caltech)
Jet Propulsion Laboratory’s proposed FINESSE space telescope may not hunt for exoplanets, but it will find out what they’re made of.
Part of NASA’s Explorers program, FINESSE — which stands for (take a deep breath) Fast INfrared Exoplanet Spectroscopy Survey Explorer — would gather spectroscopic data from 200 known exoplanets over a two-year period, helping scientists to determine the composition of their atmospheres, surfaces, and even their weather.
While huge discoveries have been made by both ground- and space-based telescopes like Kepler and Corot over the past several years, identifying thousands of exoplanetary candidates, FINESSE will be the first mission dedicated to finding out what the atmospheres are like on worlds outside our solar system.
Using a sensitive spectrograph covering 0.7-5.0 microns, FINESSE will be able to identify molecular bands of water, methane, carbon monoxide, carbon dioxide, and other molecules. Its sensitivity and stability will even allow it to detect the differences between an exoplanet’s day and night side, allowing wind flow and weather to be determined.
Known as an Offner spectrometer, the design of the FINESSE detector is derived from the Moon Mineralogy Mapper instrument, which was designed at JPL and flew to the Moon aboard India’s Chandrayaan-1 spacecraft.
[/caption]
Touted as “the next step” in exoplanetary exploration, FINESSE is proposed for launch in October 2016.
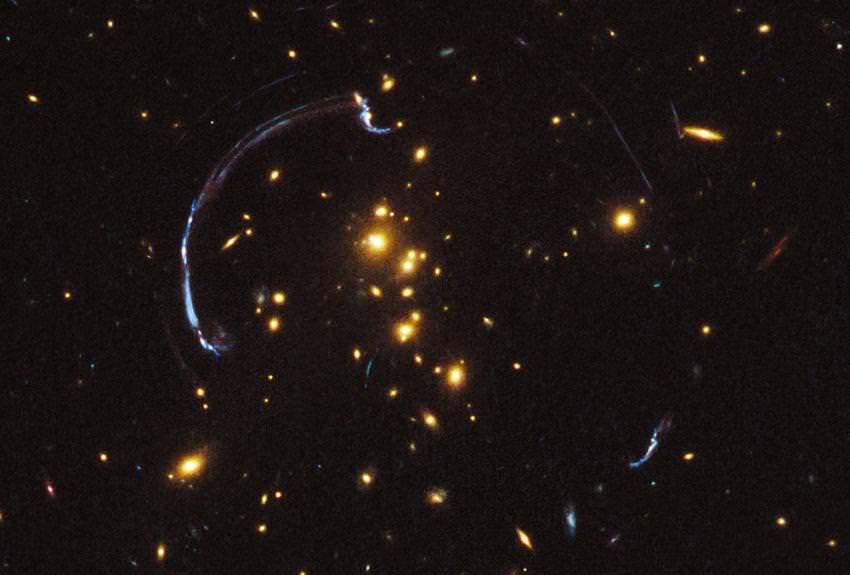
Thanks to the presence of a natural "zoom lens" in space, this is a close-up look at the brightest distant "magnified" galaxy in the universe known to date. Credit: NASA, ESA, J. Rigby (NASA Goddard Space Flight Center), K. Sharon (Kavli Institute for Cosmological Physics, University of Chicago), and M. Gladders and E. Wuyts (University of Chicago)
[/caption]
Less than a year ago, the Hubble Space Telescope’s Wide Field Camera 3 captured an amazing image – a giant lensed galaxy arc. Gravitational lensing produces a natural “zoom” to observations and this is a look at one of the brightest distant galaxies so far known. Located some 10 billion light years away, the galaxy has been magnified as a nearly 90-degree arc of light against the galaxy cluster RCS2 032727-132623 – which is only half the distance. In this unusual case, the background galaxy is over three times brighter than typically lensed galaxies… and a unique look back in time as to what a powerful star-forming galaxy looked like when the Universe was only about one third its present age.
A team of astronomers led by Jane Rigby of NASA’s Goddard Space Flight Center in Greenbelt, Maryland are the parties responsible for this incredible look back into time. It is one of the most detailed looks at an incredibly distant object to date and their results have been accepted for publication in The Astrophysical Journal, in a paper led by Keren Sharon of the Kavli Institute for Cosmological Physics at the University of Chicago. Professor Michael Gladders and graduate student Eva Wuyts of the University of Chicago were also key team members.
“The presence of the lens helps show how galaxies evolved from 10 billion years ago to today. While nearby galaxies are fully mature and are at the tail end of their star-formation histories, distant galaxies tell us about the universe’s formative years. The light from those early events is just now arriving at Earth.” says the team. “Very distant galaxies are not only faint but also appear small on the sky. Astronomers would like to see how star formation progressed deep within these galaxies. Such details would be beyond the reach of Hubble’s vision were it not for the magnification made possible by gravity in the intervening lens region.”
This graphic shows a reconstruction (at lower left) of the brightest galaxy whose image has been distorted by the gravity of a distant galaxy cluster. The small rectangle in the center shows the location of the background galaxy on the sky if the intervening galaxy cluster were not there. The rounded outlines show distinct, distorted images of the background galaxy resulting from lensing by the mass in the cluster. The image at lower left is a reconstruction of what the lensed galaxy would look like in the absence of the cluster, based on a model of the cluster's mass distribution derived from studying the distorted galaxy images. Illustration Credit: NASA, ESA, and Z. Levay (STScI) Science Credit: NASA, ESA, J. Rigby (NASA Goddard Space Flight Center), K. Sharon (Kavli Institute for Cosmological Physics, University of Chicago), and M. Gladders and E. Wuyts (University of Chicago)
But the Hubble isn’t the only eye on the sky examining this phenomenon. A little over 10 years ago a team of astronomers using the Very Large Telescope in Chile also measured and examined the arc and reported the distant galaxy seems to be more than three times brighter than those previously discovered. However, there’s more to the picture than meets the eye. Original images show the magnified galaxy as hugely distorted and it shows itself more than once in the foreground lensing cluster. The challenge was to create a image that was “true to life” and thanks to Hubble’s resolution capabilities, the team was able to remove the distortions from the equation. In this image they found several incredibly bright star-forming regions and through the use of spectroscopy, they hope to better understand them.
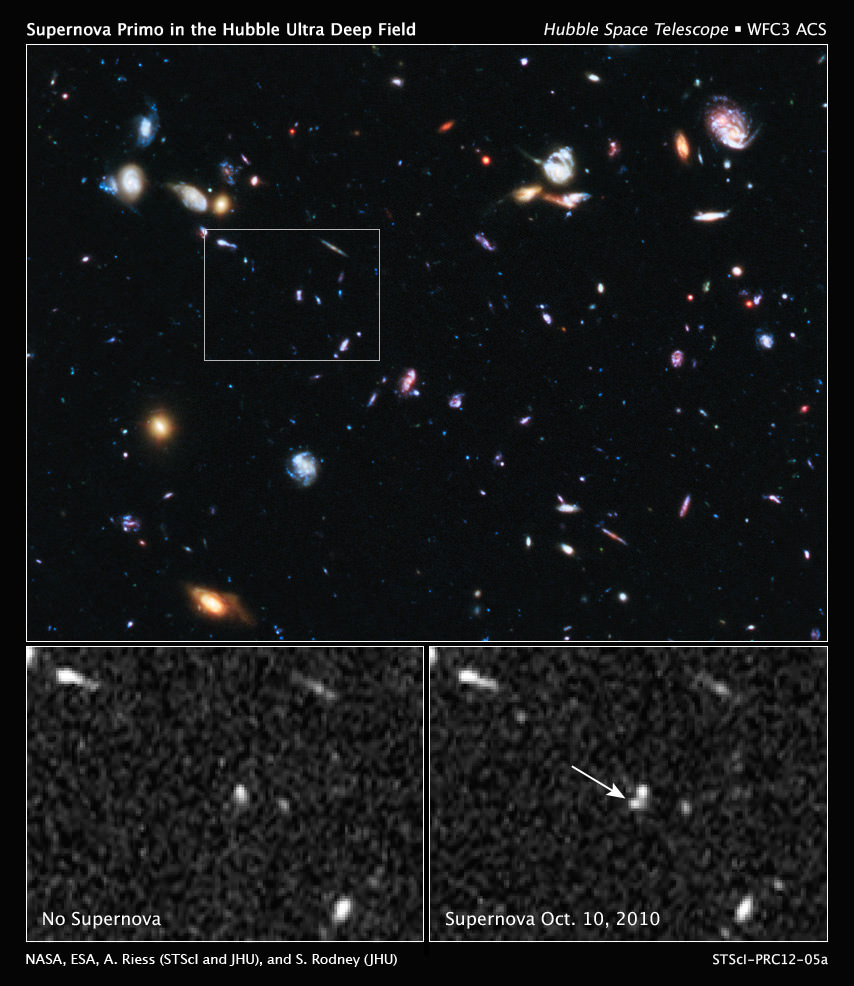
The top image shows part of the Hubble Ultra Deep Field, the region where astronomers were looking for a supernova blast. The white box pinpoints the area where the supernova is later seen. The image combines observations taken in visible and near-infrared light with the Advanced Camera for Surveys and the Wide Field Camera 3. The image at bottom left, taken by the Wide Field Camera 3, is a close-up of the field without the supernova. A new bright object, identified as the supernova, appears in the Wide Field Camera 3 image at bottom right. Credit: NASA, ESA, A. Riess (Space Telescope Science Institute and The Johns Hopkins University), and S. Rodney (The Johns Hopkins University)
[/caption]
Its nickname is SN Primo and it’s the farthest Type Ia supernova to have its distance spectroscopically confirmed. When the progenitor star exploded some 9 billion years ago, Primo sent its brilliant beacon of light across time and space to be captured by the Hubble Space Telescope. It’s all part and parcel of a three-year project dealing specifically with Type Ia supernovae. By splitting its light into constituent colors, researchers can verify its distance by redshift and help astronomers better understand not only the expanding Universe, but the constraints of dark energy.
“For decades, astronomers have harnessed the power of Hubble to unravel the mysteries of the Universe,” said John Grunsfeld, associate administrator for NASA’s Science Mission Directorate in Washington. “This new observation builds upon the revolutionary research using Hubble that won astronomers the 2011 Nobel Prize in Physics, while bringing us a step closer to understanding the nature of dark energy which drives the cosmic acceleration.”
Type Ia supernovae are theorized to have originated from white dwarf stars which have collected an excess of material from their companions and exploded. Because of their remote nature, they have been used to measure great distances with acceptable accuracy. Enter the CANDELS+CLASH Supernova Project… a type of census which utilizes the sharpness and versatility of Hubble’s Wide Field Camera 3 (WFC3) to aid astronomers in the search for supernovae in near- infrared light and verify their distance with spectroscopy. CANDELS is the Cosmic Assembly Near-infrared Deep Extragalactic Legacy Survey and CLASH is the Cluster Lensing and Supernova Survey with Hubble.
“In our search for supernovae, we had gone as far as we could go in optical light,” said Adam Riess, the project’s lead investigator, at the Space Telescope Science Institute and The Johns Hopkins University in Baltimore, Md. “But it’s only the beginning of what we can do in infrared light. This discovery demonstrates that we can use the Wide Field Camera 3 to search for supernovae in the distant Universe.”
However, discovering a supernova like Primo just doesn’t happen overnight. It took the research team several months of work and a huge amount of near-infrared images to locate the faint signature. After capturing the elusive target in October 2010, it was time to employ the WFC3’s spectrometer to validate SN Primo’s distance and analyze the spectra for confirmation of a Type Ia supernova event. Once verified, the team continued to image SN Primo for the next eight months – collecting data as it faded away. By engaging the Hubble in this type of census, astronomers hope to further their understanding of how such events are created. If they should discover that Type Ia supernova don’t always appear the same, it may lead to a way of categorizing those changes and aid in measuring dark energy. Riess and two other astronomers shared the 2011 Nobel Prize in Physics for discovering dark energy 13 years ago, using Type Ia supernova to plot the Universe’s expansion rate.
“If we look into the early Universe and measure a drop in the number of supernovae, then it could be that it takes a long time to make a Type Ia supernova,” said team member Steve Rodney of The Johns Hopkins University. “Like corn kernels in a pan waiting for the oil to heat up, the stars haven’t had enough time at that epoch to evolve to the point of explosion. However, if supernovae form very quickly, like microwave popcorn, then they will be immediately visible, and we’ll find many of them, even when the Universe was very young. Each supernova is unique, so it’s possible that there are multiple ways to make a supernova.”
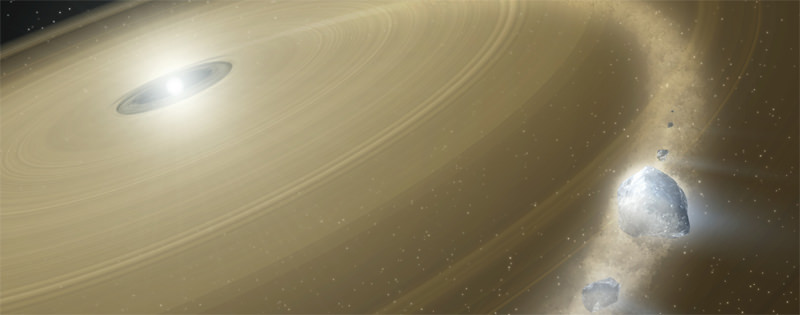
Dusty debris around an old white dwarf star (NASA)
[/caption]
The primary method by which astronomers hope to study exoplanet atmospheres is by detecting their absorption spectra as they transit their parent stars. However, another way would be to detect the signal of the atmospheric components in the atmosphere of a star that recently cannibalized a planet or other large body. White dwarfs offer an excellent class of stars on which to use this method since convection will pull heavy elements down more rapidly, leaving surfaces with near pristine hydrogen and helium photospheres. The presence of other elements would indicate recent accretion. This method has been used on several white dwarfs previously, but a new study reexamines data from a 2008 paper, adding their own data on the white dwarf GD61 to propose that the star isn’t just eating dust and small bodies, but a sizable one, likely containing water.
Data for the project were taken in 2009 using the SPITZER telescope. One of the first clues to the presence of a recent case of cannibalism was the presence of warm dust within the Roche limit of the star. This disc did not extend more than 26 stellar radii from the star, leading the team to suspect that this was not simply a large scale disc feeding the star with rocky materials, but an object that had fallen inwards to be tidally torn apart.
To support this, the new team used the Keck I telescope on Mauna Kea with the HIRES spectograph to analyze the spectrum. The findings from this confirmed the previous study that, in order of decreasing abundance, the star contained helium, hydrogen, oxygen, silicon, and iron. Based on the amount of material present in the spectrum and estimated convection rates for such stars, the team concluded that, if the disc were created by a single body, it would have been an asteroid at least 100 km in diameter. So why should the team expect that it was a single body as opposed to many smaller ones?
The key lies in the relative amount of detected elements. For GD61, oxygen was the most abundant element not typically present in white dwarf atmospheres. In fact, its presence far outweighed the other elements such that, even if all of it had been previously bound to the silicon, iron, carbon, and other trace elements, there would still be an inexplicable excess. This oxygen would necessarily have been combined into some molecule or have dissipated during the red giant phase. The only way the team could account for its presence would be to have it wrapped up in water (H2O) which, after disassociation, would allow the hydrogen to blend in the the expected hydrogen already present. Since water readily sublimates without sufficient pressures, the team notes that a large number of small bodies would be unable to bury the water deep enough to keep it from escaping previously, that the best explanation would be a large body which could shield water inside it during the previous red giant phase.
The evidence of water rich asteroids speaks to the formation of our own solar system because it provides a delivery mechanism for water to our planet beyond direct accretion. Water rich asteroids and comets would likely have supplemented our supply. Indeed, Ceres, the largest known asteroid in our solar system, is suspected to harbor as much as 25% of its mass in water.
One of the greatest potentials of transiting exoplanets is the ability to monitor the spectra and examine the composition of the planet’s atmosphere. This has been done already for HD 18733b and HD 209458b. In a new article by a team of astronomers at Keele University in the UK, absorption spectroscopy has been applied to the unusual exoplanet WASP-17b, which is known to orbit retrograde.
Not only does the spectra tell astronomers the atmospheric composition, but can also give an understanding of the the composition, but can also be indicative of how the atmosphere absorbs the light from the star and how heat is transferred around the planet. Additionally, since the atmosphere will absorb differently at different wavelengths, this gives differences in the timing of the eclipse and can be used to probe the radius of the planet more tightly as well as potentially examining the layering of the atmosphere.
For their investigation, the team concentrated on the sodium doublet lines at 5889.95 and 5895.92 Å. Observations were taken by the Very Large Telescope in Chile to observe 8 transits of the planet in June of 2009. The planet itself has a short orbit of 3.74 days.
Applying these spectroscopic techniques to WASP-17b, the team discovered the presence of sodium in the atmosphere. Yet the absorption wasn’t as strong as expected based on models using formation mechanisms from a nebula with solar composition and forming a planet with a cloudless atmosphere. Instead, the team describes 17b’s atmosphere as “sodium-depleted” similar to HD 209458b.
An additional observation was that the depth of seeing dropped off when using certain filters with different bandwidths (ranges of allowed wavelengths). The team noted that at bandwidths greater than 3.0 Å, the amount of sodium absorption seen nearly disappeared. Since this property is related to how much atmosphere the light travels through, this allowed the team to speculate that this may be indicative of clouds in the upper layers of the atmosphere.
Lastly, the team speculated as to the reason on the lack of sodium in the atmosphere. They proposed that energy from the star ionizes sodium on the day side. The motion of the atmosphere carrying it to the night side would then allow it to condense and be removed from the atmosphere. Since giant exoplanets in such tight orbits would likely be tidally locked, the sodium would have little chance to return to the day side and be brought back into the atmosphere.
While the examination of extrasolar atmospheres is undoubtedly new and will certainly be revised as the number of explored atmospheres increases, these pioneering studies are among the first that can allow astronomers directly test predictions of planetary atmospheres which, until recently have been solely based on observations of our own solar system. More generally, this will allow us to develop a fuller understanding of how planets evolve.
In terms of physics, absorption is defined as the way that energy from photons is taken up by matter, and transformed into other forms of energy, like heat. All of the light in the electromagnetic spectrum is made up of photons at different energy levels. Radio waves are photons with lower amounts of energy, and gamma rays are photons with very high levels of energy. When a photon strikes matter, it can either be reflected or absorbed by the material. And if it is absorbed, the energy of the photon is transformed into heat.
The absorbance of an object is a measure of what percentage of the electromagnetic radiation it’s likely to absorb. Transparent or reflective objects absorb much less than opaque, black objects.
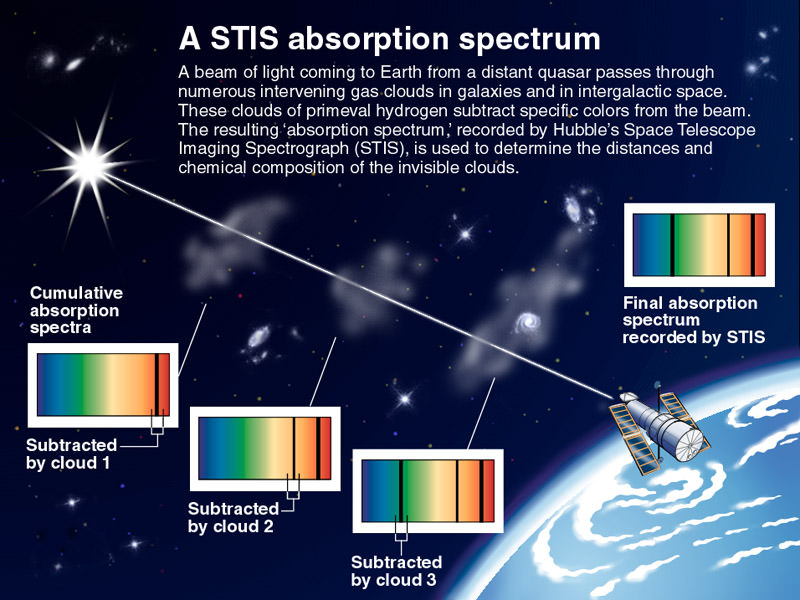
This concept is very important to astronomers, who are able to measure which wavelengths of light are being absorbed by an object or cloud of gas, to get an idea of what it’s made of. When you put the light from a star through a prism, you get a spectrum of the light coming from that star. But in some spectra, there are blank lines, gaps where no photons of a specific wavelength are being emitted. This means that some intervening object is absorbing all of the photons of this wavelength.
For example, imagine looking at how the light from a star passes through a planet’s atmosphere which is rich in sodium. This sodium will absorb photons at a specific wavelength, creating gaps in the spectrum from the light of the star. By comparing these gaps to the absorption line pattern of known gasses, astronomers can work out what’s in the planet’s atmosphere. This general method is used in many ways by astronomers to learn what distant objects are made out of.
The opposite of absorption is emission. This is where different elements will release photons when they’re heated. Different elements will release photons at different levels of energy, and their colors on the electromagnetic spectrum help astronomers discover what elements the object is made out of. When iron is heated, it releases photons in a very specific pattern, different from the pattern released by oxygen.
Both the absorption and emission serve as a fingerprint to help astronomers understand what the Universe is made out of.
We have written many articles about Absorption Spectroscopy for Universe Today. Here’s an article about amateur spectroscopy, and here’s an article about the light spectrum.
If you’d like more info on Absorption Spectroscopy, check out the Principles of Spectroscopy, and the Infrared Spectroscopy Page.
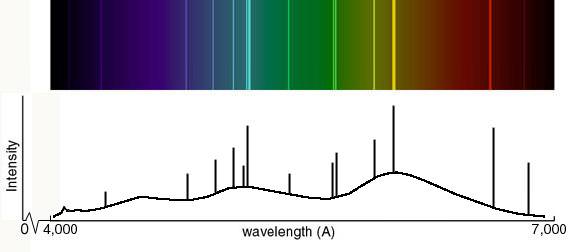
An example of an atomic spectrum, showing emission lines at particular wavelengths.
The light which atoms give off is made up of specific wavelengths, called lines; observed by a spectroscope, the lines are, collectively, atomic spectra.
In more detail …
In an atom, electrons have specific and discrete energies. There are many more energy states (or levels) in each atom than there are electrons. When an electron transitions (‘jumps’) from one energy level to another, it emits (if going from a higher level to a lower one) or absorbs (vice versa) light – a photon – with a discrete, specific wavelength. In any given set of conditions (pressure, temperature, magnetic field strength, etc), the collection of all those specific wavelengths is the spectrum of the atom … so atomic spectra are the spectra of atoms!
As the atomic electron energy levels are unique to each element, the lines in a spectrum (emission or absorption) can be used to identify the elements present in the source (a star, say) or gas between the source and us (e.g. the interstellar medium). Of course, for an extragalactic object – a quasar, perhaps – you need more than one line to make a certain identification … because the universe is expanding (and so you don’t know how much just one line may have been redshifted).
The light electronic transitions in atoms produces may not be in the visual part of the electromagnetic spectrum, but for atoms that are neutral or have lost only one or two electrons (yes, ‘atomic spectra’ refers to the line spectrum of ions too!), most lines are in the UV, visual, or near infrared. For highly ionized atoms, the lines are found in the extreme UV or x-ray region.
As the relative intensity of the lines in an atomic spectrum varies with temperature, analysis of the lines in the spectrum of a star (say) can give an estimate of the temperature of the star’s surface (photosphere). The width of the lines depends on the pressure of the gas; the structure of the lines depends on the magnetic field strength; the … (you get the idea) – atomic spectra are a wonderful window into the physical conditions of places far, far away!
Looking for more? This University of Oregon webpage has a good, brief, description of atomic spectra; and Physics Lab’s Atomic Models and Spectra covers both the historical context and a bit more of the theory.
Light spectrum can mean the visible spectrum, the range of wavelengths of electromagnetic radiation which our eyes are sensitive to … or it can mean a plot (or chart or graph) of the intensity of light vs its wavelength (or, sometimes, its frequency). More possible ambiguity: ‘light’ … which can refer to what we see, or to the part of the electromagnetic spectrum that optical telescopes (especially the ones down here on the ground) work in (and sometimes, just occasionally, it means the whole of the electromagnetic spectrum, or any electromagnetic radiation). Good news: the context makes it clear!
The realization that visible light is made up of colors is most often attributed to Isaac Newton (though a strong case can be made that it was known well before him), who used a prism to create a spectrum (rainbow of colors) from a beam of white light, and another to recombine them back into white light. And what’s it called when you spread light into a spectrum, for the purpose of studying it (in astronomy, chemistry, …)? Spectroscopy. And is there a different word if it’s infrared, ultraviolet, x-rays, … which are spread into a spectrum (rather than visible light)? Nope, it’s still spectroscopy.
Visible light ranges from about 380 nanometers (nm) to about 750 nm (or, as is still common in astronomy, ~3800 angstroms (Å) to ~7500 Å); the window in the Earth’s atmosphere which allows us to do astronomy from down here on its surface (and lets the light of the Sun through, so we can see!) is a bit wider than the visible spectrum; it goes from about 300 nm to about 1100 nm (or 1.1 µ).
To an astronomer, a light spectrum has two main components, the continuum and the lines (sometimes bands as well). The lines are discrete wavelengths (well, they do have some ‘width’, hence ‘narrow lines’ and ‘broad lines’), either emission or absorption, and correspond to a particular atomic transition (an electron jumps between one allowed energy level in an atom, or ion, and another; bands are the same thing, except for molecules … and the allowed states are either vibrational or rotational). And the continuum? Well, it’s the part that isn’t lines! It varies smoothly, and generally slowly, across the spectrum.
Spectroscopy – analysis of the light spectrum – is one of the most powerful tools astronomers use to work out what’s going on, and what it’s like, way out there where the light from the sky originates. Do you know why? If not, then these two NASA webpages will help! Visible Light Waves , and Electromagnetic Spectrum.
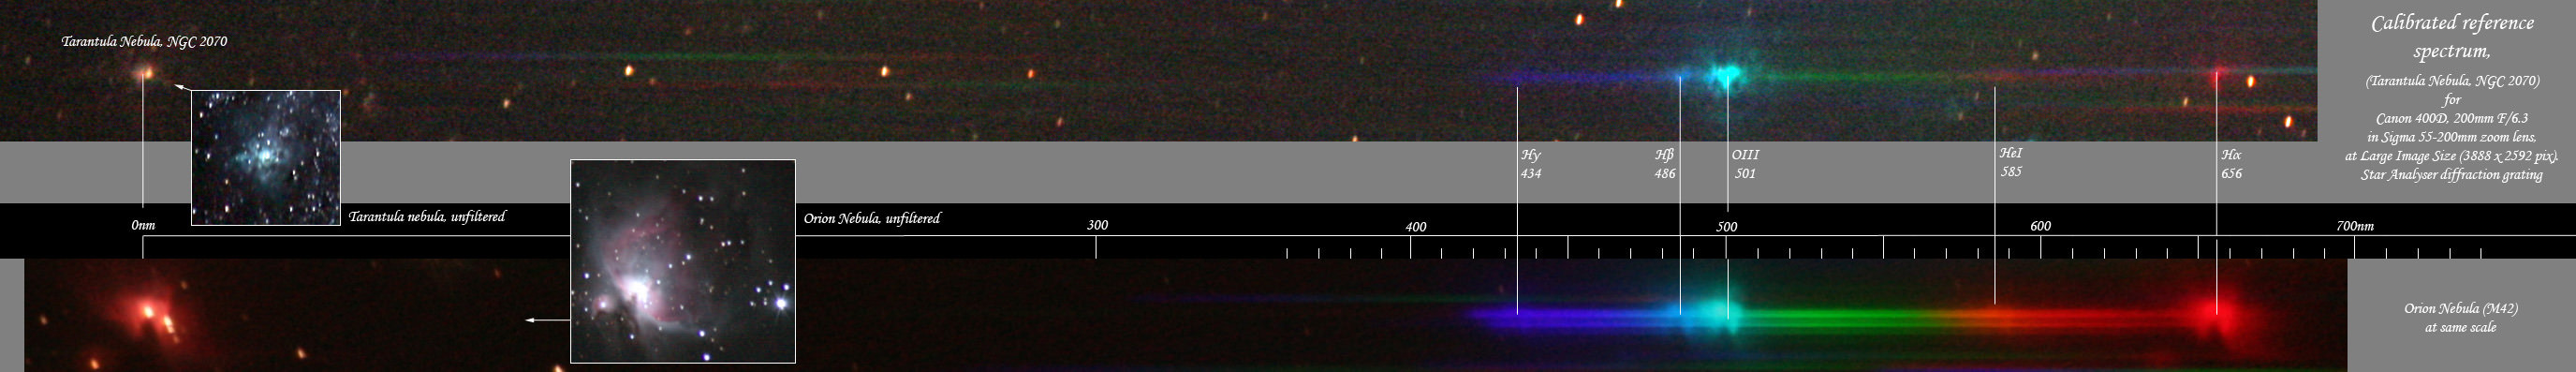
Credit: Robert Kaufman's image of Tarantula and Orion spectra (used with permission)
[/caption]
Amateur astronomers are a unique species worthy of their own reality TV show. Their craftsmanship, resourcefulness, dedication, and passion is simply amazing. Many professional astronomers rely heavily on amateurs for quick spot checks, discovery followups, collaboration on research projects, the diverse locations of their telescopes and their ability/willingness to put in long hours of observation. So what is spectroscopy, and what do the amateur astronomers get up to?
Absorption spectroscopy is the study of the color and light spectrum of stars and galaxies. We all love our Hubble photos and pretty astro-photographs, however most of the real research and science comes from observing the light spectrum.
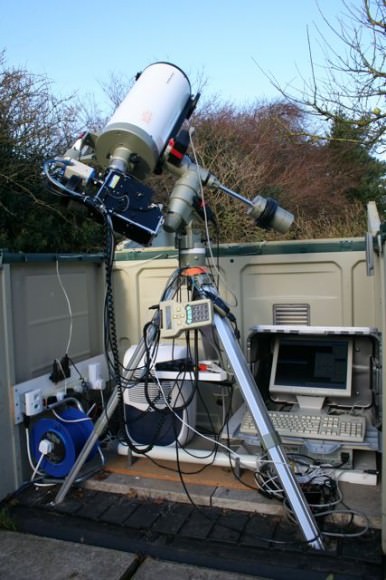
Robin Leadbeater’s LHIRESIII Spectrograph
Astronomers look at emission lines and absorption lines in the spectra to determine the make up of stars, nebulas and galaxies. Dopler effects, orbital behavior, elements of stars, even atmospheres can be determined by observing these absorption and emission lines. Scientists believe that a carbon dioxide absorption spectrum line signature in the spectrum of a star with a transiting exo-planet could eventually be the most exciting discovery – a possible indicator of extra-terrestrial life.
Why are amateurs interested?
I asked Ken Harrison the moderator of the Yahoo group – Astronomical Spectroscopy, why amateurs would be interested in absorption spectra?
“I see it as the “last frontier” for amateur astronomers. When you’ve taken the 100th image of the Orion nebulae – what do you do next?? It’s challenging, interesting and can give some scientific value to your work. Amateurs have successfully recorded the spectra of nova before the professionals and complimented other variable star work with observations of the changing spectral emissions of stars showing their Doppler shifts and atmospheric changes.”
Ken specializes in the spectra of Wolf-Rayet stars and is currently writing a book on amateur spectroscopy. Ken has been building his own spectrographs since 1992 and has used a variety of devices ranging from a simple star analyzer on a digital SLR camera to a sophisticated guided spectrograph.
A spectrograph allows light to pass through a narrow slit where it is then split into it’s spectra by passing through some sort of diffraction grating, before being captured on a CCD. The plate scale of the CCD then comes into play as angstroms per pixel instead of the usual (astrometric measure) arc/secs per pixel.
Rob Kaufman recently captured a Nova outburst Nova Scuti 2009 (V496 SCT) between the trees and clouds from his back yard.
Credit: Rob Kaufman's spectrogram of Nova Scuti 2009 (V496 SCT) outburst
Italian amateur Fulvio Mete has achieved a spectrographic separation of tight binary Beta Aurigea. The double Ha absorption line is easily identifiable in his image taken with a 14inch Celestron. Some of the world’s best telescopes are unable to separate Beta Aurigea optically, so being able to do a spectrographic separation with a back yard telescope is a significant achievement.
Fulvio Mete's spectrogram of Beta Aurigae
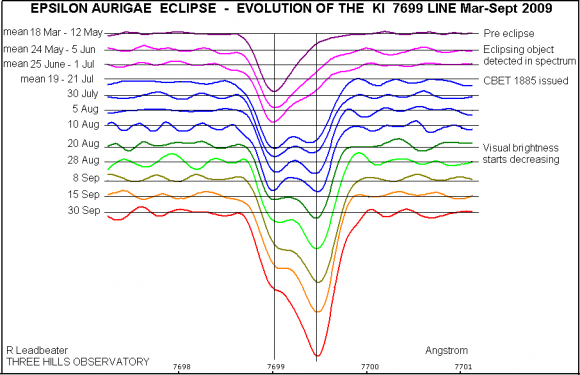
Perhaps there is no finer example of the quality of the spectroscopy done by amateurs than the current citizen science project on the eclipse of binary Epsilon Aurigae. Robin Leadbeater from Three Hills Observatory, a team member/contributor to the Citizen Sky project and avid amateur astronomer, has documented the changing spectra of Epsilon Aurigae, in particular monitoring the changing KI (neutral potassium) 7699 absorption line during the early stages of the ingress.
Robin Leadbeater's Spectrogram of KI 7699 absorption line in Epsilon Aurigae eclipse.
The eclipse happens every 27 years and this eclipse will be the first to be fully documented with advanced spectroscopy – clearly alot of that will be performed by skillful amateurs.
So what equipment do I need?
Ken Harrison comments that the equipment required is not necessarily expensive and it is a lot of fun.
“Luckily with the filter gratings available at reasonable prices (Star Analyser, Rainbow Optics etc) interested amateurs can start using their current equipment with minimal cost and outlay. Freeware programs like IRIS (C Buil) and VSpec (V Desnoux) allow the detailed analysis of spectra to be done without all the mathematics or detailed physics. As experience grows so do the questions. What do those absorption features mean? Why does this spectrum look completely different from that spectrum? How can I get benn resolution? Yes, it has its learning curve like any new adventure, but there are many others who have trodden the road before and only too willing to assist – To boldly go where few amateurs have gone before – Spectroscopy!!!”
The contribution of amateurs across all forms of astronomy is significant, and spectroscopy is no exception. If you want more information join one of the Yahoo groups or major amateur astronomy forums as they all have discussion groups with experienced people who are keen to help you get started.
Special thanks to Ken Harrison, Robin Leadbeater, Rob Kaufman, Fulvio Mete and Dale Mais for your photos and insight!


 Although such glass particles are widespread on the surface of the Moon — the researchers studied samples returned from Apollo 11, Apollo 16 and Apollo 17 missions — the water in hydroxyl form is not something that could be easily used by future lunar explorers. Still, the findings suggest that solar wind-derived hydroxyl may also exist on the surface of other airless worlds, like Mercury, Vesta or Eros… especially within permanently-shadowed craters and depressions.