Green and Red Auroras Light Up St. Patrick’s Day Dawn

Just in time for St. Patrick's Day - a
A spectacular green and red aurora photographed early this morning March 17, 2015, from Donnelly Creek, Alaska. Credit: Sebastian Saarloos

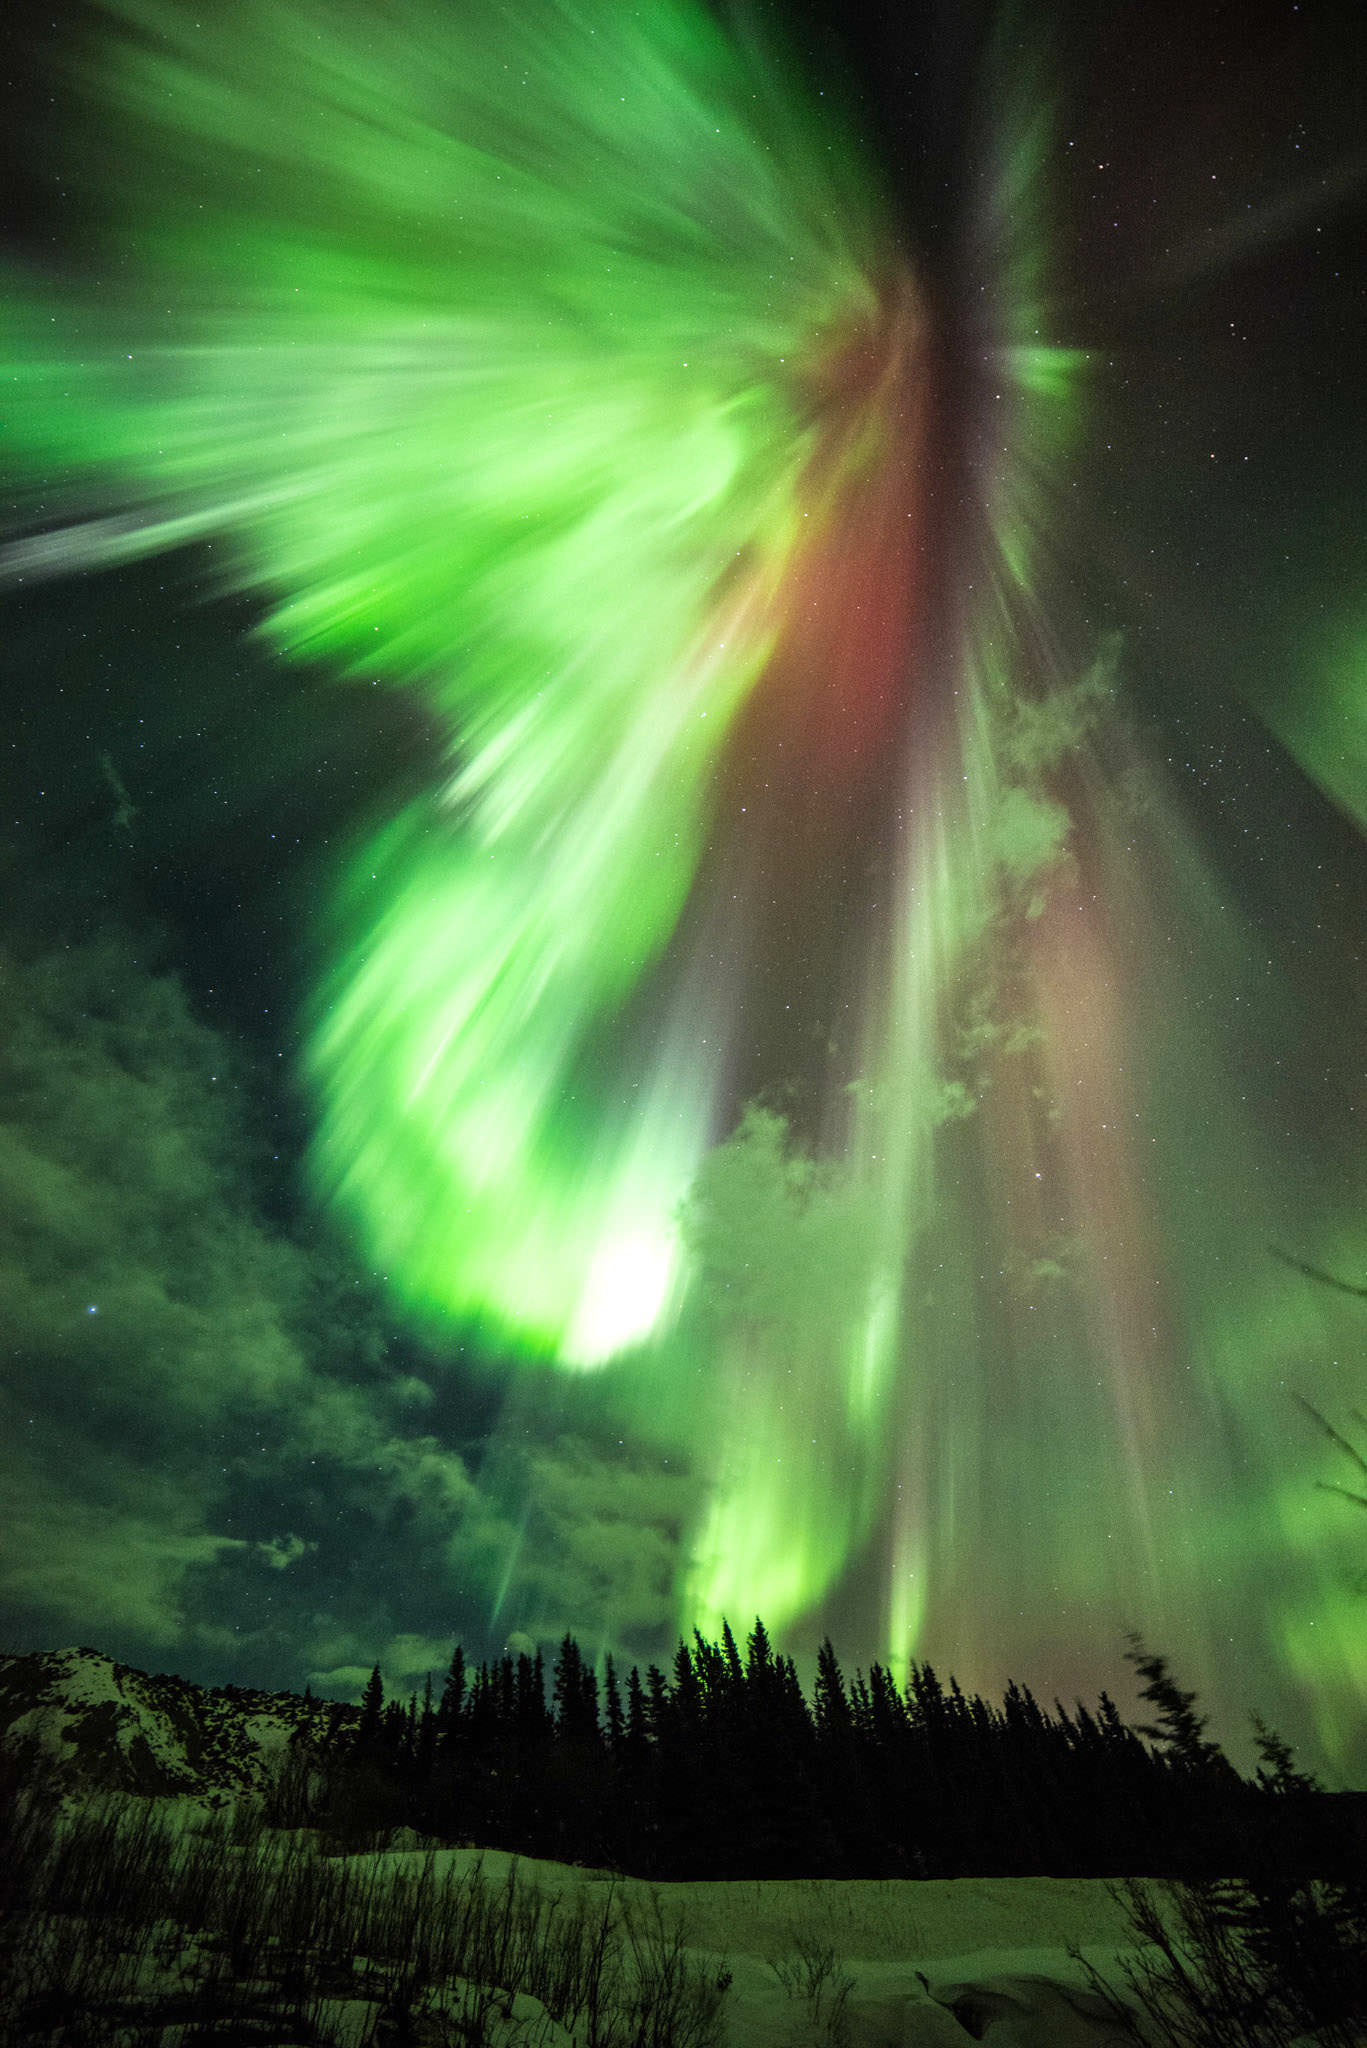
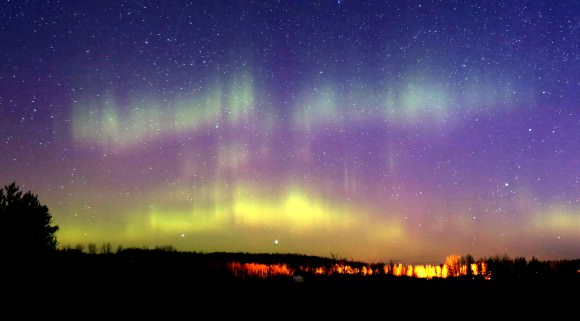
A strong G3 geomagetic storm surged across the planet this morning producing a spectacular display of the northern lights. Some of you may who may have risen to see the new nova were no doubt as surprised as the NOAA space weather folks, whose overnight forecast did not include an alert for even a minor storm.

So what happened? Let’s just say the Sun isn’t always as predictable as we’d like. An interplanetary shock wave in the form of a sudden increase in the solar wind speed from 250 miles per second to 375 mph (400-600 km/sec) began blasting Earth shortly before midnight. It appears the combined effects of earlier coronal mass ejections (CMEs) and an outpouring of high-speed solar particles from a gaping hole in the Sun’s magnetic canopy crashed through Earth’s magnetic defenses.

Particle-wise, all hell broke loose. You can start looking for more as soon as it gets dark tonight.

A powerful X2.2-class flare from sunspot region 2297 glows fiery yellow in this photo taken by NASA’s Solar Dynamics Observatory on March 11, 2015. Credit: NASA
A powerful X2.2-class flare from sunspot region 2297 glows intensely in this photo taken in short wavelength ultraviolet light by NASA’s Solar Dynamics Observatory on March 11, 2015. Credit: NASA Goddard SDO

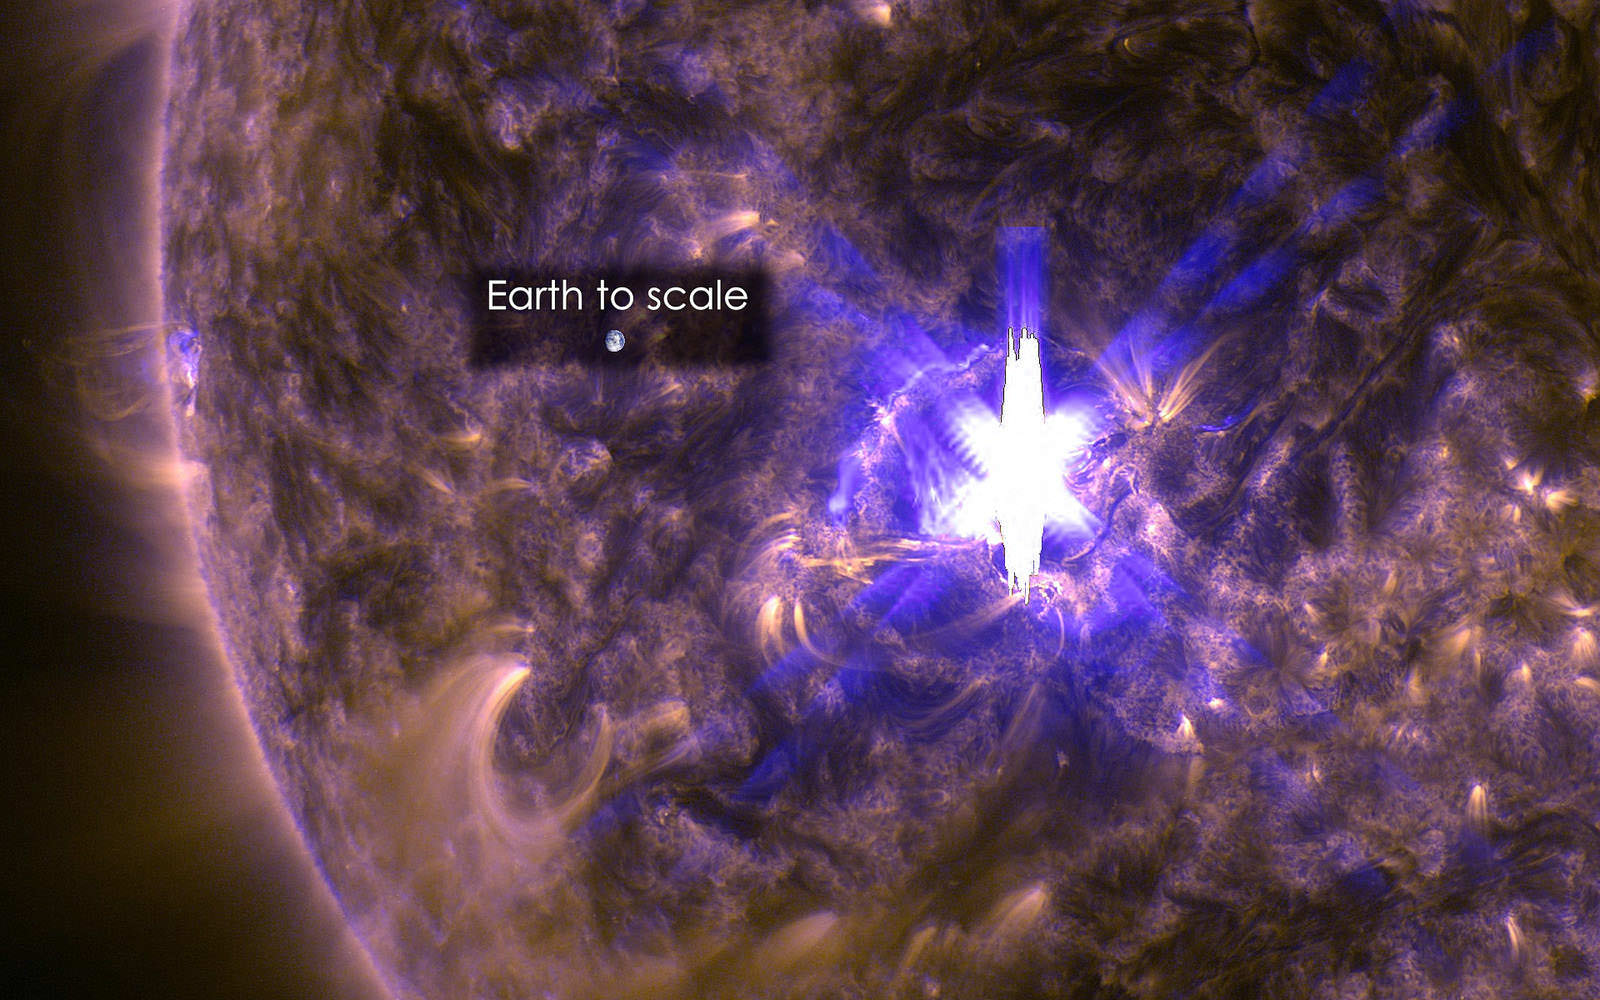
We know that recent flares from sunspot group 2297 have sent more than a few billows of solar particles our way called CMEs or coronal mass ejections. Weekend forecasts called for minor storms but little materialized. Only when we thought it was safe to go back to bed did the aurora pounce. Reading the magnetospheric tea leaves, better known as the Kp index, a measure of magnetic activity high overhead in Earth’s ionosphere, quiet conditions gave way to auroral abandon starting around 1 a.m (CDT) today.

A wall of colorful red and green aurora met the eye and camera of Jim Schaff of Duluth this morning around 3 a.m. CDT. Credit: Jim Schaff

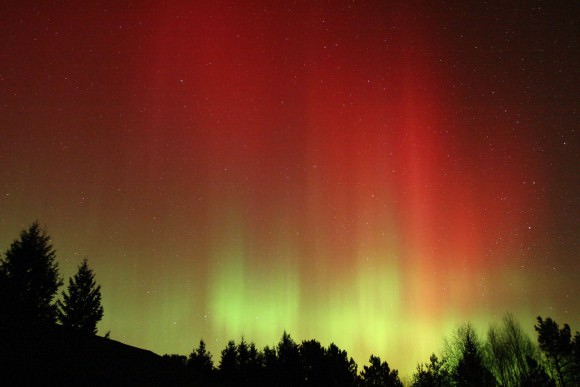
Like a spring grassfire the northern lights took off from there and burned till dawn, peaking between 2 and 4 a.m. Most of us are usually asleep during those deep hours of the night, but I’m hoping those who arose to see the nova or catch the lunar crescent at dawn may have been as surprised and delighted as I was to see auroras.

Like paw prints made by a cat, pale green auroral rays mark the northern sky around 5:45 a.m this morning March 17. Credit: Bob King

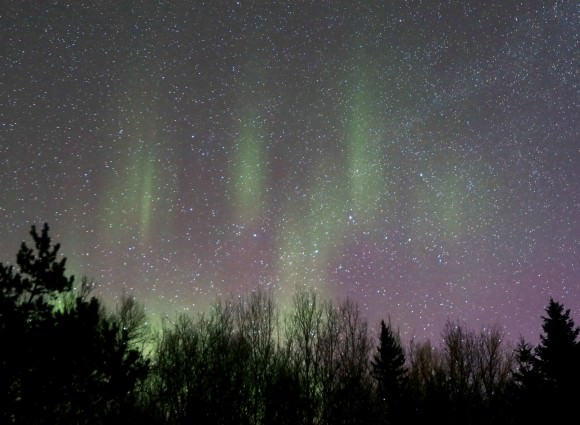
More are in the offing. The latest space weather forecast calls for continued severe storms (G3 or higher) to continue through tonight. G1 or minor storms are normally only visible as arcs or low rays across the north from the northern tier of states, but if tonight’s forecast holds, a fair portion of the U.S. should see auroras. Keep an eye peeled for bright, moving glow and arcs across the northern sky.

The awesome 30-minute aurora forecast map updates the shrinking and expanding of Earth's northern auroral oval due to changes in the solar wind from CMEs, flares and the like. This view is from this morning around 4:55 a.m. Red indicates intense aurora. Credit: NOAA
The awesome 30-minute aurora forecast map updates the shrinking and expanding of Earth’s northern auroral oval due to changes in the solar wind from CMEs, flares and the like. This view is from this morning around 4:55 a.m. Red indicates intense aurora. Credit: NOAA

There are lots of tools available you can use yourself to know if auroras are lurking about. First, check the NOAA 3-day space weather forecast. There you’ll see a list of times along with a Kp index number indicating magnetic activity. Number “1-4” means no storm and little likelihood you’ll see an aurora. “5”  indicates a minor storm; the higher the number the more severe the storm and more widespread the northern lights will be.

Curtains of aurora still pushed through the growing light of dawn. Credit: Bob King
Curtains of aurora still pushed through the growing light of dawn (blue sky at top). Credit: Bob King

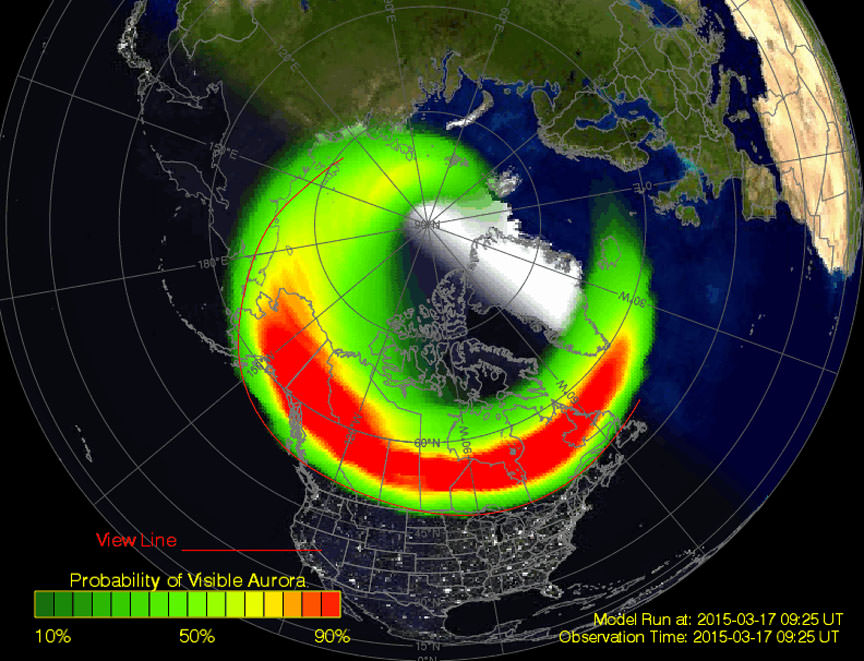
There’s also a nice visual representation of the numbers on the Planetary K-index site, where magnetic activity is updated every 3 hours.  The dashed line on the bar chart represents 0 UT or 7 p.m. CDT. One of my favorites and the ultimate visual feast of an aurora indicator is NOAA’s Aurora 30-minute Forecast. Here you get a birds-eye representation of the current aurora based on satellite data. When the permanent auroral oval expands southward and intensifies, put on your coat and head out for a look. For education and entertainment, click on the gray arrow below the graphic and you’ll see a whole day’s worth of activity play out before your eyes. Totes cool.

ACE plot from a June 2013 aurora. Note the steep drop in the Bz. Credit: NOAA
ACE plot from a June 2013 aurora. Note the steep drop in the Bz. ACE  orbits around the L1 Lagrange point about a million miles ahead of Earth in the direction of the Sun. There it studies the incoming particle streams from the Sun hours before they reach Earth. Credit: NOAA

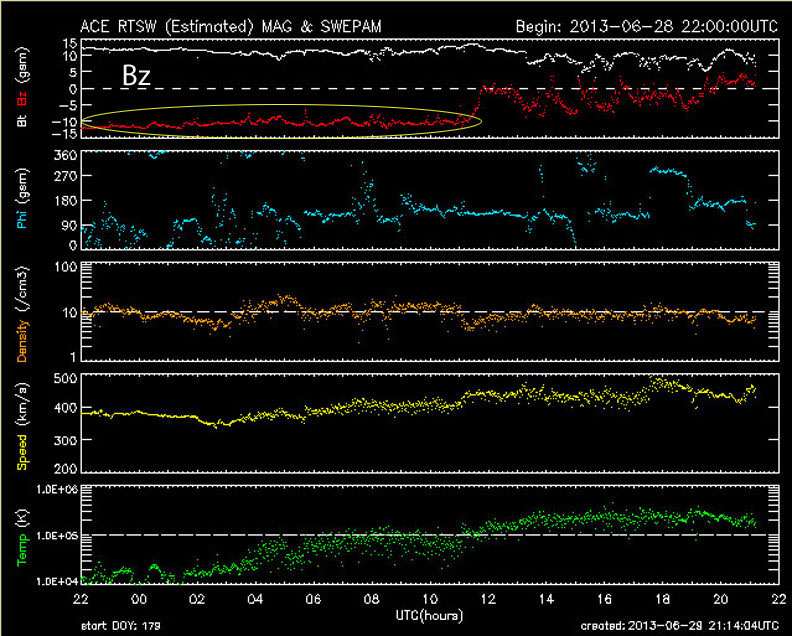
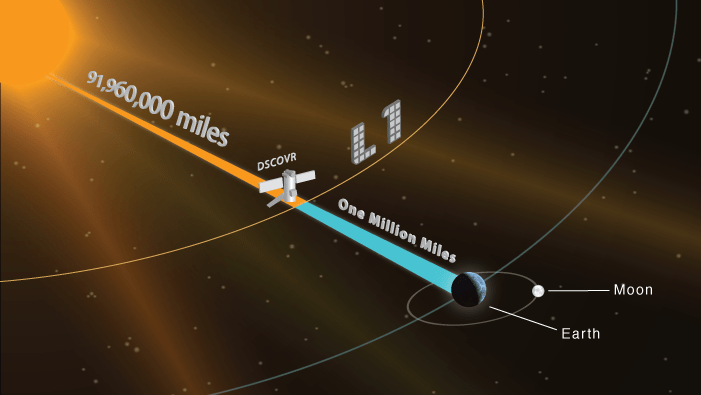
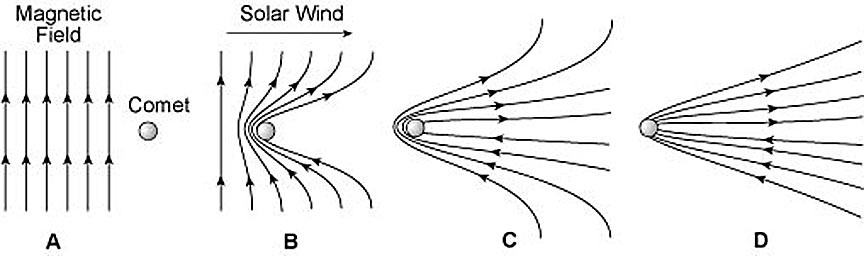
I’m also in big believer in the the Advanced Composition Explorer (ACE) Bz plot. Bz is the direction of the embedded solar magnetic field that gift-wraps the streams of high-speed particles sent our way by the Sun. Like a magnet, it has a south pole and a north pole. When the south pole of the field sweeps by – what scientists call a negative Bz – the blast is more likely to link up with Earth’s magnetic field and spark auroras. When you see the Bz “head south” to -5 or lower, there’s a chance for auroras.

Now that you’re armed with information, cross your fingers all the indicators will point in the right direction for the aurora to continue tonight. And yes, Happy St. Patrick’s Day!

Skiing stop to take in the northern lights near Fairbanks Monday night. Credit: John Chumack
Skywatchers stop to take in the northern lights near Fairbanks Monday night. Credit: John Chumack

UPDATE: The storm continues and is now rated G4 or severe as of 10 a.m. CDT. Lucky for you if you live somewhere where it’s dark right now.

NOAA/NASA/USAF Deep Space Climate Observatory (DSCOVR) Launching Feb. 8 to Monitor Solar Winds

DSCOVR mission logo. Credit: NOAA/NASA/U.S. Air Force

The long awaited Deep Space Climate Observatory, or DSCOVR science satellite is slated to blast off atop a SpaceX Falcon 9 on Sunday, Feb. 8, from Cape Canaveral, Florida on a mission to monitor the solar wind and aid very important forecasts of space weather at Earth.

DSCOVR is a joint mission between NOAA, NASA, and the U.S Air Force (USAF) that will be managed by NOAA. The satellite and science instruments are provided by NASA and NOAA.

Update Feb 8: Hold, Hold, Hold !!! 6:10 PM 2/8/15 Terminal Count aborted at T Minus 2 min 26 sec due to a tracking issue. NO launch of Falcon 9 today. rocket being safed now. next launch opportunity is Monday. Still TBD.

The rocket is provided by the USAF. SpaceX will try to recover the first stage via a guided descent to a floating barge in the Atlantic Ocean.

The weather outlook is currently very promising with a greater than 90 percent chance of favorable weather at launch time shortly after sunset on Sunday which could make for a spectacular viewing opportunity for spectators surrounding the Florida Space coast.

Liftoff atop the SpaceX Falcon 9 rocket is targeted for at 6:10:12 p.m. EST on Feb. 8, from Cape Canaveral Air Force Station Space Launch Complex 40.

There is an instantaneous launch window, meaning that any launch delay due to weather, technical or other factors will force a scrub to Monday.

The launch will be broadcast live on NASA TV: http://www.nasa.gov/nasatv

NASA’s DSCOVR launch blog coverage of countdown and liftoff will begin at 3:30 p.m. Sunday.

NOAA/NASA Deep Space Climate Observatory (DSCOVR) undergoes processing in NASA Goddard Space Flight Center clean room. Solar wind instruments at right. DSCOVER will launch in February 2015 atop SpaceX Falcon 9 rocket.  Credit: Ken Kremer/kenkremer.com/AmericaSpace
NOAA/NASA Deep Space Climate Observatory (DSCOVR) undergoes processing in NASA Goddard Space Flight Center clean room. Solar wind instruments at right. DSCOVER will launch in February 2015 atop SpaceX Falcon 9 rocket. Credit: Ken Kremer/kenkremer.com/AmericaSpace

“DSCOVR is NOAA’s first operational space weather mission to deep space,” said Stephen Volz, assistant administrator of the NOAA Satellite and Information Service in Silver Spring, Maryland, at the pre-launch briefing today (Feb. 7) at the Kennedy Space Center in Florida.

The mission of DSCOVR is vital because its solar wind observations are crucial to maintaining accurate space weather forecasts to protect US infrastructure from disruption by approaching solar storms.

“DSCOVR will maintain the nation’s solar wind observations, which are critical to the accuracy and lead time of NOAA’s space weather alerts, forecasts, and warnings,” according to a NASA description.

“Space weather events like geomagnetic storms caused by changes in solar wind can affect public infrastructure systems, including power grids, telecommunications systems, and aircraft avionics.”

DSCOVR will replace NASA’s aging Advanced Composition Explorer (ACE) satellite which is nearly 20 years old and far beyond its original design lifetime.

The couch sized probe is being targeted to the L1 Lagrange Point, a neutral gravity point that lies on the direct line between Earth and the sun located 1.5 million kilometers (932,000 miles) sunward from Earth. At L1 the gravity between the sun and Earth is perfectly balanced and the satellite will orbit about that spot just like a planet.

L1 is a perfect place for the science because it lies outside Earth’s magnetic environment. The probe will measure the constant stream of solar wind particles from the sun as they pass by.

Diagram of the five Lagrange points associated with the sun-Earth system, showing DSCOVR orbiting the L-1 point. Image is not to scale.  Credit:  NASA/WMAP Science Team
Diagram of the five Lagrange points associated with the sun-Earth system, showing DSCOVR orbiting the L-1 point. Image is not to scale. Credit: NASA/WMAP Science Team

This will enable forecasters to give a 15 to 60 minute warning of approaching geomagnetic storms that could damage valuable infrastructure.

DSCOVR is equipped with a suite of four continuously operating solar science and Earth science instruments from NASA and NOAA.

It will make simultaneous scientific observations of the solar wind and the entire sunlit side of Earth.

Three instruments will help measure the solar wind on the DSCOVR mission: (shown from left to right), the Faraday cup to monitor the speed and direction of positively-charged solar wind particles, the electron spectrometer to monitor electrons, and a magnetometer to measure magnetic fields.  Credit: NASA/DSCOVR
Three instruments will help measure the solar wind on the DSCOVR mission: (shown from left to right), the Faraday cup to monitor the speed and direction of positively-charged solar wind particles, the electron spectrometer to monitor electrons, and a magnetometer to measure magnetic fields. Credit: NASA/DSCOVR

The 750-kilogram DSCOVR probe measures 54 inches by 72 inches.

I saw the DSCOVR spacecraft up close at NASA Goddard Space Flight Center in Maryland last fall during processing in the clean room.

NOAA/NASA/USAF Deep Space Climate Observatory (DSCOVR) undergoes processing in NASA Goddard Space Flight Center clean room.  Probe will launch in February atop SpaceX Falcon 9 rocket.  Credit: Ken Kremer - kenkremer.com
NOAA/NASA/USAF Deep Space Climate Observatory (DSCOVR) undergoes processing in NASA Goddard Space Flight Center clean room. Probe will launch in February atop SpaceX Falcon 9 rocket. Credit: Ken Kremer – kenkremer.com

A secondary objective of the rocket launch for SpaceX is to conduct their second attempt to recover the Falcon 9 first stage booster on an ocean going barge. Read my articles about the first attempt in January 2015, starting here.

It was originally named ‘Triana’ (aka Goresat) and was conceived by then US Vice President Al Gore as a low cost satellite to take near continuous views of the Earth’s entire globe to feed to the internet as a means of motivating students to study math and science. It was eventually built as a much more capable Earth science satellite as well as to conduct the space weather observations.

But Triana was shelved for purely partisan political reasons and the satellite was placed into storage and the science was lost until now.

Stay tuned here for Ken’s continuing Earth and planetary science and human spaceflight news.

Ken Kremer

The team is ready for the launch of NASA's DSCOVR spacecraft aboard a SpaceX Falcon 9 rocket. L/R Mike Curie KSC NASA News Chief, Stephen Volz, assistant administrator NOAA, Tom Berger, director of NOAA Space Weather Prediction Center Boulder Colorado,Steven Clark, NASA Joint Agency Satellite Division, Col. D. Jason Cothern, Space Demonstration Division chief at Kirkland AFB NM. Hans Koenigsmann, VP of mission assurance at SpaceX in Hawthorne, California, Mike McAlaneen, launch weather officer 45th Space wing Cape Canaveral Air Force Station, Florida.  Credit: Julian Leek
The team is ready for the launch of NASA’s DSCOVR spacecraft aboard a SpaceX Falcon 9 rocket. L/R Mike Curie KSC NASA News Chief, Stephen Volz, assistant administrator NOAA, Tom Berger, director of NOAA Space Weather Prediction Center Boulder Colorado,Steven Clark, NASA Joint Agency Satellite Division, Col. D. Jason Cothern, Space Demonstration Division chief at Kirkland AFB NM. Hans Koenigsmann, VP of mission assurance at SpaceX in Hawthorne, California, Mike McAlaneen, launch weather officer 45th Space wing Cape Canaveral Air Force Station, Florida. Credit: Julian Leek

How to Find and Make the Most of Comet Lovejoy

This photo map shows Comet Lovejoy's nightly position among the winter stars through January 19th as it travels across the constellation Taurus not far from Aldebaran and the Pleiades star cluster. Click to enlarge. Credit: Bob King

Comet Q2 Lovejoy passed closest to Earth on January 7th and has been putting on a great show this past week. Glowing at magnitude +4 with a bluish coma nearly as big as the Full Moon, the comet’s easy to see with the naked eye from the right location if you know exactly where to look. I wish I could say just tilt your head back and look up and bam! there it would be, but it’ll take a little more effort than that. But just a little, I promise. 

Comet Lovejoy and its spectacular "lively" ion tail photographed on January 8th by Nick Howes at Tzec Muan Network at Siding Spring Australia
Comet Lovejoy and its spectacular “lively” ion tail photographed on January 8th by Nick Howes at Tzec Muan Network at Siding Spring Australia

Last night, under a dark rural sky, once I spotted the comet and noticed its position in relation to nearby bright stars, I could look up and see it anytime. Finding anything other than the Moon or a bright planet in the night sky often requires a good map. I normally create a star-chart style map but thought, why not make a photographic version? So last night I snapped a few guided images of Lovejoy as it glimmered in the wilds of southern Taurus and then cloned the comet’s nightly position through onto the image. Maybe you’ll find this useful, maybe not. If not, the regular map is also included.

Comet Lovejoy position is shown for each night tonight through January 23rd. The comet should remain in the 4-5 magnitude range throughout. Click for a larger map you can print out and use outdoors. Click to enlarge and print for use outdoors. Source: Chris Marriott’s SkyMap software
Comet Lovejoy’s position is shown for each night tonight through January 23rd. The comet should remain in the 4-5 magnitude range throughout. Lovejoy is currently high in the southeastern sky at nightfall and crosses the meridian due south around 9 o’clock local time. Click for a larger map you can print out and use outdoors. Source: Chris Marriott’s SkyMap software

To see Comet Lovejoy with the naked eye you’ll need reasonably dark skies. It should be faintly visible from outer ring suburbs, but country skies will guarantee a sighting. I’ve been using bright stars in Orion and Taurus to guide binoculars – and then my eye – to the comet. Pick a couple bright stars like Aldebaran and Betelgeuse and extend a line from each to form a triangle with Lovejoy at one of the corners. If you then point binoculars at that spot in the sky, the comet should pop out. If you don’t find it immediately, sweep around the position a bit.  After you find it, lower the binoculars and try to spot it with the naked eye.

Comet Lovejoy last night January 9th around 8 p.m. (CST) shows a bright coma and faint ~1.5-degree-long
Comet Lovejoy last night January 9th around 8 p.m. (CST) shows a bright coma and faint ~1.5-degree-long tail. This photo, made with a 200mm lens, gives a good idea of what the comet looks like in 50mm binoculars. Details: f/2.8, ISO 800, 2-minute exposure. Credit: Bob King

This week, as Lovejoy continues trekking north, you can use bright orangey Aldebaran in Taurus and the Pleiades, also called the Seven Sisters star cluster, to “triangulate” your way to the comet. Look for a glowing fuzzball. In 10×50 and 8×40 binoculars, it’s obviously different from a star — all puffed up with a brighter center. The 50mm glass even shows a hint of the coma’s blue color caused by carbon molecules fluorescing in ultraviolet sunlight and a faint, streak-like tail extending to the northeast. With the naked eye, at first you might think it’s just a dim star; closer scrutiny reveals the star has a hazy appearance, pegging it as a comet.

Comet Lovejoy sketches from last night made using a 15-inch telescope. The coma is big - almost a half-degree across. The drawing shows the bright nuclear region and tiny "false nucleus". At right, a suspected plume extends to the southwest of the false nucleus. Color is how the comet really looks in the telescope. Credit: Bob King
Comet Lovejoy sketches from last night made using a 15-inch telescope. The coma is big – almost a half-degree across. The drawing shows the bright nuclear region and tiny “false nucleus”. At right, a suspected plume extends to the southwest of the false nucleus. Color is how the comet really looks in the telescope. South is up. Credit: Bob King

Through a telescope the coma is a HUGE pale blue tiki lamp of a thing with a small, much brighter nuclear region. The rays of the ion tail, so beautifully shown in photographs, are indistinct but visible with patience and a moderate-sized telescope under dark skies. At low magnification, the nucleus – the false nucleus actually, since the real comet nucleus is hidden by a shroud of dust and gas – looks like a misty star of about magnitude +9. On close inspection at high magnification (250x and up), you penetrate more deeply into the nuclear zone and the star-like center shrinks and dims to around magnitude +13.

Fascinating plumes of dust recorded by Gianluca Masi on January 6th. South is up, west to the left. Credit: Gianluca Masi

If the seeing is good and comet active, high magnification will often reveal jets or fans of dust in the sunward direction, in this case west of nucleus. I’ve been studying the comet the past couple nights and am almost convinced I can see a short, very low contrast plume poking to the south of center. Generally, plumes and jets are subtle, low-contrast features. Challenging? Yes, but with Lovejoy as close as it’s going to get, now’s the time to seek them.

In this photo taken January 8th, the comet's tail is caught in the act of separated from the head or coma. Magnetic fields embedded in the stream of particles from the Sun occasionally reconnect on the rear side of a comet and pinch off its tail. Credit: Rolando Ligustri
In this photo taken January 8th, the comet’s tail is caught in the act of separated from the head or coma. Magnetic fields embedded in the stream of particles from the Sun occasionally reconnect on the rear side of a comet and pinch off its tail. A new one quickly grows to replace the old. Credit: Rolando Ligustri

Just before Christmas, fluctuations in the solar wind snapped off Comet Lovejoy’s tail. Guess what? It happened again on January 8th as recorded in dramatic fashion by astrophotographer Rolando Ligustri. An ion or gas tail like the one in the photo forms when cometary gases, primarily carbon monoxide, are ionized by solar radiation and lose an electron to become positively charged. Once “electrified”, they can be twisted, kinked and even snapped off by magnetic fields embedded in the Sun’s particle wind.

Of course, the comet didn’t miss a breath but grew another tail immediately. Look closely at the photo and you see another faint streak of light pointing beyond the coma below and left of the bright nuclear region. This may be Lovejoy’s dust tail. Most comets sport both types of tails – gas and dust – since they release both materials as the Sun heats and vaporizes their ices.

Lovejoy’s been a thrill to watch because it’s doing all the cool stuff that makes them so fun to follow. Gianluca Masi, an Italian astrophysicist and lover of all things cometary, will offer a live feed of the comet on Monday January 12th starting at 1 p.m. CST (7 p.m. UT). May your skies be clear tonight!

New Mission: DSCOVR Satellite will Monitor the Solar Wind

Artist's concept of the DSCOVR satellite in orbit. Credit: NOAA

Solar wind – that is, the stream of charged electrons and protons that are released from the upper atmosphere of the Sun – is a constant in our Solar System and generally not a concern for us Earthlings. However, on occasion a solar wind shock wave or Coronal Mass Ejection can occur, disrupting satellites, electronics systems, and even sending harmful radiation to the surface.

Little wonder then why NASA and the National Oceanic and Atmospheric Administration (NOAA) have made a point of keeping satellites in orbit that can maintain real-time monitoring capabilities. The newest mission, the Deep Space Climate Observatory (DSCOVR) is expected to launch later this month.

A collaborative effort between NASA, the NOAA, and the US Air Force, the DSCOVR mission was originally proposed in 1998 as a way of providing near-continuous monitoring of Earth. However, the $100 million satellite has since been re-purposed as a solar observatory.

In this capacity, it will provide support to the National Weather Service’s Space Weather Prediction Center, which is charged with providing advanced warning forecasts of approaching geomagnetic storms for people here on Earth.

Illustration showing the DSCOVR satellite in orbit L1 orbit, located one million miles away from Earth. At this location, the satellite will be in the best position to monitor the constant stream of particles from the sun, known as solar wind, and provide warnings of approaching geomagnetic storms caused by solar wind about an hour before they reach Earth. Credit: NOAA
Illustration showing the DSCOVR satellite in L1 orbit, located 1.5 million km  (930,000 mi) away from Earth. Credit: NOAA

These storms, which are caused by large-scale fluctuations in solar wind, have the potential of disrupting radio signals and electronic systems, which means that everything from telecommunications, aviation, GPS systems, power grids, and every other major bit of infrastructure is vulnerable to them.

In fact, a report made by the National Research Council estimated that recovering from the most extreme geomagnetic storms could take up to a decade, and cost taxpayers in the vicinity of $1 to $2 trillion dollars. Add to the that the potential for radiation poisoning to human beings (at ground level and in orbit), as well as flora and fauna, and the need for alerts becomes clear.

Originally, the satellite was scheduled to be launched into space on Jan. 23rd from the Cape Canaveral Air Force Station, Florida. However, delays in the latest resupply mission to the International Space Station have apparently pushed the date of this launch back as well.

According to a source who spoke to SpaceNews, the delay of the ISS resupply mission caused scheduling pressure, as both launches are being serviced by SpaceX from Cape Canaveral. However, the same source indicated that there are no technical problems with the satellite or the Falcon 9 that will be carrying it into orbit. It is now expected to be launched on Jan. 29th at the latest.

Credit: NOAA
SpaceX will be providing the launch service for DSCOVR, which is now expected to be launched by the end of Jan aboard a Falcon 9 rocket (pictured here). Credit: NOAA

Once deployed, DSCOVR will eventually take over from NASA’s aging Advanced Composition Explorer (ACE) satellite, which has been in providing solar wind alerts since 1997 and is expected to remain in operation until 2024. Like ACE, the DSCOVER will orbit Earth at Lagrange 1 Point (L1), the neutral gravity point between the Earth and sun approximately 1.5 million km (930,000 mi) from Earth.

From this position, DSCOVR will be able to provide advanced warning, roughly 15 to 60 minutes before a solar wind shockwave or CME reaches Earth. This information will be essential to emergency preparedness efforts, and the data provided will also help improve predictions as to where a geomagnetic storm will impact the most.

These sorts of warnings are essential to maintaining the safety and integrity of infrastructure, but also the health and well-being of people here on Earth. Given our dependence on high-tech navigation systems, electricity, the internet, and telecommunications, a massive geomagnetic storm is not something we want to get caught off guard by!

And be sure to check out this video of the DSCOVR mission, courtesy of the NOAA:

Further Reading: NOAA

Better than Bieber, Rosetta’s Comet Sings Strange, Seductive Song

Magnetic field lines bound up in the sun’s wind pile up and drape around a comet’s nucleus to shape the blue ion tail. Notice the oppositely-directed fields on the comet’s backside. The top set points away from the comet; the bottom set toward. In strong wind gusts, the two can be squeezed together and reconnect, releasing energy that snaps off a comet’s tail. Credit: Tufts University


Tune in to the song of Comet Churyumov-Gerasimenko

Scientists can’t figure exactly why yet, but Comet 67P/Churyumov-Gerasimenko has been singing since at least August. Listen to the video – what do you think? I hear a patter that sounds like frogs, purring and ping-pong balls. The song is being sung at a frequency of 40-50 millihertz, much lower than the 20 hertz – 20 kilohertz range of human hearing. Rosetta’s magnetometer experiment first clearly picked up the sounds in August, when the spacecraft drew to within 62 miles (100 km) of the comet. To make them audible Rosetta scientists increased their pitch 10,000 times. 

The sounds are thought to be oscillations in the magnetic field around  the comet. They were picked up by the Rosetta Plasma Consortium,  a suite  of five instruments on the spacecraft devoted to observing interactions between the solar plasma and the comet’s tenuous coma as well as the physical properties of the nucleus. A far cry from the stuff you donate at the local plasma center, plasma in physics is an ionized gas. Ionized means the atoms in the gas have lost or gained an electron through heating or collisions to become positively or negatively charged ions. Common forms of plasma include the electric glow of neon signs, lightning and of course the Sun itself.

Having lost their neutrality, electric and magnetic fields can now affect the motion of particles in the plasma. Likewise, moving electrified particles affect the very magnetic field controlling them.

Scientists think that neutral gas particles from vaporizing ice shot into the coma become ionized under the action of ultraviolet light from the Sun. While the exact mechanism that creates the curious oscillations is still unknown, it might have something to do with the electrified atoms or ions interacting with the magnetic fields bundled with the Sun’s everyday outpouring of plasma called the solar wind. It’s long been known that a comet’s electrified or ionized gases present an obstacle to the solar wind, causing it to drape around the nucleus and shape the streamlined blue-tinted ion or gas tail.

“This is exciting because it is completely new to us. We did not expect this, and we are still working to understand the physics of what is happening,” said Karl-Heinz Glassmeier, head of Space Physics and Space Sensorics at the Technical University of Braunschweig, Germany.

While 67P C-G’s song probably won’t make the Top 40, we might listen to it just as we would any other piece of music to learn what message is being communicated.

Earth’s Lightning Ramps Up With The Solar Wind: Study

Time-lapse photo of several lightning strikes at night. Credit: NOAA Photo Library, NOAA Central Library; OAR/ERL/National Severe Storms Laboratory (NSSL)

As the northern hemisphere enters the hazy days of summer, thunderstorms will freckle many of our nights and days. What causes these sudden bursts of light that flash through the sky? Previous research showed that one cause is cosmic rays from space, generated by supernovas. But a new paper shows that something much closer and powerful is also responsible: solar wind from our own Sun.

First, a quick primer on what the solar wind is. It’s a continuous stream of particles from the Sun, and it tends to pick up when the Sun emits solar flares. These flares are more frequent when sunspots are in greater numbers on the star’s surface, which happens when the Sun’s magnetic activity increases. The Sun’s activity falls and rises on an 11-year cycle, and 2014 happens to be close to the peak of one of those cycles.

“Our main result,” said lead author Chris Scott (of the University of Reading) in a statement, “is that we have found evidence that high-speed solar wind streams can increase lightning rates. This may be an actual increase in lightning or an increase in the magnitude of lightning, lifting it above the detection threshold of measurement instruments.”

The researchers discovered “a substantial and significant increase in lightning rates” for up to 40 days after solar winds hit Earth’s atmosphere. The reasons behind this are still poorly understood, but the researchers say this could be because the air’s electrical charge changes as the particles (which are themselves electrically charged) hit the atmosphere.

If this is proven, this could give a new nuance to weather forecasters who could incorporate information about solar wind streams that are being watched by spacecraft. This stream of particles would change with the sun’s 27-day rotation, and researchers hope this could improve long-range forecasts.

The study is based on UK Met Office lightning strike data in the United Kingdom between 2000 and 2005, more specifically anything that happened within 500 kilometers (310 miles) of central England. They also used data from NASA’s Advanced Composition Explorer (ACE), a spacecraft that examines the solar wind.

After each event, the researchers uncovered an average of 422 lightning strikes in the United Kingdom in the next 40 days, compared to an average of 321 lightning strikes in between these events. (The peak was about 12 to 18 days after an event.)

Artist's impression of the solar wind from the sun (left) interacting with Earth's magnetosphere (right). Credit: NASA
Artist’s impression of the solar wind from the sun (left) interacting with Earth’s magnetosphere (right). Credit: NASA

The researchers pointed out that the magnetic field of Earth does deflect many of these particles, but in the cases observed the particles would have been energetic enough to move into “cloud-forming regions” of the Earth’s atmosphere.

“We propose that these particles, while not having sufficient energies to reach the ground and be detected there, nevertheless electrify the atmosphere as they collide with it, altering the electrical properties of the air and thus influencing the rate or intensity at which lightning occurs,” Scott stated.

You can read more about the paper in Environmental Research Letters.

Source: IOP Publishing

Evidence of Internal Moon Water Found

The central peak of Bullialdus crater (Credit: NASA/GSFC/Arizona State University)

Scientists have detected magmatic water — water that originates from deep within the Moon’s interior — on the surface of the Moon. These findings represent the first such remote detection of this type of lunar water, and were arrived at using data from NASA’s Moon Mineralogy Mapper (M3) carried aboard India’s Chandrayaan-1 lunar orbiter.

The discovery represents an exciting contribution to the rapidly changing understanding of lunar water according to Rachel Klima, a planetary geologist at the Johns Hopkins University Applied Physics Laboratory (APL) in Laurel, Md., and lead author of the paper, “Remote detection of magmatic water in Bullialdus Crater on the Moon” published in the August 25 issue of the journal Nature Geoscience.

Chandrayaan-1, India’s first  mission to the Moon, entered lunar orbit on Nov. 8, 2008

“For many years, researchers believed that the rocks from the Moon were ‘bone dry’ and that any water detected in the Apollo samples had to be contamination from Earth,” said Klima, a member of the NASA Lunar Science Institute’s (NLSI) Scientific and Exploration Potential of the Lunar Poles team. “About five years ago, new laboratory techniques used to investigate lunar samples revealed that the interior of the Moon is not as dry as we previously thought. Around the same time, data from orbital spacecraft detected water on the lunar surface, which is thought to be a thin layer formed from solar wind hitting the lunar surface.”

Read more: The Moon’s Water Comes From the Sun

“This surficial water unfortunately did not give us any information about the magmatic water that exists deeper within the lunar crust and mantle, but we were able to identify the rock types in and around Bullialdus crater,” said co-author Justin Hagerty, of the U.S. Geological Survey. “Such studies can help us understand how the surficial water originated and where it might exist in the lunar mantle.”

LRO image of the 60-km Bullialdus crater (NASA/GSFC/Arizona State University)

M3 (pronounced “M-cube”) fully imaged the large impact crater Bullialdus in 2009. “It’s within 25 degrees latitude of the equator and so not in a favorable location for the solar wind to produce significant surface water,” Klima explained. “The rocks in the central peak of the crater are of a type called norite that usually crystallizes when magma ascends but gets trapped underground instead of erupting at the surface as lava. Bullialdus crater is not the only location where this rock type is found, but the exposure of these rocks combined with a generally low regional water abundance enabled us to quantify the amount of internal water in these rocks.”

See detailed reports of M3 data regarding hydroxyls in Bullialdus crater from NASA’s Lunar Planetary Institute (LPI) here.

The M3 instrument (Credit: ISRO)

After examining the M3 data, Klima and her colleagues found that the crater has significantly more hydroxyl — a molecule consisting of one oxygen atom and one hydrogen atom — compared to its surroundings. “The hydroxyl absorption features were consistent with hydroxyl bound to magmatic minerals that were excavated from depth by the impact that formed Bullialdus crater,” Klima writes.

The internal magmatic water provides information about the Moon’s volcanic processes and internal composition, Klima said. “Understanding this internal composition helps us address questions about how the Moon formed, and how magmatic processes changed as it cooled. There have been some measurements of internal water in lunar samples, but until now this form of native lunar water has not been detected from orbit.”

“This impressive research confirms earlier lab analyses of Apollo samples, and will help broaden our understanding of how this water originated and where it might exist in the lunar mantle.”

– Yvonne Pendleton, NLSI Director

Source: JHUAPL News Release

Mercury Shows Off Its Reds, Whites, and Blues

An 11-color MESSENGER targeted image of Mercury's Tyagaraja crater

At first glance, the planet Mercury may bear a striking resemblance to our own Moon. True, both are heavily-cratered, airless worlds that hide pockets of ice inside polar shadows… but there the similarities end. In addition to being compositionally different than the Moon, Mercury also has surface features that you won’t find on the lunar surface — or anywhere else in the Solar System.

The picture above, part of an 11-color targeted image acquired by MESSENGER on April 25, 2013, shows the varied terrain found within the 97-kilometer-wide Tyagaraja crater located near Mercury’s equator. The reds, blues, greens, and oranges, much more saturated than anything we’d see with our own eyes, correspond to surface materials of different compositions… and the brightest spots within the crater are features called “hollows” that are truly unique to Mercury, possibly resulting from the planet’s close interaction with the solar wind.

First noted in September of 2011, hollows have been identified across many areas of Mercury. One hypothesis is that they’re formed by the sublimation of subsurface material exposed inside larger craters. Being so close to the Sun and lacking a protective atmosphere, Mercury is constantly being scoured by the solar wind — a relentless stream of charged particles that’s actively “sandblasting” exposed volatiles from the planet’s surface!

Read more about hollows here.

A previous MESSENGER image of hollows inside Tyagaraja crater

The reddish spot at the center of the crater in the top image is likely material surrounding a pyroclastic vent, which appear red and orange in MDIS images. The dark material that appears bluish is something called “low reflectance material” (LRM).

The image was acquired as a targeted high-resolution 11-color image set. Acquiring 11-color targets is a new MESSENGER campaign that began in March and utilizes all of the Wide-Angle Camera’s 11 narrow-band color filters. Because of the large data volume involved, only features of special scientific interest are targeted for imaging in all 11 colors.

Full of geologically interesting features the crater was named for Kakarla Tyagabrahmam, an 18th century composer of classical South Indian music.

The first spacecraft to establish orbit around Mercury in summer 2011, MESSENGER is capable of continuing orbital operations until early 2015.

Read more on the Johns Hopkins University APL MESSENGER site here.

Credits:  NASA/Johns Hopkins University Applied Physics Laboratory/Carnegie Institution of Washington

Evidence for Active Hollows Formation on Mercury

MESSENGER targeted-observation image of the interior of Eminescu crater

A recent image acquired by NASA’s MESSENGER spacecraft shows the interior of Eminescu, a youngish 130-km (80 mile) wide crater just north of Mercury’s equator. Eminescu made science headlines last year with MESSENGER’s discovery of curious eroded blotches called “hollows” scattered across its interior and surrounding its central peak, and now it looks like the spacecraft may have spotted some of these strange features in their earliest stages of formation along the inner edge of the crater’s rim.

First announced in September 2011, hollows have now been identified in many areas across Mercury. They had showed up in previous images as only bright spots, but once MESSENGER established orbit in March 2011 and began its high-resolution imaging of Mercury’s surface it soon became clear that these features were something totally new.

The lack of craters within hollows indicates that they are relatively young. It was suggested that they may be the result of an ongoing process on Mercury — a suggestion supported by this recent image, acquired on November 19, 2012.

In addition to the hollows seen in the smooth central part of the crater and around the base of the central peak, there are also some small bright spots visible within the knobby terrain extending from the base of the crater wall (see detail at right). These bright spots could well be very young hollows, revealing a process in action that is, as far as we know, unique to the planet Mercury.

It’s thought that hollows are formed by the solar wind constantly blasting Mercury’s surface, scouring away deposits of volatile materials in its crust that have been left exposed by impacts.

The image above shows an area about 42 km across. Read more on the MESSENGER mission site here.

 Image credit: NASA/Johns Hopkins University Applied Physics Laboratory/Carnegie Institution of Washington


The Moon’s Water Comes From the Sun

An image of debris, ejected from Cabeus crater and into the sunlight, about 20 seconds after the LCROSS impact. The inset shows a close-up with the direction of the sun and the Earth. Image courtesy of Science/AAAS

An image of water-filled debris ejected from Cabeus crater about 20 seconds after the 2009 LCROSS impact. Courtesy of Science/AAAS.

Comets? Asteroids? The Earth? The origins of water now known to exist within the Moon’s soil — thanks to recent observations by various lunar satellites and the impact of the LCROSS mission’s Centaur rocket in 2009 — has been an ongoing puzzle for scientists. Now, new research supports that the source of at least some of the Moon’s water is the Sun, with the answer blowing in the solar wind.


Spectroscopy research conducted on Apollo samples by a team from the University of Tennessee, University of Michigan and Caltech has revealed “significant amounts” of hydroxyl within microscopic glass particles found inside lunar soil, the results of micrometeorite impacts.

According to the research team, the hydroxyl “water” within the lunar glass was likely created by interactions with protons and hydrogen ions from the solar wind.

“We found that the ‘water’ component, the hydroxyl, in the lunar regolith is mostly from solar wind implantation of protons, which locally combined with oxygen to form hydroxyls that moved into the interior of glasses by impact melting,” said Youxue Zhang, Professor of Geological Sciences at the University of Michigan.

Hydroxyl is the pairing of a single oxygen atom to a single hydrogen atom (OH). Each molecule of water contains two hydroxyl groups.

Although such glass particles are widespread on the surface of the Moon — the researchers studied samples returned from Apollo 11, Apollo 16 and Apollo 17 missions — the water in hydroxyl form is not something that could be easily used by future lunar explorers. Still, the findings suggest that solar wind-derived hydroxyl may also exist on the surface of other airless worlds, like Mercury, Vesta or Eros… especially within permanently-shadowed craters and depressions.

“These planetary bodies have very different environments, but all have the potential to produce water,” said Yang Liu, University of Tennessee scientist and lead author of the team’s paper.

The discovery of hydroxyl within lunar glasses presents an “unanticipated, abundant reservoir” of water on the Moon, and possibly throughout the entire Solar System.

The study was published online Sunday in the journal Nature Geoscience.

Source: University of Michigan news release.

Inset image: a grain of lunar agglutinate glass from samples returned by Apollo astronauts (Yang Liu)