
Sometimes the Sun is quiet, and other times the Sun gets downright unruly. During the peak of its 11-year cycle, the surface of the Sun is littered with darker sunspots. And its from these sunspots that the Sun generates massive solar flares, which can spew radiation and material in our direction. What causes these flares, and how worried should we be about them in our modern age of fragile technology?
Continue reading “Astronomy Cast 321: Solar Flares”
Solar Activity Ramps Up as Giant Sunspot Group Turns to Face Earth
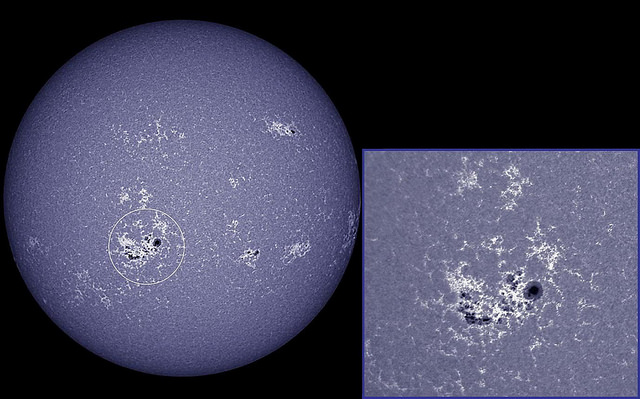
The Sun is finally acting like it’s in solar maximum. Our Sun has emitted dozens of solar flares in since Oct. 23, 2013, with at least six big X-class flares. Just today it blasted out a X1.1 flare at 04:32 UT (11:32 p.m. EST on Nov. 7, 2013). While old Sol had been fairly quiet for the time where it was supposed to be active in its normal 11-year cycle, only recently has activity ramped up with increased flares and sunspots. During 2013, there has been intermittent strong activity (like this and this in May), but the activity since mid-October is really the first extended period of activity.
Speaking of sunspots, a huge group called designated as AR 1890 has turned to face Earth. Thanks to astrophotographer Ron Cottrell for capturing the group today, above. Spaceweather.com reports that this sunspot has a trend of producing very brief flares. The X1-flare today was no exception as it lasted barely a minute. NOAA is forecasting a 60% chance of M-class solar flares and a 20% chance of X-flares on Nov. 8th from this sunspot group.
You can see an image from the Solar Dynamics Observatory below, as it recorded a flash of extreme UV radiation from the blast site:

Image Credit: NASA/SDO
NASA describes a solar flare as such:
A flare is defined as a sudden, rapid, and intense variation in brightness. A solar flare occurs when magnetic energy that has built up in the solar atmosphere is suddenly released. Radiation is emitted across virtually the entire electromagnetic spectrum, from radio waves at the long wavelength end, through optical emission to x-rays and gamma rays at the short wavelength end. The amount of energy released is the equivalent of millions of 100-megaton hydrogen bombs exploding at the same time.
While solar flares are powerful bursts of radiation, harmful radiation from a flare cannot pass through Earth’s atmosphere to physically affect humans on the ground. But when they are intense enough, they can disturb the atmosphere in the layer where GPS and communications signals travel.
You can keep track of the Sun’s activity at NOAA’s Space Weather Prediction Center and the Solar Dynamics Observatory website.
Planet Evaporates Due to Stellar Flare
Solar flares – huge eruptions of charged particles from the Sun – present little threat to Earth. On a few rare occasions these particles may disrupt our communications systems and cause radio blackouts. But they tend to be more aesthetically pleasing than harmful. It’s certainly a sight to be seen as these energetic particles collide with our atmosphere, resulting in a cascade of colorful lights – the aurora borealis.
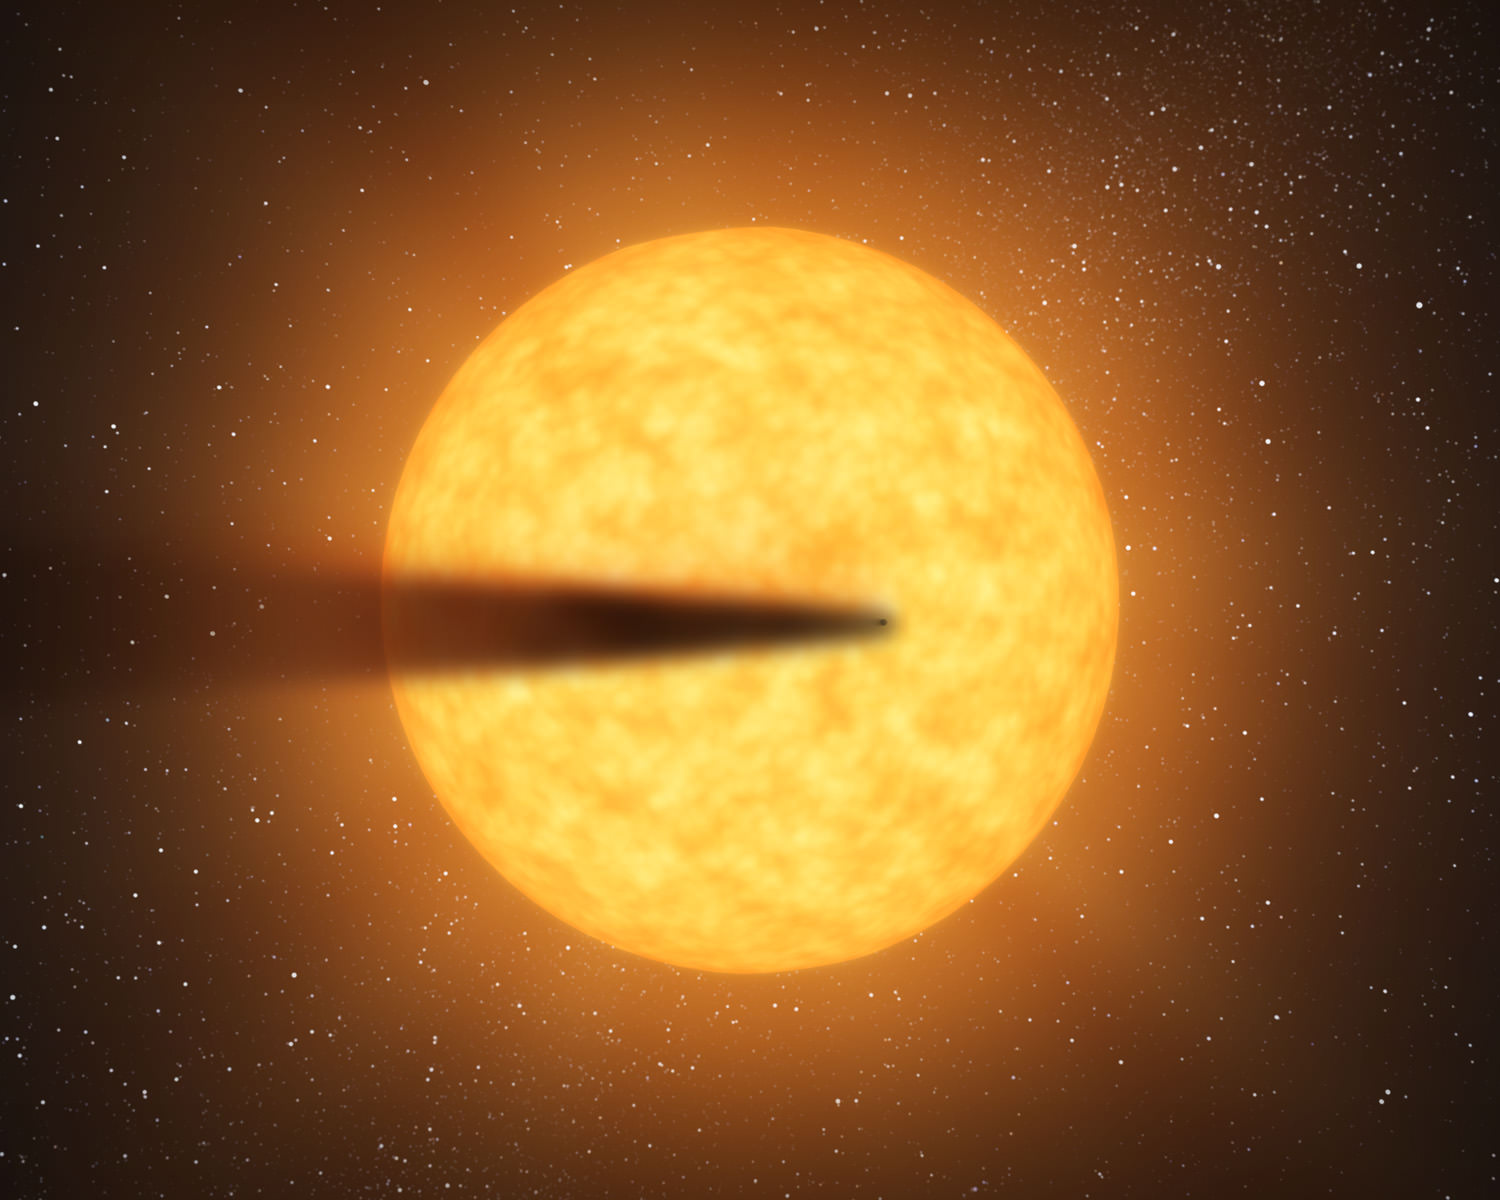
Fortunately our planet provides the protection necessary from such harmful space radiation. But not all planets are quite so lucky. Take for instance Kepler’s latest object of interest: KIC 12557548b, a super Mercury-size planet candidate. Astronomers have recently found that due to this star’s activity – producing massive stellar flares – the planet itself is evaporating.
Only last year, four different sources published evidence that this rocky planet was disintegrating. Thanks to Kepler, it quickly became clear that the total amount of light from KIC 12557548 as a function of time – the light curve of the system – dropped every 15.7 hours as a planet orbited it. But the amount of light blocked due to the transiting planet varied from 0.2% to more than 1.2%.
The amount of light blocked is dependent on the size of the planet. A Jupiter-size planet will block more light than a Mercury-size planet. The variations here suggest a range for the size of the planet: from a super Mercury-sized planet to a Jupiter-sized planet.
But this wasn’t the planet’s only enigma. It also has an asymmetric light curve. The total light from the star drops steadily as the planet begins its transit, plateaus as the planet fully covers the disk of the star, and then increases as the planet ends its transit. But the rate at which the light drops is much faster than the rate at which it increases. It takes longer for the light curve to return to its original brightness, hinting at a tail of debris that trails the planet, continuing to block light.
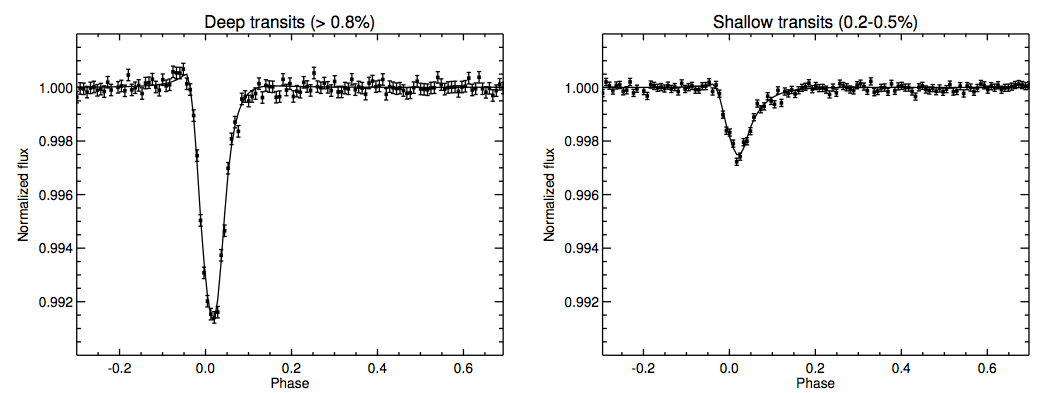
It appears that the planet is evaporating – emitting small particles of dust into orbit, which then trails behind it. The varying transit depth reflects the amount of dust currently evaporating.
Recently a team from the University of Tokyo analyzed the system in more detail, attempting to explain why this tiny planet is evaporating. “We found that the transit depth negatively correlates with the modulation of the stellar flux,” Dr. Kawahara, lead author on the study, told Universe Today. “The dust amount increases when the planet is located in front of the star spots.”
The transit depth does not vary randomly, but every 22.83 days. This coincides with the modulation of the stellar flux, or simply the stellar rotation period. Star spots may be indirectly detected by a star’s noticeable decrease in stellar flux. Because these star spots are large (much larger than sunspots) they last for long periods of time, and may be used to deduce the star’s rotation period.
Kawahara et al. found that the transit depth periodically varies with the stellar rotation rate – finding a correlation between stellar activity and the rate at which the planet is evaporating.
“Energy from the star spots increases the amount of dust and atmosphere from the planet,” explains Dr. Kawahara. The extreme heat and wind is enough to speed up the motions of the dust molecules; making them fast enough to escape the planet’s gravitational pull.
Future spectroscopic studies may search for molecules in the evaporating atmosphere of KIC 12557548b. But Dr. Kawahara remarks that due to the planet’s faintness it is unlikely. His best hope is that future studies may instead find a similar object closer to us, that may be more easy to study.
The finding is published in The Astrophysical Journal Letters and is available for download here.
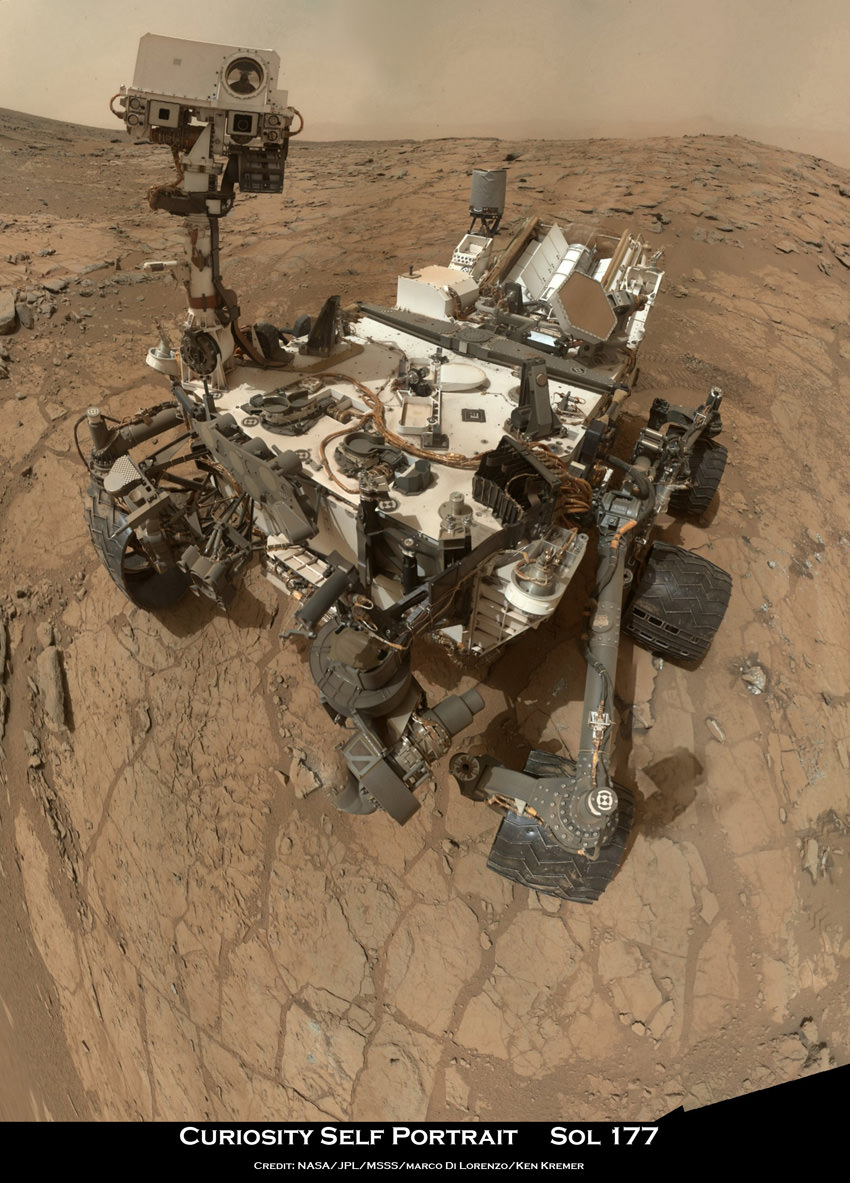
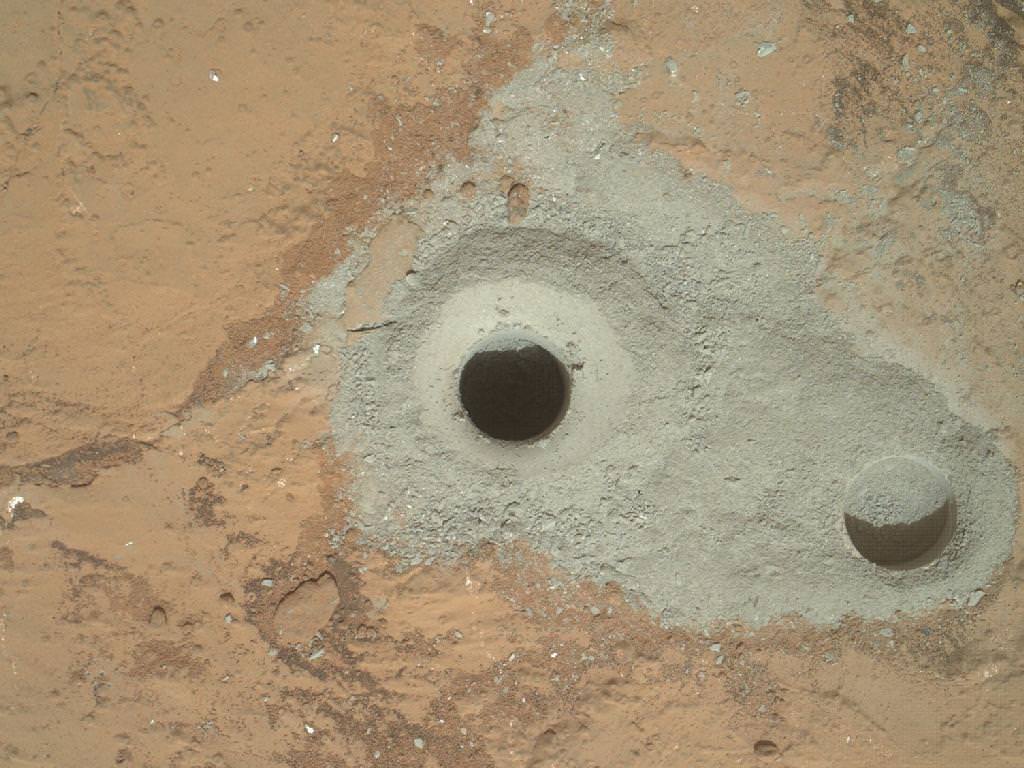
Solar Storm Blasting to Mars Shuts Down Curiosity – 1st Rocky Sample Results on tap
Due to a fast approaching solar storm, NASA has temporarily shut down surface operations of the Curiosity Mars Science Lab (MSL) rover.
NASA took the precautionary measure because ‘a big coronal mass ejection’ was predicted to hit Mars over the next few days starting March 7, or Martian Sol 207 of the mission, researchers said.
The rover team wants to avoid a repeat of the computer memory glitch that afflicted Curiosity last week, and caused the rover to enter a protective ‘safe mode’.
“The rover was commanded to go to sleep,” says science team member Ken Herkenhoff of the US Geological Survey (USGS).
“Space weather can by nasty!”
This is the 2nd shutdown of the 1 ton robot in a week. Curiosity had just been returned to active status over the weekend.
A full resumption of science operations had been anticipated for next week, but is now on hold pending the outcome of effects from the solar storm explosions.
“We are making good progress in the recovery,” said Mars Science Laboratory Project Manager Richard Cook, of NASA’s Jet Propulsion Laboratory, prior to the new solar flare.
“Storm’s a-comin’! There’s a solar storm heading for Mars. I’m going back to sleep to weather it out,” tweeted Curiosity.
Solar flares cause intense bursts of radiation that can damage spacecraft and also harm space faring astronauts, and require the installation of radiation shielding and hardening on space based assets.
Since Mars lacks a magnetic field, the surface is virtually unprotected from constant bombardment by radiation.
NASA’s other spacecraft exploring Mars were unaffected by the solar eruptions – including the long lived Opportunity rover and the orbiters; Mars Odyssey & Mars Reconnaissance Orbiter.
Curiosity has been in the midst of analyzing the historic 1st samples of gray rocky powder ever cored from the interior of a Martian rock about a month ago.
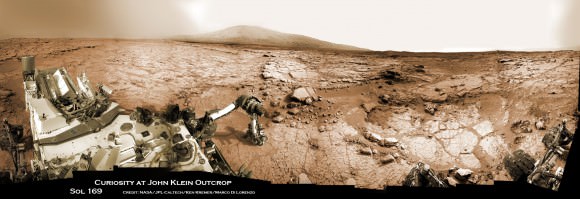 Curiosity accomplished Historic 1st drilling into Martian rock at John Klein outcrop on Feb 8, 2013 (Sol 182), shown in this context mosaic view of the Yellowknife Bay basin taken on Jan. 26 (Sol 169) where the robot is currently working. The robotic arm is pressing down on the surface at John Klein outcrop of veined hydrated minerals – dramatically back dropped with her ultimate destination; Mount Sharp. Credit: NASA/JPL-Caltech/Ken Kremer/Marco Di Lorenzo
Eventually, the six-wheeled mega rover will set off on a nearly year long trek to her main destination – the sedimentary layers of the lower reaches of the 3 mile (5 km) high mountain named Mount Sharp – some 6 miles (10 km) away.
So far Curiosity has snapped over 48,000 images and traveled nearly 0.5 miles.
Curiosity’s goal is to assess whether the Gale Crater area on Mars ever offered a habitable zone conducive for Martian microbial life, past or present.
The Truth About 2012: Killer Solar Flares Are a Physical Impossibility
NASA is trying to make sure that no one is taking the 2012 doomsday nonsense seriously, and just put out this video today detailing how a gigantic “killer solar flare” just ain’t gonna happen. Dr. Alex Young from the Goddard Space Flight Center explains how the Sun’s regular 11-year solar cycle is expected to peak in 2013 and 2014, not on December 21 of this year. Plus, this current solar cycle has been kind of a dud as far as wild activity goes, and scientists are not expecting the peak of this cycle to even be as strong as the previous one, which was rather mild.
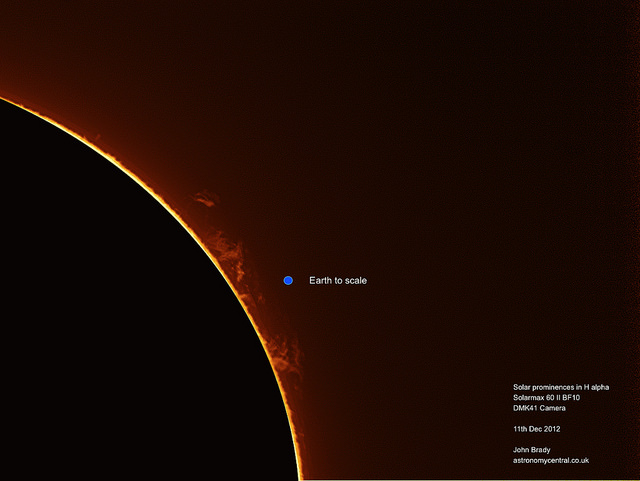
Solar prominence in H alpha, with Earth scale model. Credit: John Brady.
Not to mention, Earth’s atmosphere keeps us well protected here on Earth. The only thing we do have to be concerned with is how solar flares and coronal mass ejections (CMEs) can damage satellites and even impact the power grid on Earth; additionally astronauts in Space to have to be specially protected as they are outside of the protection of the atmosphere.
You can get more information in our detailed article “2012: No Killer Solar Flare.”
Fireworks from the Sun
From July 2 to July 5, the Sun shot off a whopping eighteen M-class solar flares. Most originated from Active Region 1515 and ranged from M1.1 to M6.1. On July 4th alone, there were seven M-class solar flares. According to SpaceWeather.com, big sunspot AR1515 appears to be on the verge of producing an X-class explosion. NOAA forecasters estimate an 80% chance of M-flares and a 10% chance of X-flares during the next 24 hours.
Continue reading “Fireworks from the Sun”
New Warning System Designed to Keep Astronauts Safe from Solar Storms

A new solar storm prediction system based in Antarctica could provide astronauts in space warning time of over two hours for them to take cover after massive flares or Coronal Mass Ejections erupt from the Sun. The South Pole Neutron Monitor is able to forecast the radiation intensity of solar protons using two different types of neutron detectors installed at the geographic South Pole, which measures gigaelectron volt neutrons that are produced during a solar storm.
The designers of the device have been testing it and say it could provide a warning times of up to 166 minutes, depending on the protons’ energy. Additionally, the team says, it is a practical system for forecasting peak intensity of solar energetic protons in the tens to hundreds of megaelectron volt energy range.
With activity on the Sun increasing as the Solar Maxiumum approaches, there will likely be heightened rates of flares and CMEs, putting at risk the human presence in space, which will likely be ever-increasing, with the advent of commercial space flights and NASA’s plans to send astronauts into deep space, along with crews of six that are usually on board the International Space Station. Even people in airplanes at high altitudes near the poles can be exposed to this increased radiation. Exposure can potentially cause radiation sickness, with symptoms such as fever and vomiting.
During a solar flare or CME, particles from the Sun can be accelerated to very high energies—in some cases traveling near the speed of light. Protons with energies surpassing 100 megaelectron volts essentially sandblast everything in their path.
S.Y. Oh from Chungnam National University in South Korea and an international team of researchers have created and installed the warning system at the Amundsen-Scott South Pole Station. Using one detector located indoors and another outside, they can measure the intensity of the much faster gigaelectron volt neutrons also produced during a solar storm when protons interact with Earth’s atmosphere. By combining the observations of the two detectors, they can then extrapolate this spectrum to estimate the peak intensity and event-averaged flux (fluence) of the later-arriving megaelectron volt protons.
The team compared their predictions for 12 solar events against observations made by geosynchronous satellites, such as some of the GOES satellites, and found their measurements were similar for intensity and fluence predictions for protons with energies higher than 40 and 80 megaelectron volts, respectively.
The researchers say the system could be useful for forecasting radiation hazard, because peak intensity and fluence are closely related to the known medical thresholds of radiation doses.
The lead times would allow for astronauts to take shelter in a shielded area of their spacecraft, or polar-flying airplanes ample time to reduce their altitude to be protected by Earth’s magnetic field.
Read the team’s paper: South Pole neutron monitor forecasting of solar proton radiation intensity
Lead image caption: The South Pole neutron monitor. Credit: University of Delaware.
Source: AGU
A Close-up Look at the Massive Solar Storm that Shook the Sun
Here’s a close look at the large X5.4 solar flare that erupted on the Sun on March 7, 2012 at 00:28 UT, (7:28 PM EST on March 6). These high-definition views from the Solar Dynamics Observatory also show the subsequent solar tsunami that rippled across the Sun, appearing as though the Sun ‘shook’ from the force of the flare.
This storm is heading our way and will likely give Earth’s atmosphere and magnetosphere a little shake as well, but solar physicists aren’t sure yet what the full impact will be. NASA Goddard’s Space Weather Lab and NOAA Space Weather Prediction Center say surely there will be aurorae from this blast. Other potential impacts include some radio blackouts, single-event upsets to satellite operations, and airplane passengers in high latitude, high altitude flights may experience increased radiation exposures.
Continue reading “A Close-up Look at the Massive Solar Storm that Shook the Sun”
Sun Unleashes Powerful X-Class Solar Flare
The Sun has been quiet recently but early today (04:13 UTC on March 5, 2012) it unleashed a powerful X1-class solar flare and coronal mass ejection. The latest estimates indicate the CME will probably miss Earth, but hit Mercury and Venus. Even so, the science team from the Solar Dynamics Observatory says that high-latitude skywatchers should still be alert for auroras in the nights ahead. There was also an M2-class eruption from the same big and active sunspot, Active Region 1429, on March 4th which produced another, wider CME that might yet intersect Earth. The cloud is expected to deliver a glancing blow to our planet’s magnetic field on March 6th at 04:30 UT (+/- 7 hrs).
Check the latest forecast of the CME’s arrival from the NASA Goddard Space Weather Lab, which includes a great animation.
So, what’s the difference in the classes of solar flares and how could they affect us on Earth?
Continue reading “Sun Unleashes Powerful X-Class Solar Flare”
Something New On the Sun: SDO Spots a Late Phase in Solar Flares
The Sun’s surface dances. Giant loops of magnetized solar material burst up, twist, and fall back down. Some erupt, shooting radiation flares and particles out into space. Forced to observe this dance from afar, scientists use all the tools at their disposal to look for patterns and connections to discover what causes these great explosions. Mapping these patterns could help scientists predict the onset of space weather that bursts toward Earth from the Sun, interfering with communications and Global Positioning System (GPS) signals.
Analysis of 191 solar flares since May 2010 by NASA’s Solar Dynamics Observatory (SDO) has recently shown a new piece in the pattern: some 15 percent of the flares have a distinct “late phase flare” some minutes to hours later that has never before been fully observed. This late phase of the flare pumps much more energy out into space than previously realized.
“We’re starting to see all sorts of new things,” says Phil Chamberlin, deputy project scientist for SDO at NASA’s Goddard Space Flight Center in Greenbelt, Md. “We see a large increase in emissions a half-hour to several hours later, that is sometimes even larger than the original, traditional phases of the flare. In one case on November 3, 2010, measuring only the effects of the main flare would mean underestimating the amount of energy shooting into Earth’s atmosphere by 70 percent.”
The entire space weather system, from the Sun’s surface to the outer edges of the solar system, is dependent on how energy transfers from one event to another – magnetic reconnection near the Sun transferred to movement energy barreling across space to energy deposited into Earth’s atmosphere, for example. Better understanding of this late phase flare will help scientists quantify just how much energy is produced when the sun erupts.
The team found evidence for these late phases when SDO first began collecting data in May of 2010 and the Sun decided to put on a show. In that very first week, in the midst of an otherwise fairly quiet time for the sun, there sprouted some nine flares of varying sizes. Flare sizes are divided into categories, named A, B, C, M and X, that have long been defined by the intensity of the X-rays emitted at the flare’s peak as measured by the GOES (Geostationary Operational Environmental Satellite) satellite system. GOES is a NOAA-operated network of satellites that has been in geosynchronous orbit near Earth since 1976. One of the GOES satellites measures only X-ray emissions and is a crucial source of information on space weather that the sun sends our way.
That May 2010, however, SDO observed those flares with its multi-wavelength vision. It recorded data indicating that some other wavelengths of light weren’t behaving in sync with the X-rays, but peaked at other times.
“For decades, our standard for flares has been to watch the x-rays and see when they peak,” says Tom Woods, a space scientist at the University of Colorado, Boulder, Colo. who is first author on a paper on this subject that goes online September 7 in the Astrophysical Journal. “That’s our definition for when a flare goes off. But we were seeing peaks that didn’t correspond to the X-rays.” Woods says that at first they were worried the data were an anomaly or a glitch in the instruments. But as they confirmed the data with other instruments and watched the patterns repeat over many months, they began to trust what they were seeing. “And then we got excited,” he says.
Over the course of a year, the team used the EVE (for Extreme ultraviolet Variability Experiment) instrument on SDO to record data from many more flares. EVE doesn’t snap conventional images. Woods is the principal investigator for the EVE instrument and he explains that it collects all the light from the sun at once and then precisely separates each wavelength of light and measures its intensity. This doesn’t produce pretty pictures the way other instruments on SDO do, but it provides graphs that map out how each wavelength of light gets stronger, peaks, and diminishes over time. EVE collects this data every 10 seconds, a rate guaranteed to provide brand new information about how the sun changes, given that previous instruments only measured such information every hour and a half or didn’t look at all the wavelengths simultaneously – not nearly enough information to get a complete picture of the heating and cooling of the flare.
[/caption]
Recording extreme ultraviolet light, the EVE spectra showed four phases in an average flare’s lifetime. The first three have been observed and are well established. (Though EVE was able to measure and quantify them over a wide range of light wavelengths better than has ever been done.) The first phase is the hard X-ray impulsive phase, in which highly energetic particles in the sun’s atmosphere rain down toward the sun’s surface after an explosive event in the atmosphere known as magnetic reconnection. They fall freely for some seconds to minutes until they hit the denser lower atmosphere, and then the second phase, the gradual phase, begins. Over the course of minutes to hours, the solar material, called plasma, is heated and explodes back up, tracing its way along giant magnetic loops, filling the loops with plasma. This process sends off so much light and radiation that it can be compared to millions of hydrogen bombs.
The third phase is characterized by the Sun’s atmosphere — the corona –losing brightness, and so is known as the coronal dimming phase. This is often associated with what’s known as a coronal mass ejection, in which a great cloud of plasma erupts off the surface of the Sun.
But the fourth phase, the late phase flare, spotted by EVE was new. Anywhere from one to five hours later for several of the flares, they saw a second peak of warm coronal material that didn’t correspond to another X-ray burst.
“Many observations have spotted an increased extreme ultraviolet peak just seconds to minutes after the main phase of the flare, and this behavior is considered a normal part of the flare process. But this late phase is different,” says Goddard’s Chamberlin, who is also a co-author on the paper. “These emissions happen substantially later. And it happens after the main flare exhibits that initial peak.”
To try to understand what was happening, the team looked at the images collected from SDO’s Advanced Imaging Assembly (AIA) as well. They could see the main phase flare eruption in the images and also noticed a second set of coronal loops far above the original flare site. These extra loops were longer and become brighter later than the original set (or the post-flare loops that appeared just minutes after that). These loops were also physically set apart from those earlier ones.
“The intensity we’re recording in those late phase flares is usually dimmer than the X-ray intensity,” says Woods. “But the late phase goes on much longer, sometimes for multiple hours, so it’s putting out just as much total energy as the main flare that typically only lasts for a few minutes.” Because this previously unrealized extra source of energy from the flare is equally important to impacting Earth’s atmosphere, Woods and his colleagues are now studying how the late phase flares can influence space weather.
The late phase flare is, of course, just one piece of the puzzle as we try to understand the star with which we live. But keeping track of the energy, measuring all the different wavelengths of light, using all the instruments NASA has at its disposal, such information helps us map out all the steps of the Sun’s great dance.