Best Picture Yet Of Milky Way’s Formation 13.5 Billion Years Ago

The Milky Way is like NGC 4594 (pictured), a disc shaped spiral galaxy with around 200 billion stars. The three main features are the central bulge, the disk, and the halo. Credit: ESO

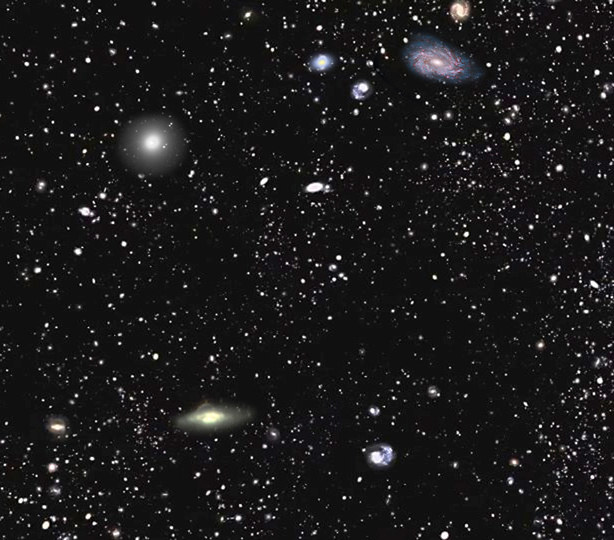
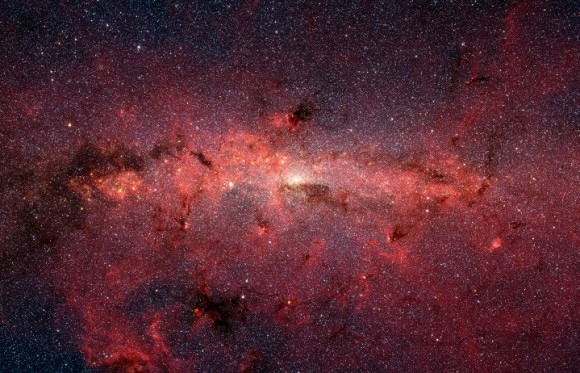
Maybe we take our beloved Milky Way galaxy for granted. As far as humanity is concerned, it’s always been here. But how did it form? What is its history?

Our Milky Way galaxy has three recognized stellar components. They are the central bulge, the disk , and the halo. How these three were formed and how they evolved are prominent, fundamental questions in astronomy. Now, a team of researchers have used the unique property of a certain type of star to help answer these fundamental questions.

The type of star in question is called the blue horizontal-branch star (BHB star), and it produces different colors depending on its age. It’s the only type of star to do that. The researchers, from the University of Notre Dame, used this property of BHB’s to create a detailed chronographic (time) map of the Milky Way’s formation.

This map has confirmed what theories and models have predicted for some time: the Milky Way galaxy formed through mergers and accretions of small haloes of gas and dust. Furthermore, the oldest stars in our galaxy are at the center, and younger stars and galaxies joined the Milky Way over billions of years, drawn in by the galaxy’s growing gravitational pull.

The team who produced this study includes astrophysicist Daniela Carollo, research assistant professor in the Department of Physics at the University of Notre Dame, and Timothy Beers, Notre Dame Chair of Astrophysics. Research assistant professor Vinicius Placco, and other colleagues rounded out the team.

“We haven’t previously known much about the age of the most ancient component of the Milky Way, which is the Halo System,” Carollo said. “But now we have demonstrated conclusively for the first time that ancient stars are in the center of the galaxy and the younger stars are found at longer distances. This is another piece of information that we can use to understand the assembly process of the galaxy, and how galaxies in general formed.”

This dazzling infrared image from NASA's Spitzer Space Telescope shows hundreds of thousands of stars crowded into the swirling core of our spiral Milky Way galaxy. Credit: NASA/JPL-Caltech
This dazzling infrared image from NASA’s Spitzer Space Telescope shows hundreds of thousands of stars crowded into the swirling core of our spiral Milky Way galaxy. Credit: NASA/JPL-Caltech

The Sloan Digital Sky Survey (SDSS) played a key role in these findings. The team used data from the SDSS to identify over 130,000 BHB’s. Since these stars literally “show their age”, mapping them throughout the Milky Way produced a chronographic map which clearly shows the oldest stars near the center of the galaxy, and youngest stars further away.

“The colors, when the stars are at that stage of their evolution, are directly related to the amount of time that star has been alive, so we can estimate the age,” Beers said. “Once you have a map, then you can determine which stars came in first and the ages of those portions of the galaxy. We can now actually visualize how our galaxy was built up and inspect the stellar debris from some of the other small galaxies being destroyed by their interaction with ours during its assembly.”

Astronomers infer, from various data-driven approaches, that different structural parts of the galaxy have different ages. They’ve assigned ages to different parts of the galaxy, like the bulge. That makes sense, since everything can’t be the same age. Not in a galaxy that’s this old. But this map makes it even clearer.

As the authors say in their paper, “What has been missing, until only recently, is the ability to assign ages to individual stellar populations, so that the full chemo-dynamical history of the Milky Way can be assessed.”

This new map, with over 130,000 stars as data points, is a pretty important step in understanding the evolution of the Milky Way. It takes something that was based more on models and theory, however sound they were, and reinforces it with more constrained data.

Update: The chronographic map, as well as a .gif, can be viewed here.

Dark Energy Illuminated By Largest Galactic Map Ten Years In The Making

A section of the 3D map constructed by BOSS. The rectangle on the far left shows a cutout of 1000 sq. degrees in the sky containing nearly 120,000 galaxies, or roughly 10% of the total survey. Credit: Jeremy Tinker/SDSS-III

In 1929, Edwin Hubble forever changed our understanding of the cosmos by showing that the Universe is in a state of expansion. By the 1990s, astronomers determined that the rate at which it is expanding is actually speeding up, which in turn led to the theory of “Dark Energy“. Since that time, astronomers and physicists have sought to determine the existence of this force by measuring the influence it has on the cosmos.

The latest in these efforts comes from the Sloan Digital Sky Survey III (SDSS III), where an international team of researchers have announced that they have finished creating the most precise measurements of the Universe to date. Known as the Baryon Oscillation Spectroscopic Survey (BOSS), their measurements have placed new constraints on the properties of Dark Energy.

The new measurements were presented by Harvard University astronomer Daniel Eisenstein at a recent meeting of the American Astronomical Society. As the director of the Sloan Digital Sky Survey III (SDSS-III), he and his team have spent the past ten years measuring the cosmos and the periodic fluctuations in the density of normal matter to see how galaxies are distributed throughout the Universe.

An illustration of the concept of baryon acoustic oscillations, which are imprinted in the early universe and can still be seen today in galaxy surveys like BOSS (Illustration courtesy of Chris Blake and Sam Moorfield).
An illustration of baryon acoustic oscillations, which are imprinted in the early universe and can still be seen today in galaxy surveys like BOSS. Credit: Chris Blake and Sam Moorfield

And after a decade of research, the BOSS team was able to produce a three-dimensional map of the cosmos that covers more than six billion light-years. And while other recent surveys have looked further afield – up to distances of 9 and 13 billion light years – the BOSS map is unique in that it boasts the highest accuracy of any cosmological map.

In fact, the BOSS team was able to measure the distribution of galaxies in the cosmos, and at a distance of 6 billion light-years, to within an unprecedented 1% margin of error. Determining the nature of cosmic objects at great distances is no easy matter, due the effects of relativity. As Dr. Eisenstein told Universe Today via email:

“Distances are a long-standing challenge in astronomy. Whereas humans often can judge distance because of our binocular vision, galaxies beyond the Milky Way are much too far away to use that. And because galaxies come in a wide range of intrinsic sizes, it is hard to judge their distance. It’s like looking at a far-away mountain; one’s judgement of its distance is tied up with one’s judgement of its height.”

In the past, astronomers have made accurate measurements of objects within the local universe (i.e. planets, neighboring stars, star clusters) by relying on everything from radar to redshift – the degree to which the wavelength of light is shifted towards the red end of the spectrum. However, the greater the distance of an object, the greater the degree of uncertainty.

 An artist's concept of the latest, highly accurate measurement of the Universe from BOSS. The spheres show the current size of the "baryon acoustic oscillations" (BAOs) from the early universe, which have helped to set the distribution of galaxies that we see in the universe today. Galaxies have a slight tendency to align along the edges of the spheres — the alignment has been greatly exaggerated in this illustration. BAOs can be used as a "standard ruler" (white line) to measure the distances to all the galaxies in the universe. Credit: Zosia Rostomian, Lawrence Berkeley National Laboratory
An artist’s concept of the latest, highly accurate measurement of the Universe from BOSS. Credit: Zosia Rostomian/Lawrence Berkeley National Laboratory

And until now, only objects that are a few thousand light-years from Earth – i.e. within the Milky Way galaxy – have had their distances measured to within a one-percent margin of error. As the largest of the four projects that make up the Sloan Digital Sky Survey III (SDSS-III), what sets BOSS apart is the fact that it relies primarily on the measurement of what are called “baryon acoustic oscillations” (BAOs).

These are essentially subtle periodic ripples in the distribution of visible baryonic (i.e. normal) matter in the cosmos. As Dr. Daniel Eisenstein explained:

“BOSS measures the expansion of the Universe in two primary ways. The first is by using the baryon acoustic oscillations (hence the name of the survey). Sound waves traveling in the first 400,000 years after the Big Bang create a preferred scale for separations of pairs of galaxies. By measuring this preferred separation in a sample of many galaxies, we can infer the distance to the sample. 

“The second method is to measure how clustering of galaxies differs between pairs oriented along the line of sight compared to transverse to the line of sight. The expansion of the Universe can cause this clustering to be asymmetric if one uses the wrong expansion history when converting redshifts to distance.”

With these new, highly-accurate distance measurements, BOSS astronomers will be able to study the influence of Dark Matter with far greater precision. “Different dark energy models vary in how the acceleration of the expansion of the Universe proceeds over time,” said Eisenstein. “BOSS is measuring the expansion history, which allows us to infer the acceleration rate. We find results that are highly consistent with the predictions of the cosmological constant model, that is, the model in which dark energy has a constant density over time.”

An international team of researchers have produced the largest 3-D map of the universe to date, which validates Einstein's theory of General Relativity. Credit: NAOJ/CFHT/ SDSS
Discerning the large-scale structure of the universe, and the role played by Dark Energy, is key to unlocking its mysteries. Credit: NAOJ/CFHT/ SDSS

In addition to measuring the distribution of normal matter to determine the influence of Dark Energy, the SDSS-III Collaboration is working to map the Milky Way and search for extrasolar planets. The BOSS measurements are detailed in a series of articles that were submitted to journals by the BOSS collaboration last month, all of which are now available online.

And BOSS is not the only effort to understand the large-scale structure of our Universe, and how all its mysterious forces have shaped it. Just last month, Professor Stephen Hawking announced that the COSMOS supercomputing center at Cambridge University would be creating the most detailed 3D map of the Universe to date.

Relying on data obtained by the CMB data obtained by the ESA’s Planck satellite and information from the Dark Energy Survey, they also hope to measure the influence Dark Energy has had on the distribution of matter in our Universe. Who knows? In a few years time, we may very well come to understand how all the fundamental forces governing the Universe work together.

Further Reading: SDSIII

Dwarf Galaxies That Dance? Andromeda Observations Reveal A Larger Cosmic Mystery

Astrophoto: Andromeda Galaxy by Fabio Bortoli
Andromeda Galaxy. Credit: Fabio Bortoli

What is up with these dwarf galaxies? A survey of thousands of galaxies using the Sloan Digital Sky Survey reveals something interesting, which was first revealed by looking at the massive Andromeda Galaxy nearby Earth: dwarf galaxies orbiting larger ones are often in disc-shaped orbits and not distributed randomly, as astronomers expected.

The finding follows on from research in 2013 that showed that 50% of Andromeda’s dwarf galaxies are in a single plane about a million light-years in diameter, but only 300,000 light-years thick. Now with the larger discovery, scientists suspect that perhaps there is a yet-to-be found process that is controlling gas flow in the cosmos.

“We were surprised to find that a large proportion of pairs of satellite galaxies have oppositely directed velocities if they are situated on opposite sides of their giant galaxy hosts,” stated lead author Neil Ibata of Lycée International in France.

“Everywhere we looked, we saw this strangely coherent coordinated motion of dwarf galaxies,” added Geraint Lewis, a University of Sydney physicist. “From this we can extrapolate that these circular planes of dancing dwarfs are universal, seen in about 50 percent of galaxies. This is a big problem that contradicts our standard cosmological models. It challenges our understanding of how the universe works, including the nature of dark matter.”

The astronomers also speculated this could show something unexpected in the laws of physics, such as motion and gravity, but added it would take far more investigation to figure that out.

The findings were published in the journal Nature.

Source: University of Sydney

Quasars Tell The Story Of How Fast The Young Universe Expanded

Artist's conception of how the Baryon Oscillation Spectroscopic Survey uses quasars to make measurements. The light these objects sends out gets absorbed by gas in between the receiver and the source. The gas is then "imprinted wiht a subtle ring-like pattern of known physical scale", the Sloan Digital Sky Survey stated. Credit: Zosia Rostomian (Lawrence Berkeley National Laboratory) and Andreu Font-Ribera (BOSS Lyman-alpha team, Berkeley Lab.)

For those who saw the Cosmos episode on William Herschel describing telescopes as time machines, here is a clear example of that. By examining 140,000 objects called quasars (galaxies with an active black hole at their centers), astronomers have charted the expansion rate of the universe — not now, but 10.8 billion years ago.

This is the most precise measurement ever of the universe’s expansion rate at any point in time, the science teams said, with the calculation showing the universe was expanding by 1% every 44 million years at that time. (That figure is to 2% precision, the researchers added.)

“If we look back to the Universe when galaxies were three times closer together than they are today, we’d see that a pair of galaxies separated by a million light-years would be drifting apart at a speed of 68 kilometers per second as the Universe expands,” stated Andreu Font-Ribera of the Lawrence Berkeley National Laboratory, who led one of the two analyses.

The researchers used a telescope called the Sloan Digital Sky Survey, a 2.5-meter telescope at Apache Point Observatory in New Mexico. The discovery was made during Sloan’s Baryon Oscillation Spectroscopic Survey, or BOSS, whose aim has been to figure out the expansion and acceleration of the universe.

The accelerating, expanding Universe. Credit: NASA/WMAP

“BOSS determines the expansion rate at a given time in the Universe by measuring the size of baryon acoustic oscillations (BAO), a signature imprinted in the way matter is distributed, resulting from sound waves in the early Universe,” the Sloan Digital Sky Survey stated. “This imprint is visible in the distribution of galaxies, quasars, and intergalactic hydrogen throughout the cosmos.”

Font-Ribera and his collaborators examined how quasars are distributed compared to hydrogen gas to calculate distance. The other analysis, led by Timothée Delubac (Centre de Saclay, France), examined the hydrogen gas to see patterns and measure mass distribution.

You can read more about Font-Ribera’s team’s research in preprint version on Arxiv. Delubac’s research does not appear to be available online, but the title is “Baryon Acoustic Oscillations in the Ly-alpha forest of BOSS DR11 quasars” and it has been submitted to Astronomy & Astrophysics.

Source: Sloan Digital Sky Survey

Dusty Galaxies Shine Across The Universe In New Herschel Survey

A portion of a collage of galaxies included in the Herschel Reference Survey, in false color to show different dust temperatures. (Blue is colder, and red is warmer). Credit: ESA/Herschel/HRS-SAG2 and HeViCS Key Programmes/L. Cortese (Swinburne University)

While dust is easy to ignore in small quantities (says the writer looking at her desk), across vast reaches of space this substance plays an important role. Stick enough grains together, the theory goes, and you’ll start to form rocks and eventually planets. On a galaxy-size scale, dust may even effect how the galaxy evolves.

A new survey of 323 galaxies reveals that dust is not only affected by the kinds of stars in the vicinity, but also what the galaxy is made of.

“These dust grains are believed to be fundamental ingredients for the formation of stars and planets, but until now very little was known about their abundance and physical properties in galaxies other than our own Milky Way,” stated lead author Luca Cortese, who is from the Swinburne University of Technology in Melbourne, Australia.

“The properties of grains vary from one galaxy to another – more than we originally expected,” he added. “As dust is heated by starlight, we knew that the frequencies at which grains emit should be related to a galaxy’s star formation activity. However, our results show that galaxies’ chemical history plays an equally important role.”

Galaxies in the Herschel Reference Survey in infrared/submillimeter wavelengths (with the Herschel space telescope, at left) and the Sloan Digital Sky Survey (right). Herschel's false-color image shows galaxies with cold dust (blue) and warm dust (red). Sloan highlights young stars (blue) and old stars (red). "Together, the observations plot young, dust-rich spiral/irregular galaxies in the top left, with giant dust-poor elliptical galaxies in the bottom right," the European Space Agency stated. Credit: ESA/Herschel/HRS-SAG2 and HeViCS Key Programmes/Sloan Digital Sky Survey/ L. Cortese (Swinburne University)
Galaxies in the Herschel Reference Survey in infrared/submillimeter wavelengths (with the Herschel space telescope, at left) and the Sloan Digital Sky Survey (right). Herschel’s false-color image shows galaxies with cold dust (blue) and warm dust (red). Sloan highlights young stars (blue) and old stars (red). “Together, the observations plot young, dust-rich spiral/irregular galaxies in the top left, with giant dust-poor elliptical galaxies in the bottom right,” the European Space Agency stated. Credit: ESA/Herschel/HRS-SAG2 and HeViCS Key Programmes/Sloan Digital Sky Survey/ L. Cortese (Swinburne University)

Data was captured with two cameras on the just-retired Herschel space telescope: Spectral and Photometric Imaging Receiver (SPIRE) and Photodetecting Array Camera and Spectrometer (PACS). These instruments examined different frequencies of dust emission, which shows what the grains are made of. You can see a few of those galaxies in the image above.

“The dust-rich galaxies are typically spiral or irregular, whereas the dust-poor ones are usually elliptical,” the European Space Agency stated. “Dust is gently heated across a range of temperatures by the combined light of all of the stars in each galaxy, with the warmest dust being concentrated in regions where stars are being born.”

Astronomers initially expected that a galaxy with speedy star formation would display more massive and warmer stars in it, corresponding to warmer dust in the galaxy emitting light in short wavelengths.

“However, the data show greater variations than expected from one galaxy to another based on their star formation rates alone, implying that other properties, such as its chemical enrichment, also play an important role,” ESA said.

You can read more about the research in the Monthly Notices of the Royal Astronomical Society or in preprint version on Arxiv.

Sources: Royal Astronomical Society and European Space Agency

Why the Asteroid Belt Doesn’t Threaten Spacecraft

Artist's impression of the asteroid belt. Image credit: NASA/JPL-Caltech

When you think of the asteroid belt, you probably imagine a region of rock and dust, with asteroids as far as the eye can see.  Such a visual has been popularized in movies, where spaceships must swerve left and right to avoid collisions.  But a similar view is often portrayed in more scientific imagery, such as the artistic rendering above.  Even the first episode of the new Cosmos series portrayed the belt as a dense collection of asteroids. But the reality is very different.  In reality the asteroid belt is less cluttered than often portrayed.  Just how much less might surprise you.

The Sloan digital sky survey (SDSS) has identified more than 100,000 asteroids in the solar system.  Not all of these lie within the asteroid belt, but there are about 80,000 asteroids in the belt larger than a kilometer.  Of course there are asteroids smaller than that, but they are more difficult to detect, so we aren’t exactly sure how many there are.

The pyramid-shaped zodiacal light cone is centered on the same path the sun and planets take across the sky called the ecliptic. This map shows the sky 90 minutes after sunset in early March facing west. Created with Stellarium

We have a pretty good idea, however, because the observations we have indicate that the size distribution of asteroids follows what is known as a power law distribution. For example, with a power law of 1, for every 100-meter wide asteroid there would be 10 with a diameter of 10 meters and 100 with a diameter of 1 meter. Based upon SDSS observations, asteroids seem to follow a power law of about 2, which means there are likely about 800 trillion asteroids larger than a meter within the belt. That’s a lot of rock. So much that sunlight scattering off the asteroid belt and other dust in the solar system is the source of zodiacal light.

But there is also a lot of volume within the asteroid belt. The belt can be said to occupy a region around the Sun from about 2.2 to 3.2 times the distance from the Earth to the Sun from the Sun (AU), with a thickness of about 1 AU. A bit of math puts that at about 50 trillion trillion cubic kilometers. So even though there are trillions of asteroids, each asteroid has billions of cubic kilometers of space on average. The asteroid belt is hardly something you would consider crowded. It should be emphasized that asteroids in the belt are not evenly distributed. They are clustered into families and groups. But even such clustering is not significant compared to the vast space it occupies.

An actual image from within the asteroid belt, taken from the NEAR probe as it was heading toward Eros (center). Credit: NASA
An actual image from within the asteroid belt, taken from the NEAR probe as it was heading toward Eros (center).
Credit: NASA

You can even do a very rough calculation to get an idea of just how empty the asteroid belt actually is. If we assumed that all the asteroids lay within a single plane, then on average there is 1 asteroid within an area roughly the size of Rhode Island. Within the entire United States there would be about 2000 asteroids, most of them only a meter across. The odds of seeing an asteroid along a cross-country road trip, much less hitting one, would be astoundingly small. So you can see why we don’t worry about space probes hitting an asteroid on their way to the outer solar system.  In fact, to get even close to an asteroid takes a great deal of effort.

An Incredible Visualization of Asteroids from the Sloan Digital Sky Survey

Illustration from Parker et al, 2008, of the decomposition of the main-belt asteroid population into families and background objects in proper a vs. sin(i) (left panels) and proper a vs. e (right panels). The top panels show all (background and family) objects in the data subset. The two middle panels show objects from 37 identi?ed families, and the bottom two panels show the background population. Credit: Parker et al, 2008.

Who knew asteroids could be so beautiful and mesmerizing? In 2008, a group of astronomers led by Alex Parker did a study of the size distribution of asteroid families using data from the Sloan Digital Sky Survey. Asteroid families often have distinctive optical colors, the team said, and they were able to offer an improved way to separate out the family members into their colors. This resultant animation put together just this week by Parker shows the orbital motions of over 100,000 asteroids, with colors illustrating the compositional diversity and relative sizes of the asteroids.

“The compositional gradient of the asteroid belt is clearly visible,” says Parker, “with green Vesta-family members in the inner belt fading through the blue C-class asteroids in the outer belt, and the deep red Trojan swarms beyond that.”

All main-belt asteroids and Trojan asteroids with orbits known to high precision are shown in the video and the animation is rendered with a timestep of 3 days. Via Twitter, Parker said this animation took — from start to finish — 20 hours to render on 8 CPUs.

For reference, the average orbital distances of Mercury, Venus, Earth, Mars, and Jupiter are illustrated with rings.

Painted Stone: Asteroids in the Sloan Digital Sky Survey from Alex Parker on Vimeo.

Holy Galaxify Batman! Galaxy Zoo Allows Users to Put Their Name in Big Lights

If you’re going to put your name in lights, you might as well go big; REALLY big. And with millions of galaxies forming all sorts of shapes including letters, numbers and punctuation, GalaxyZoo has created a way for you to do just that.

More than 250,000 people, sorting through about a million images, have taken part in the Galaxy Zoo project since its launch in 2007. “Their findings have ranged from the scientifically exciting to the weird and wonderful,” says the Galaxy Zoo team. And among the weird, the Zooites – that’s what project volunteers call themselves – have found an alphabet of galaxies.

The new “font,” available for anyone to use, is a way to thank all the Zooites for their hard work. But now a new challenge awaits.

Starting today, the Galaxy Zoo now has more than 250,000 new images of galaxies, most of which have never been seen by humans…. and the GZ team really wants them to be seen by humans!

But first, the reward:

Galaxy Zoo team member Dr. Steven Bamford, of the University of Nottingham, created the website at http://www.mygalaxies.co.uk allowing users to create a message in stars.

“We’d like to thank all those that have taken part in Galaxy Zoo in the past five years. Humans are better than computers at pattern recognition tasks like this, and we couldn’t have got so far without everyone’s help,” says Galaxy Zoo principal investigator Dr. Chris Lintott from the University of Oxford, in a press release. “Now we’ve got a new challenge, and we’d like to encourage volunteers old and new to get involved. You don’t have to be an expert — in fact we’ve found not being an expert tends to make you better at this task. There are too many images for us to inspect ourselves, but by asking hundreds of thousands of people to help us we can find out what’s lurking in the data.”

New images available at the Galaxy Zoo website come from large surveys with NASA‘s Hubble Space Telescope as well as ground-based imagery from the Sloan Digital Sky Survey.

“The two sources of data work together perfectly: the new images from Sloan give us our most detailed view of the local universe, while the CANDELS survey from the Hubble telescope allows us to look deeper into the universe’s past than ever before,” says Astronomer and Galaxy Zoo team member Kevin Schawinski from ETH Zurich in Switzerland.

Team members are quick to point out, however, that the quirky nature of the galactic alphabet is not the focus of Galaxy Zoo. Finding unusual galaxies that resemble animals and letters help scientists learn about galaxy interactions as well as the formation and evolution of the biggest structures in the Universe.

Image Credit: Sloan Digital Sky Survey, NASA Hubble Space Telescope and Galaxy Zoo


About the author:John Williams is owner of TerraZoom, a Colorado-based web development shop specializing in web mapping and online image zooms. He also writes the award-winning blog, StarryCritters, an interactive site devoted to looking at images from NASA’s Great Observatories and other sources in a different way. A former contributing editor for Final Frontier, his work has appeared in the Planetary Society Blog, Air & Space Smithsonian, Astronomy, Earth, MX Developer’s Journal, The Kansas City Star and many other newspapers and magazines.

Take a Flight Through Our Universe, Thanks to New 3-D Map of the Sky

The Sloan Digital Sky Survey III (SDSS-III) has released the largest three-dimensional map of massive galaxies and distant black holes ever created, and it pinpoints the locations and distances of over a million galaxies. It covers a total volume equivalent to that of a cube four billion light-years on a side.

A video released with the map takes viewers on an animated flight through the Universe as seen by SDSS. There are close to 400,000 galaxies in the animation, which places zoomed-in images of nearby galaxies at the positions of more distant galaxies mapped by SDSS.

“We want to map the largest volume of the universe yet, and to use that map to understand how the expansion of the universe is accelerating,” said Daniel Eisenstein (Harvard-Smithsonian Center for Astrophysics), the director of SDSS-III.

The map is the centerpiece of Data Release 9 (DR9), which publicly releases the data from the first two years of a six-year survey project. The release includes images of 200 million galaxies and spectra of 1.35 million galaxies. (Spectra take more time to collect than photographs, but provide the crucial third dimension by letting astronomers measure galaxy distances.)

“Our goal is to create a catalog that will be used long after we are done,” said Michael Blanton of New York University, who led the team that prepared Data Release 9.

The release includes new data from the ongoing SDSS-III Baryon Oscillation Spectroscopic Survey (BOSS), which will measure the positions of massive galaxies up to six billion light-years away, as well as quasars – giant black holes actively feeding on stars and gas – up to 12 billion light-years from Earth.

BOSS is targeting these big, bright galaxies because they live in the same places as other galaxies and they’re easy to spot. Mapping these big galaxies thus provides an effective way to make a map of the rest of the galaxies in the universe.

With such a map, scientists can retrace the history of the universe over the last six billion years. With that history, they can get better estimates for how much of the universe is made up of “dark matter” – matter that we can’t directly see because it doesn’t emit or absorb light – and “dark energy,” the even more mysterious force that drives the accelerating expansion of the universe.

“Dark matter and dark energy are two of the greatest mysteries of our time,” said David Schlegel of Lawrence Berkeley National Laboratory, the principal investigator of BOSS. “We hope that our new map of the universe can help someone solve the mystery.”

This release is being issued jointly with the SDSS-III Collaboration.

All the data are available now on the Data Release 9 website at http://www.sdss3.org/dr9. The new data are being made available to astronomers, as well as students, teachers, and the public. The SkyServer website includes lesson plans for teachers that use DR9 data to teach astronomy and other topics in science, technology, and math. DR9 data will also feature in a new release of the Galaxy Zoo citizen science project, which allows online volunteers to contribute to cutting-edge astronomy research.

Image caption: This is a still image from the fly-through video of the SDSS-III galaxies mapped in Data Release 9. Credit: Miguel A. Aragón (Johns Hopkins University), Mark SubbaRao (Adler Planetarium), Alex Szalay (Johns Hopkins University), Yushu Yao (Lawrence Berkeley National Laboratory, NERSC), and the SDSS-III Collaboration

Source: CfA

Galactic Gong – Milky Way Struck and Still Ringing After 100 Million Years

Small Magellanic Cloud

When galaxies collide, stars are thrown from orbits, spiral arms are stretched and twisted, and now scientists say galaxies ring like a bell long after the cosmic crash.

A team of astronomers from the United States and Canada say they have heard echoes of that ringing, possible evidence of a galactic encounter 100 million years ago when a small satellite galaxy or dark matter object passed through the Milky Way Galaxy; close to our position in the galaxy, as if a rock were thrown into a still pond causing the stars to bounce up and down on the waves. Their results were published in the Astrophysical Journal Letters.

“We have found evidence that our Milky Way had an encounter with a small galaxy or massive dark matter structure perhaps as recently as 100 million years ago,” said Larry Widrow, professor at Queen’s University in Canada. “We clearly observe unexpected differences in the Milky Way’s stellar distribution above and below the Galaxy’s midplane that have the appearance of a vertical wave — something that nobody has seen before.”

Astronomers took observations from about 300,000 nearby stars in the Sloan Digital Sky Survey. Stars move up and down at 20-30 kilometers per second while see-sawing around the galaxy at 220 kilometers per second. By comparison, the International Space Station putters around Earth at 7.71 kilometers per second; Voyager 1, the fastest man-made object, currently is leaving the solar system at about 17.46 kilometers per second. Widrow and colleagues at the University of Kentucky, The University of Chicago and Fermi National Accelerator Laboratory found that the positions of nearby stars is not quite as regular as previously thought. The team noticed a small but statistically significant difference in the distribution of stars above and below the midplane of the Milky Way.

“Our part of the Milky Way is ringing like a bell,” said Brian Yanny, of the Department of Energy’s Fermilab. “But we have not been able to identify the celestial object that passed through the Milky Way. It could have been one of the small satellite galaxies that move around the center of our galaxy, or an invisible structure such as a dark matter halo.”

Susan Gardner, professor of physics at the University of Kentucky added, “The perturbation need not have been a single isolated event in the past, and it may even be ongoing. Additional observations may well clarify its origin.”

Other possibilities considered for the variations were the effect of interstellar dust or simply the way the stars were selected in the survey. But as those events failed to explain fully the observations, the astronomers began to explore possible recent events in the history of the galaxy.

More than 20 visible satellite galaxies circle the Milky Way. Invisible satellites made up of dark matter, hypothetical matter that cannot be seen but is thought to make up a majority of the mass of the Universe, might also orbit our galaxy. Scientists believe that most of the mass orbiting the galaxy is in the form of dark matter. Using computer simulations to explore the effects of a small galaxy or dark matter structure passing through the disk of the Milky Way, the scientists developed a clearer picture of the see-saw effects they were seeing.

In terms of the nine-billion lifetime of the Milky Way Galaxy, the effects are short-lived. This part of the galaxy has been “ringing” for 100 million years and will continue for 100 million years more as the up-and-down motion dissipates, say the astronomers – unless we are hit again.

Image caption: The Small Magellanic Cloud is one of 20 visible satellite galaxies that orbit the Milky Way Galaxy. Astronomers report that a smaller counterpart or dark matter object passed through the Milky Way near our position about 100 million years ago.