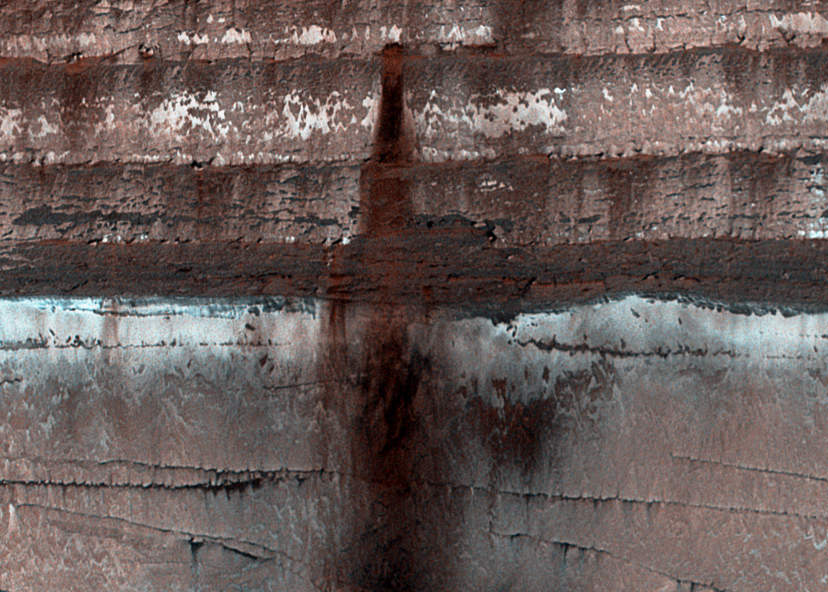
Loose soil, dust and rock stains an icy cliffside on Mars (NASA/JPL/University of Arizona)
Mars may be geologically inactive but that doesn’t mean there’s nothing happening there — seasonal changes on the Red Planet can have some very dramatic effects on the landscape, as this recent image from the HiRISE camera shows!
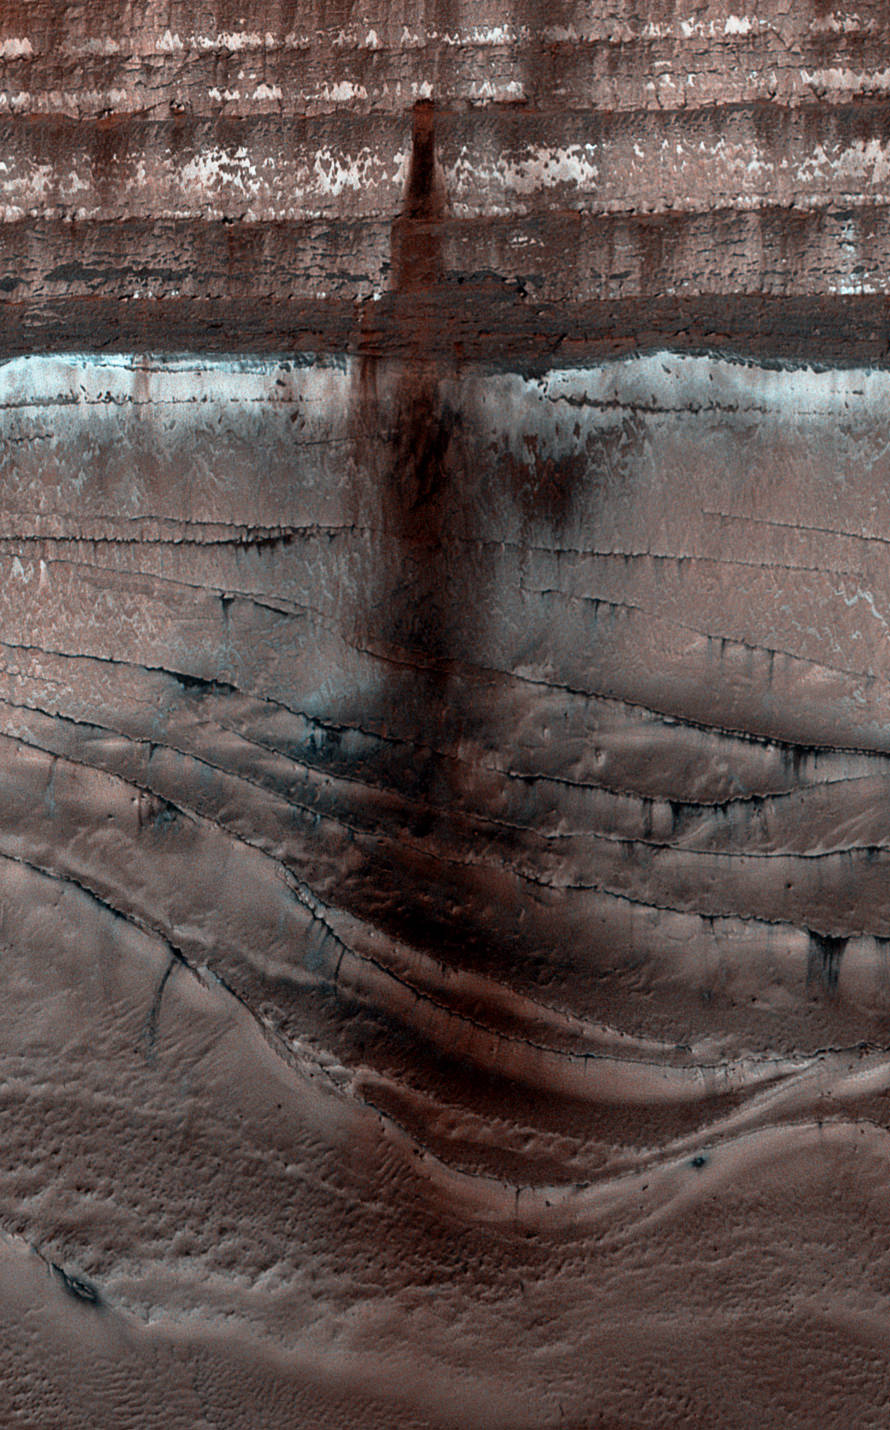
The full extent of the 1000-meter-long dusty landslide (NASA/JPL/University of Arizona)
When increasing light from the springtime Sun warms up the sides of sheer cliffs made from countless layers of water and carbon dioxide ice near Mars’ north pole, some of that CO2 ice sublimes, sending cascades of loose soil and dust down to the terraced base below. This uncovered material stains the frost-covered polar surface dark, outlining the paths of avalanches for HiRISE to easily spot from orbit. (See the original HiRISE image here.)
The rust-colored avalanche shown above has fallen hundreds of meters from the middle of a layered ice deposit, spreading nearly a kilometer across the frozen ridges at the base of the cliff. The view was acquired on Sept. 13, 2013.
Check out a video explaining this view and the processes that created it below, narrated by Phil Plait (aka the Bad Astronomer).
Mars’ seasonal polar caps are composed primarily of carbon dioxide frost. This frost sublimates (changes from solid directly to gas) in the spring, boosting the pressure of Mars’ thin atmosphere. In the fall the carbon dioxide condenses, causing the polar caps to reach as far as ~55 degrees latitude by late winter. By learning about current processes on a local level we can learn more about how to interpret the geological record of climate changes on Mars. (Source)
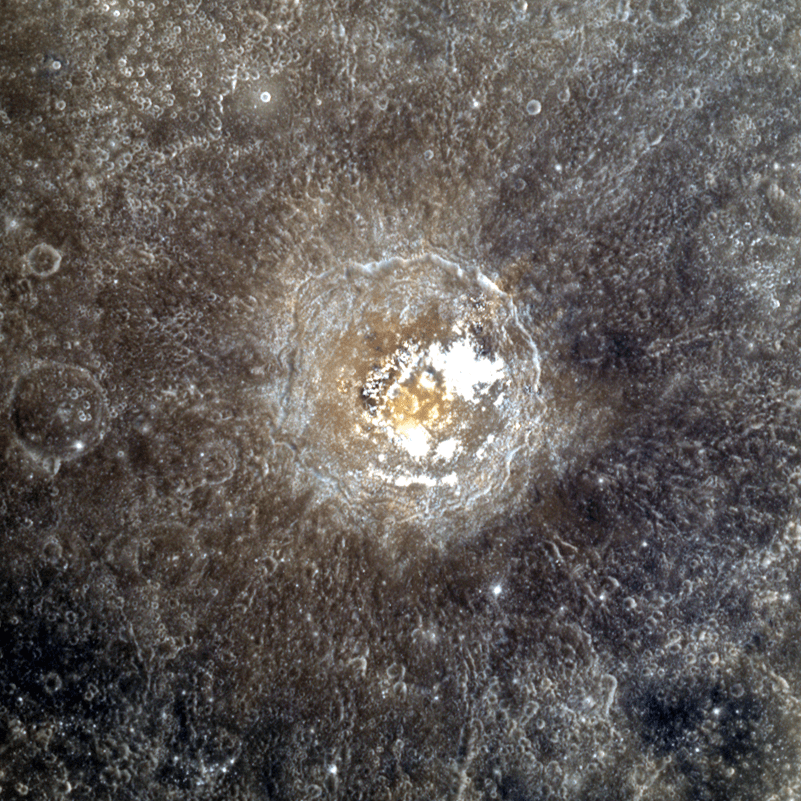
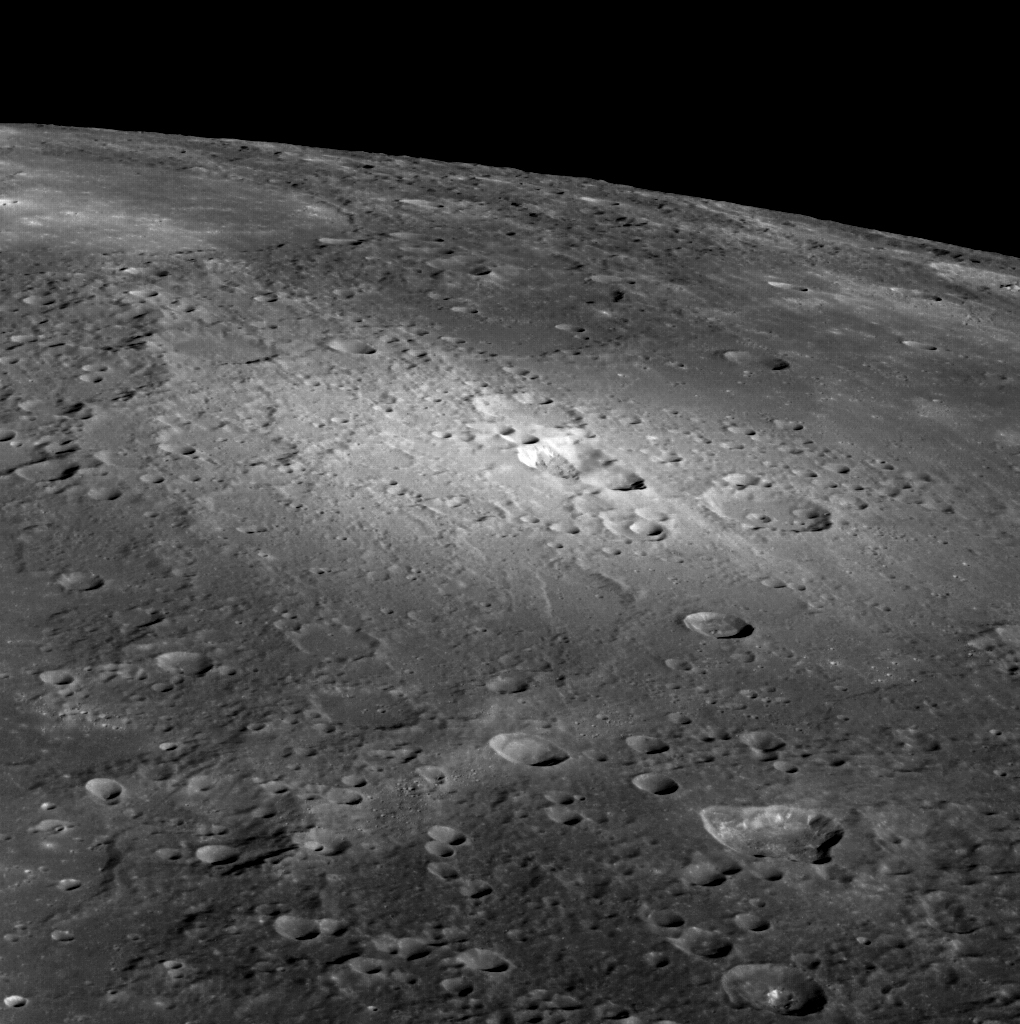
An oblique view of pyroclastic vents on Mercury via MESSENGER
Here on Earth we’re used to seeing volcanoes as towering mountains with steam-belching peaks or enormous fissures oozing lava. But on Mercury volcanic features often take the form of sunken pits surrounded by bright reflective material. They look like craters from orbit but are more irregularly-shaped, and here we have a view from MESSENGER of a cluster of them amidst a rugged landscape that stretches all the way to the planet’s limb.
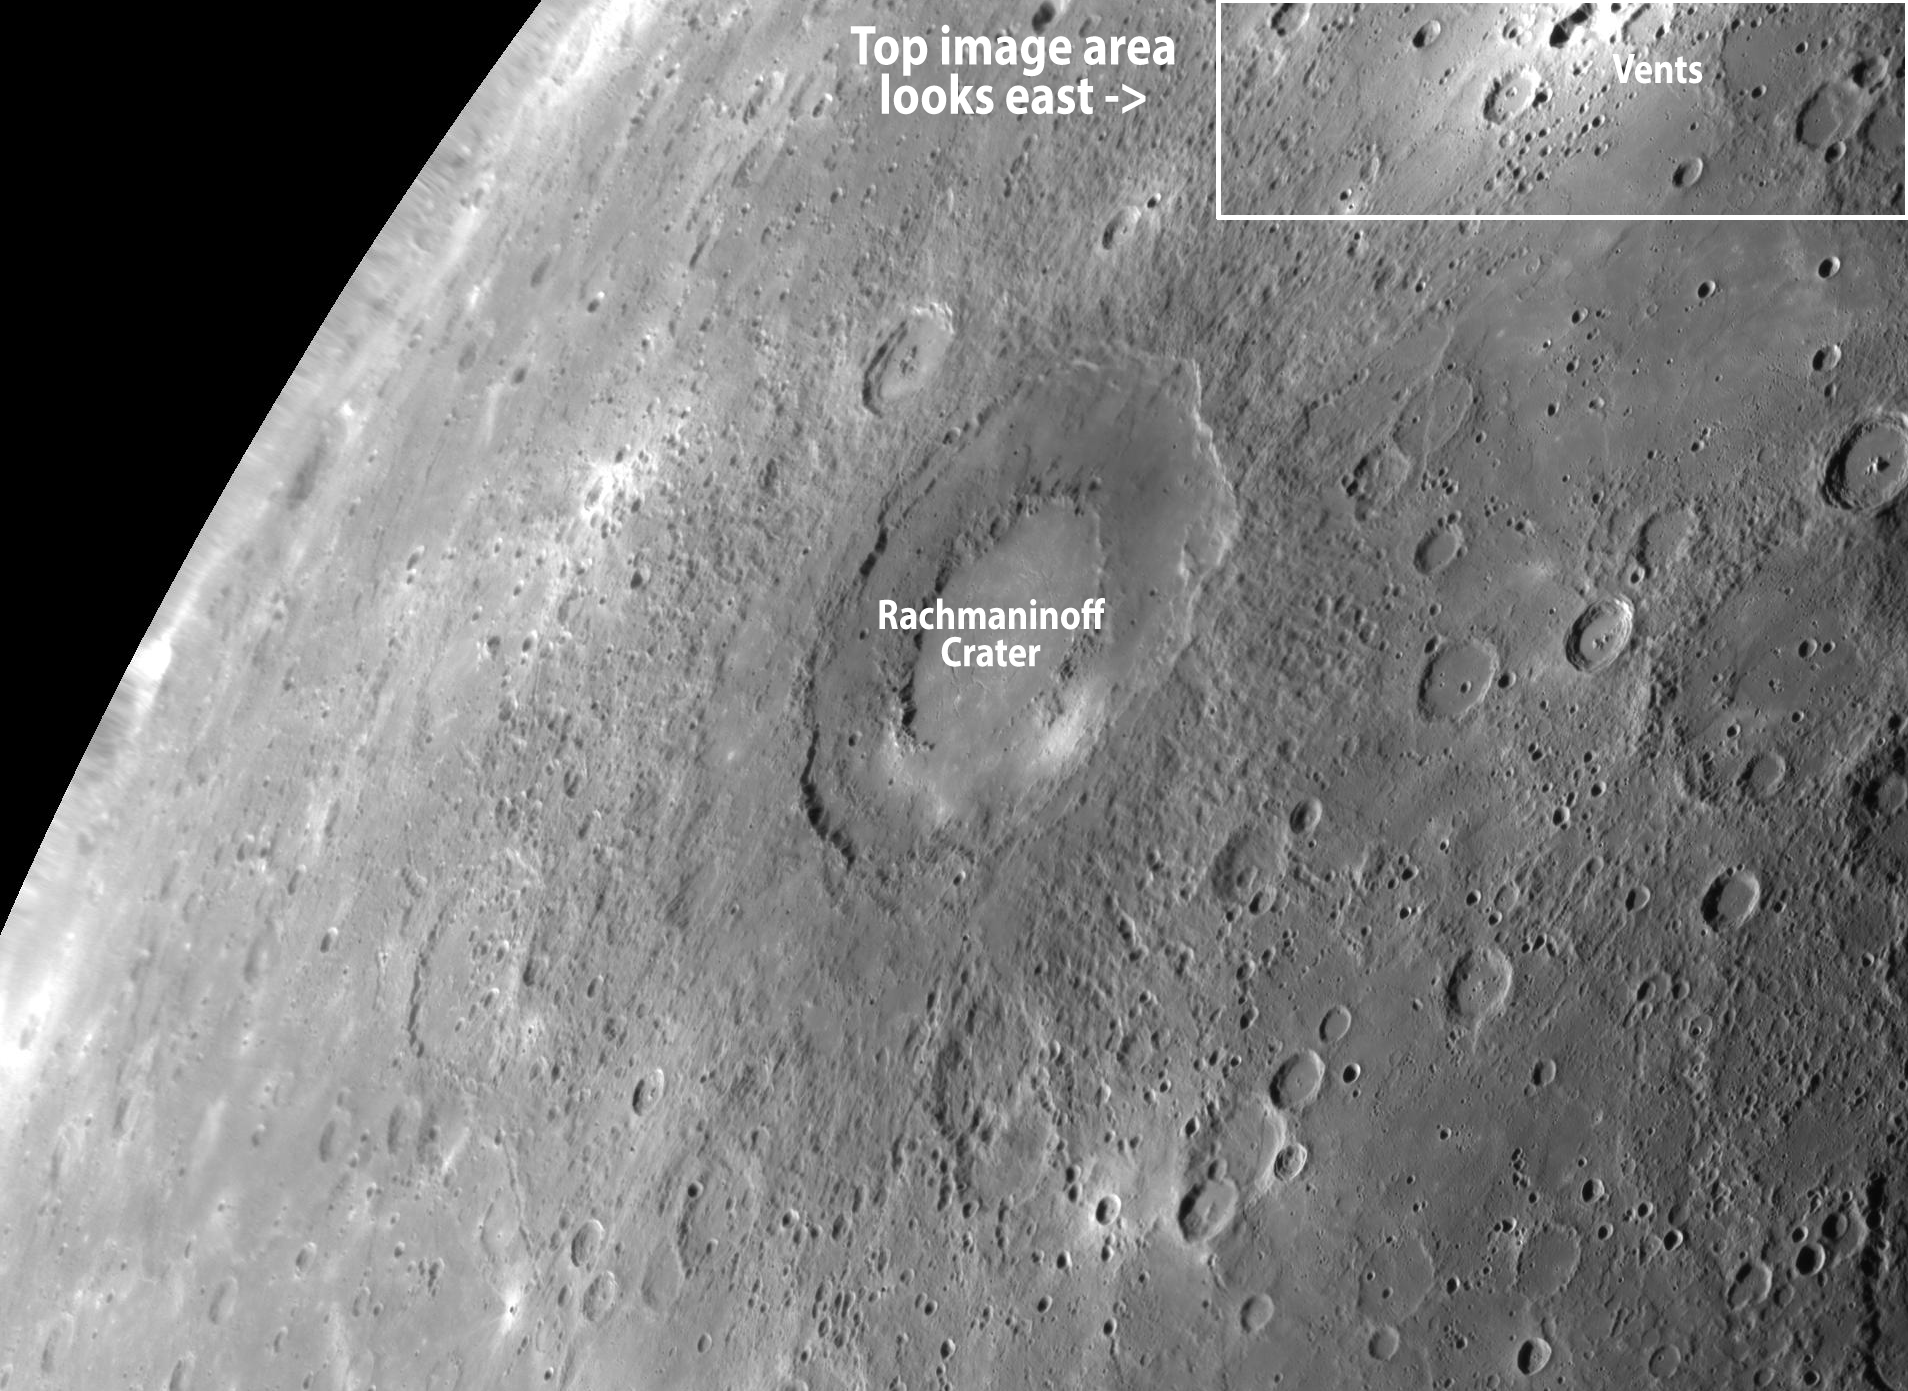
The image above shows a group of pyroclastic vents on Mercury, located just north and east of the 180-mile (290-km) -wide, double-ringed Rachmaninoff crater. The vents lie in the center of a spread of high-reflectance material, sprayed out by ancient eruptions. This bright blanket of material stands out against Mercury’s surface so well, it has even been spotted in Earth-based observations!
An older vent can be seen at the bottom right, looking like a crater but with non-circular walls. North is to the left.
So why do Mercury’s volcanoes look so different than Earth’s? Planetary scientist David Blewett from Johns Hopkins University Applied Physics Laboratory explains:
“Volcanism on Mercury (and also the Moon) appears to have been dominated by flood lavas, in which large quantities if highly fluid (low-viscosity) magma erupts and flows widely to cover a large area. In this type of eruption, no large ‘volcano’ edifice is constructed,” David wrote in an email. “The lunar maria and many of Mercury’s smooth plains deposits were formed in this manner.”
“On both the Moon and Mercury there are also examples of explosive activity in which eruptions from a vent showered the surroundings with pyroclastic material (volcanic ash),” he added. “The vents and bright pyroclastic halos seen near Rachmaninoff on Mercury are examples, as well as numerous ‘dark mantle deposits’ on the Moon.”
The discovery and investigation of vents like these is extremely valuable to scientists, as they provide information on Mercury’s formation, composition, and the nature of volatiles in its interior. (Plus the oblique angle is very cool! Makes you feel like you’re flying along with MESSENGER over Mercury’s surface.)
See below for a wider view of the region and context of the placement of these vents to Rachmaninoff.
MESSENGER image of Rachmaninoff crater obtained in September 2009
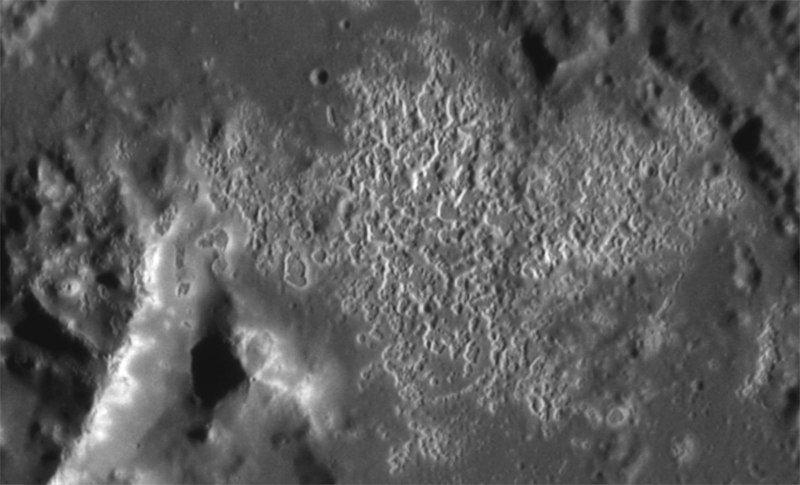
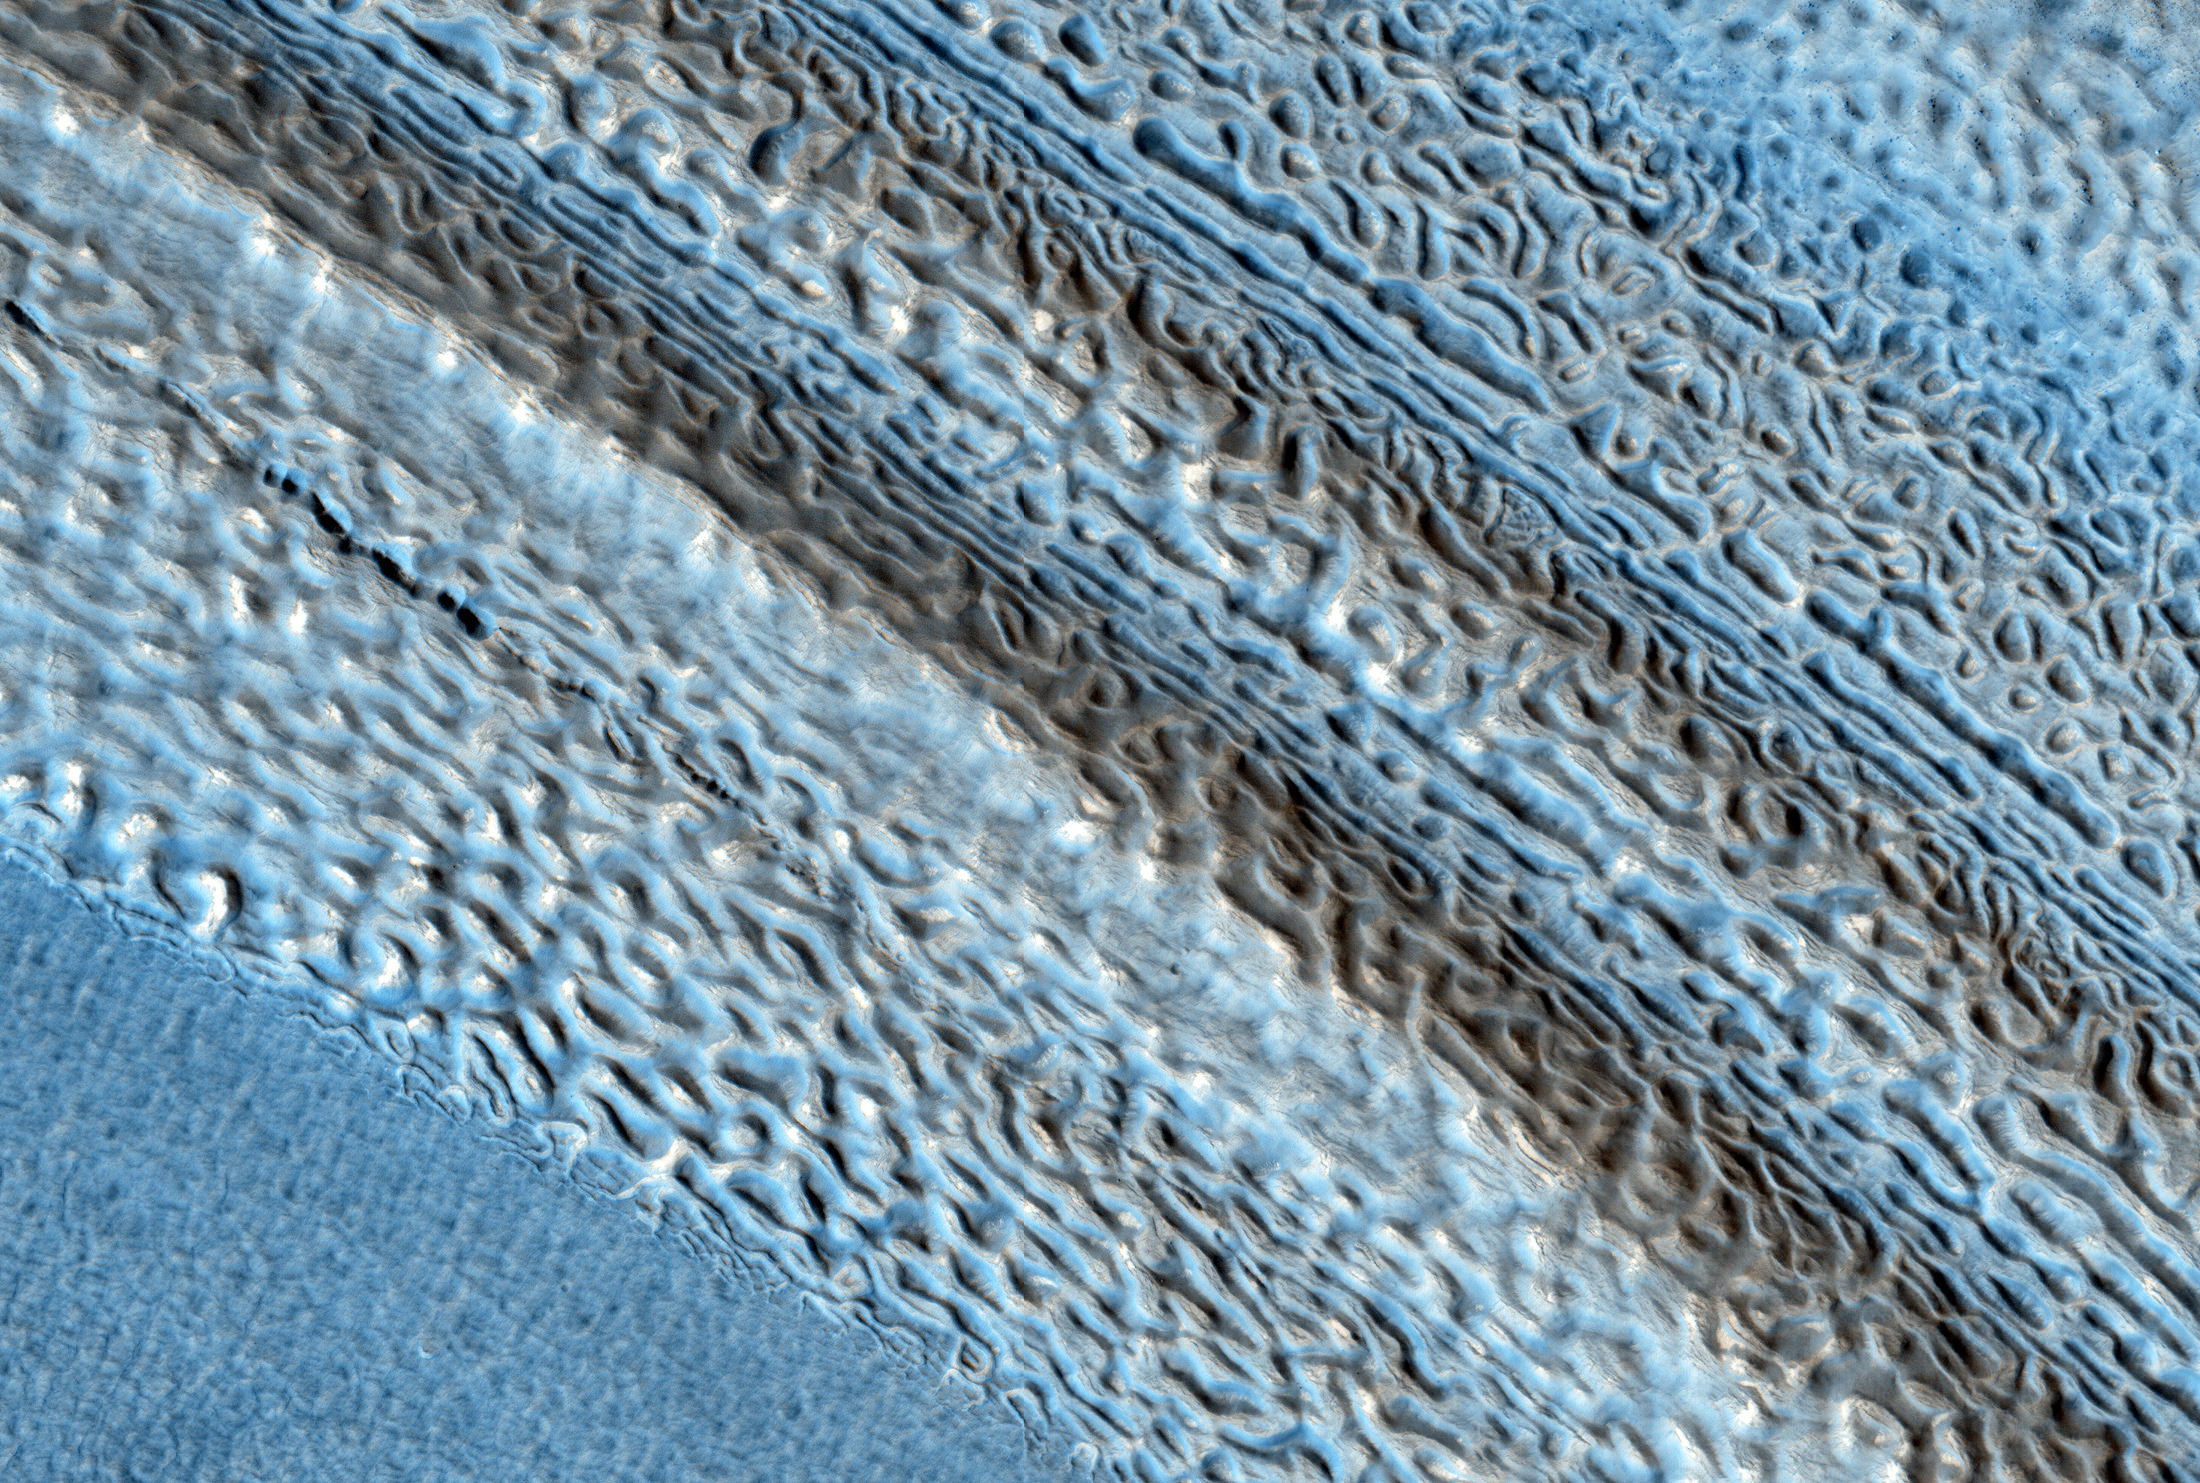
HiRISE image of lobate landforms called "brain terrain" that wrap around a small hill on Mars
It doesn’t take much thought to understand why this landscape on Mars is called “brain terrain” — the swirling lobes of ice, part of a large glacial deposit in Mars’ northern hemisphere, uncannily resemble the texture of a brain — or at the very least a brain coral!
What causes this strange landscape? Find out below:
It’s suggested that brain terrain is the result of the thermal stress and contraction, followed by sublimation, of these large ice deposits, laid down during a mid-latitude glaciation period ten to 100 million years ago. (Read more in this 2009 paper by Brown University’s Joseph Levy et al.)
This image was obtained by the HiRISE camera aboard the Mars Reconnaissance orbiter on August 23, 2013. See the original RGB color scan here.
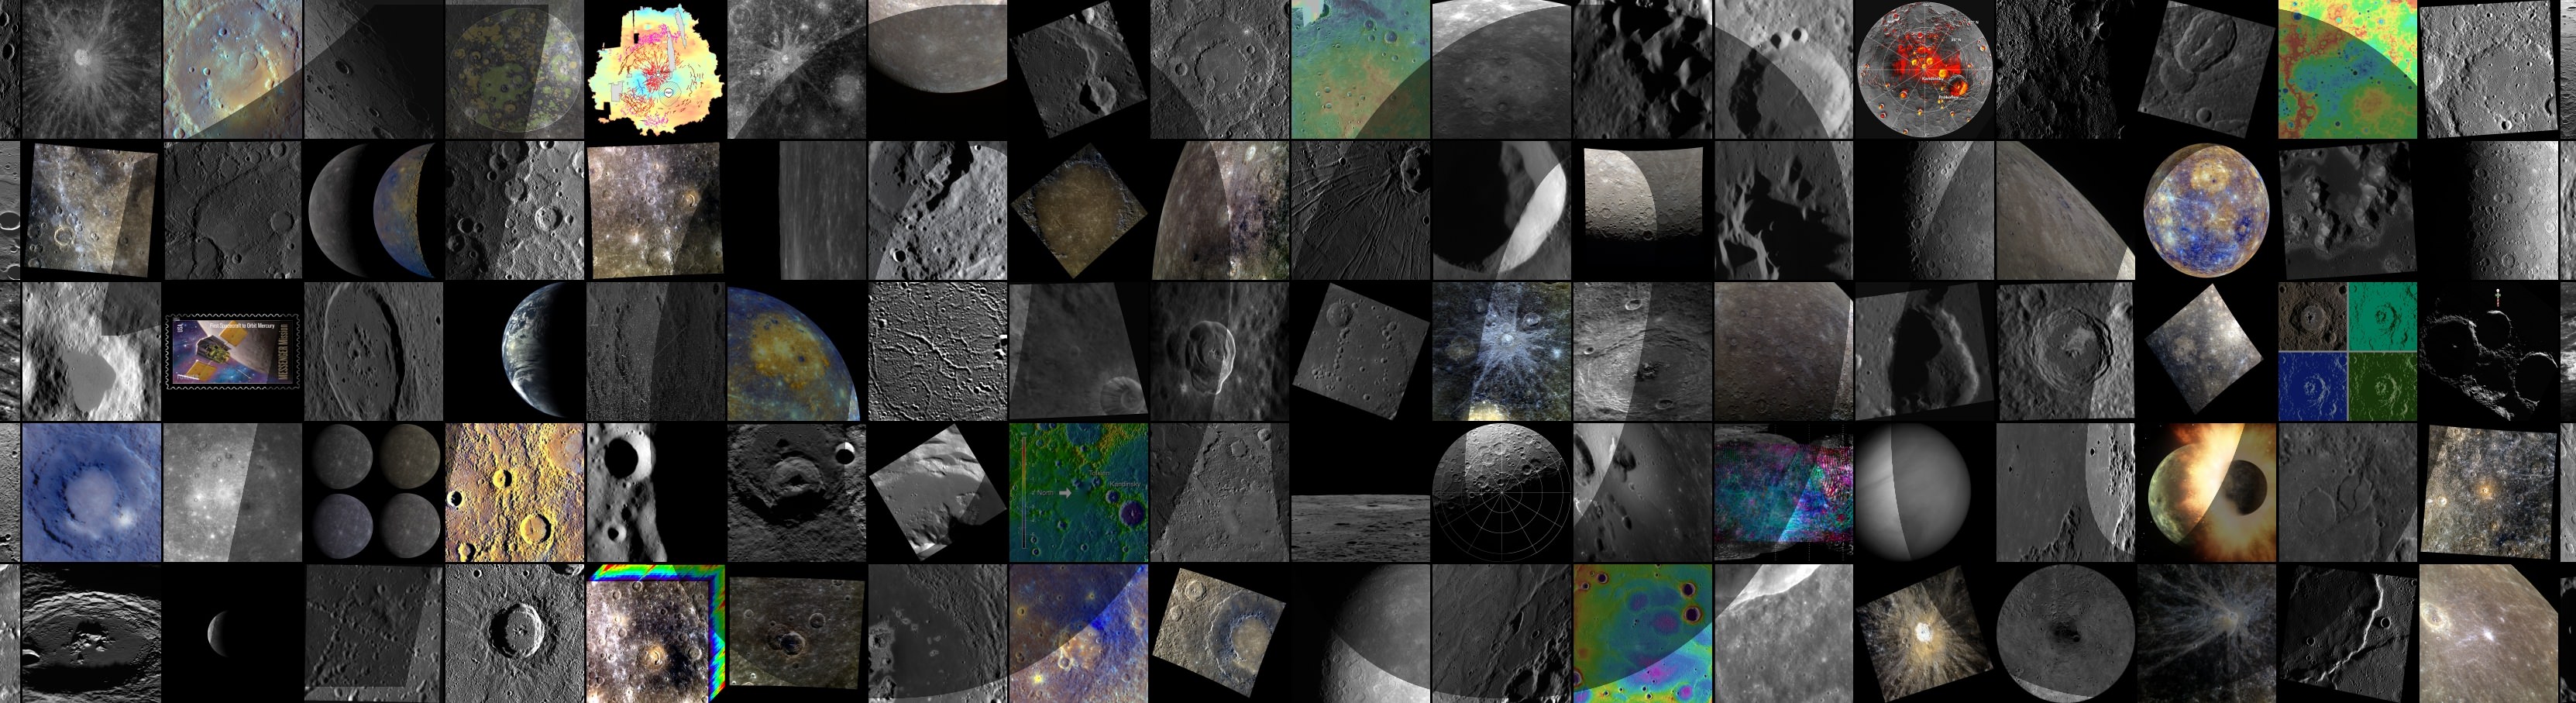
The MESSENGER team celebrates 1,000 featured images of the innermost planet!
It’s been nearly two and a half years since the NASA-sponsored MESSENGER mission entered orbit around Mercury — the first spacecraft ever to do so — and today the MESSENGER team celebrated the 1,000th featured image on the mission site with a mosaic of discovery highlights, seen above.
“I thought it sensible to produce a collage for the 1,000th web image because of the sheer volume of images the team has already posted, as no single picture could encompass the enormous breadth of Mercury science covered in these postings,” explained MESSENGER Fellow Paul Byrne, of the Carnegie Institution of Washington. “Some of the images represent aspects of Mercury’s geological characteristics, and others are fun extras, such as the U.S. Postal Service’s Mercury stamp. The ‘1,000’ superimposed on the collage is a reminder of the major milestone the team has reached in posting 1,000 featured images — and even a motivation to post 1,000 more.”
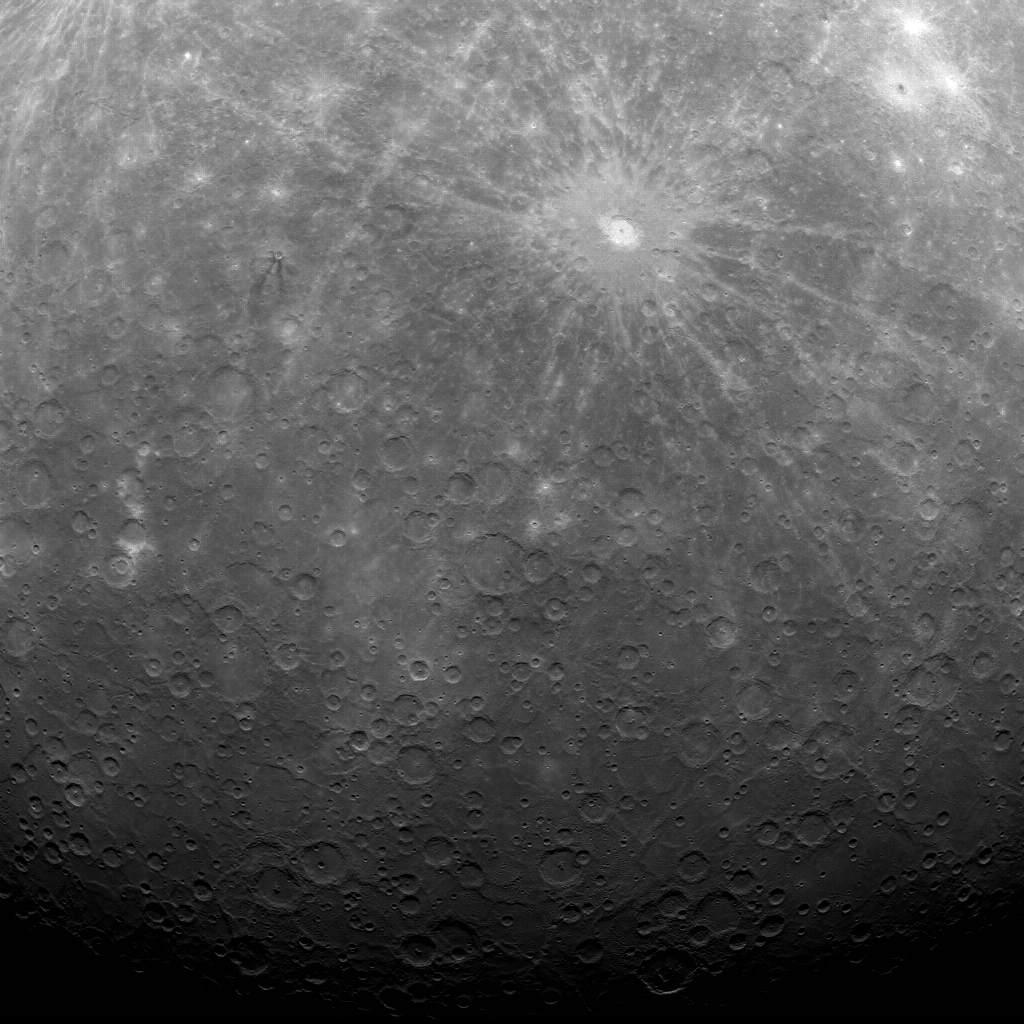
See the very first image MESSENGER obtained from orbit below:
The Mercury Dual Imaging System (MDIS) team has posted a new image to the MESSENGER website approximately once per business day since March 29, 2011, when this first image of Mercury’s surface obtained from orbit was made public.
“During this two-year period, MESSENGER’s daily web image has been a successful mechanism for sharing results from the mission with the public at large,” said Nancy Chabot, MDIS Instrument Scientist at the Johns Hopkins University Applied Physics Laboratory (APL). Chabot has been leading the release of web images since MESSENGER’s first flyby of Mercury in January 2008.
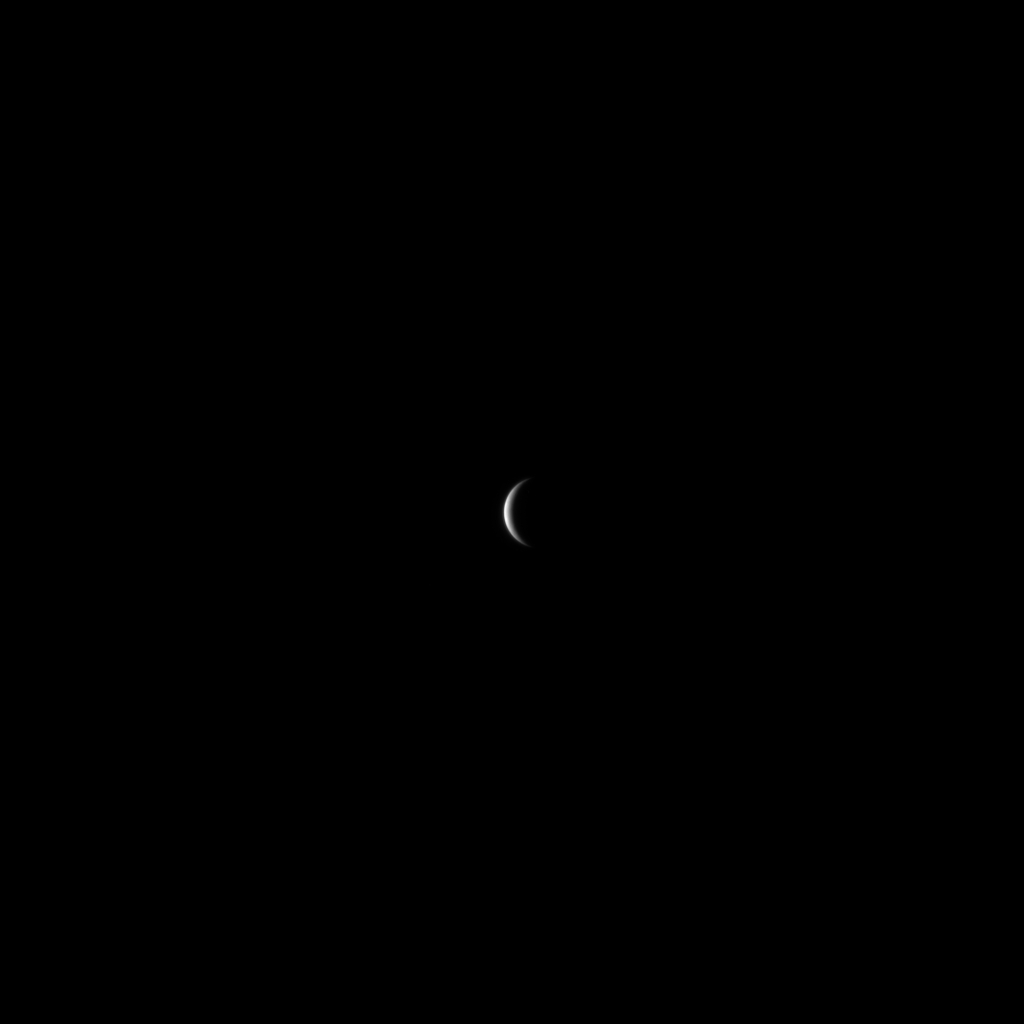
“The first image I released was this one, as MESSENGER approached Mercury for the mission’s first Mercury flyby,” said Chabot. “Mercury was just a small crescent in the image, but it was still very exciting for me. We were obtaining the first spacecraft images of Mercury since Mariner 10 transmitted its final image in 1975, and this was just the beginning of the flood of images that followed.”
One of the first spacecraft images of Mercury since Mariner 10 transmitted its final image in 1975
The herculean effort involved in posting a new image every business day was made possible by a small team of scientists in addition to Chabot and Byrne, including APL’s David Blewett, Brett Denevi, Carolyn Ernst, Rachel Klima, Nori Laslo, and Heather Meyer.
“Creating images and captions for the MESSENGER Image Gallery has been fun and interesting,” Blewett said. “Working on a Gallery release gives me a chance take a break from my regular research and look all around Mercury’s surface for an image that the general public might find to be engaging from a scientific, artistic, or humorous perspective (and sometimes all three!).”
“The posting of the 1,000th image of Mercury on our web gallery is a wonderful benchmark, but there’s much more to come,” adds MESSENGER Principal Investigator Sean Solomon of Columbia University’s Lamont-Doherty Earth Observatory. “MESSENGER’s altitude at closest approach is steadily decreasing, and in a little more than six months our spacecraft will be able to view Mercury at closer range than ever before with each orbit. Stay tuned!”
Image credits: NASA/Johns Hopkins University Applied Physics Laboratory/Carnegie Institution of Washington
MESSENGER (MErcury Surface, Space ENvironment, GEochemistry, and Ranging) is a NASA-sponsored scientific investigation of the planet Mercury and the first space mission designed to orbit the planet closest to the Sun. The MESSENGER spacecraft launched on August 3, 2004, and entered orbit about Mercury on March 17, 2011 (March 18, 2011 UTC).
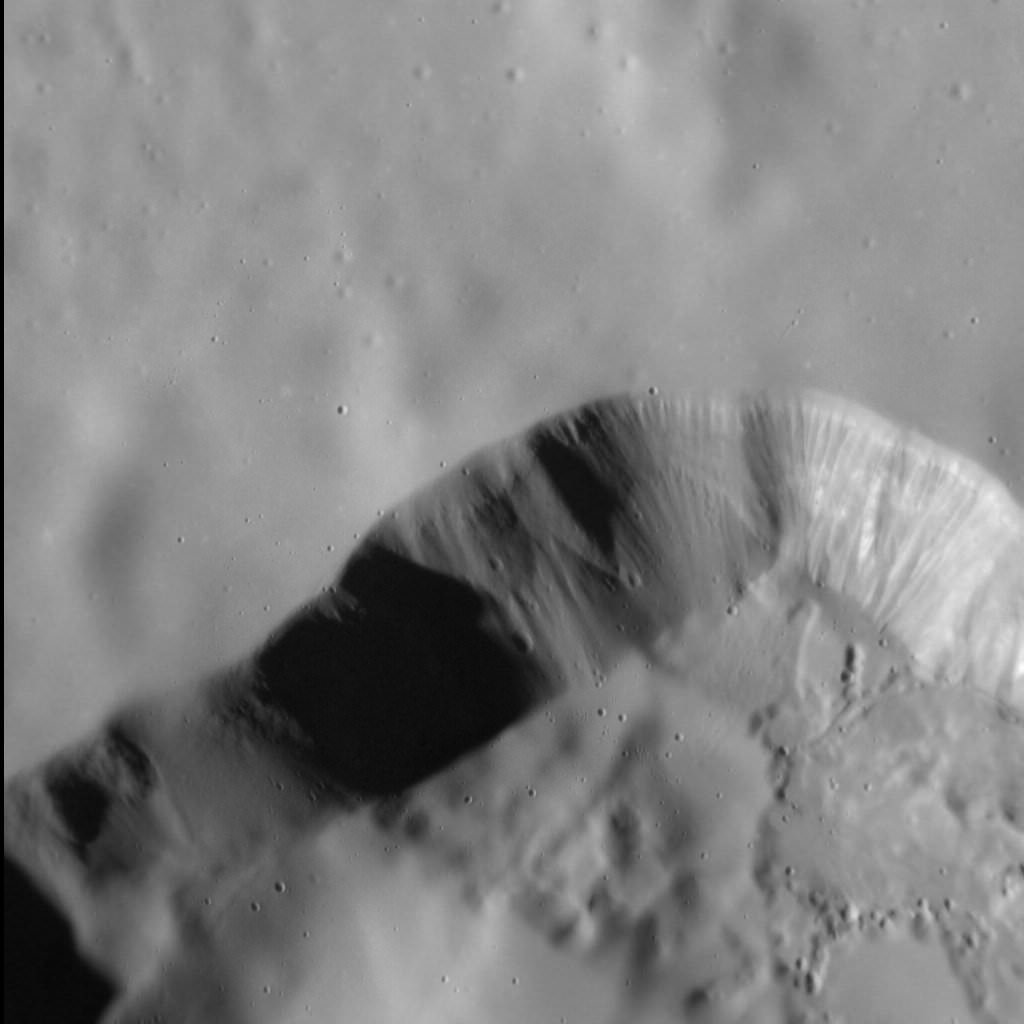
Hi-res targeted MESSENGER image of the interior of Tyagaraja crater (north is to the right).
Here’s a rather interesting view from orbit around the innermost planet: Mercury’s Tyagaraja crater, the interior of which is seen here in an oblique-angled image acquired by the MESSENGER spacecraft on November 12, 2011 (and released August 16, 2013.)
This view looks west across the northern portion of the 97-kilometer (60-mile) -wide crater, and shows some of its large central peaks, terraced walls, and bright erosion features called hollows that are spread across a wide swath of its interior.
First seen by MESSENGER in 2011, hollows are thought to indicate an erosion process unique to Mercury because of its composition and close proximity to the Sun. The lack of craters within hollows seems to indicate that they are relatively young features… in fact, they may be part of a process that continues today.
This image was acquired as a high-resolution targeted observation. Targeted observations are images of a small area on Mercury’s surface at resolutions much higher than the 200-meter/pixel morphology base map.
Enhanced-color image of Tyagaraja crater acquired on Sept. 29, 2011. Its large hollow field is highlighted.
Tyagaraja is named after Kakarla Tyagabrahmam, an 18th-century composer of classical Indian Carnatic music.
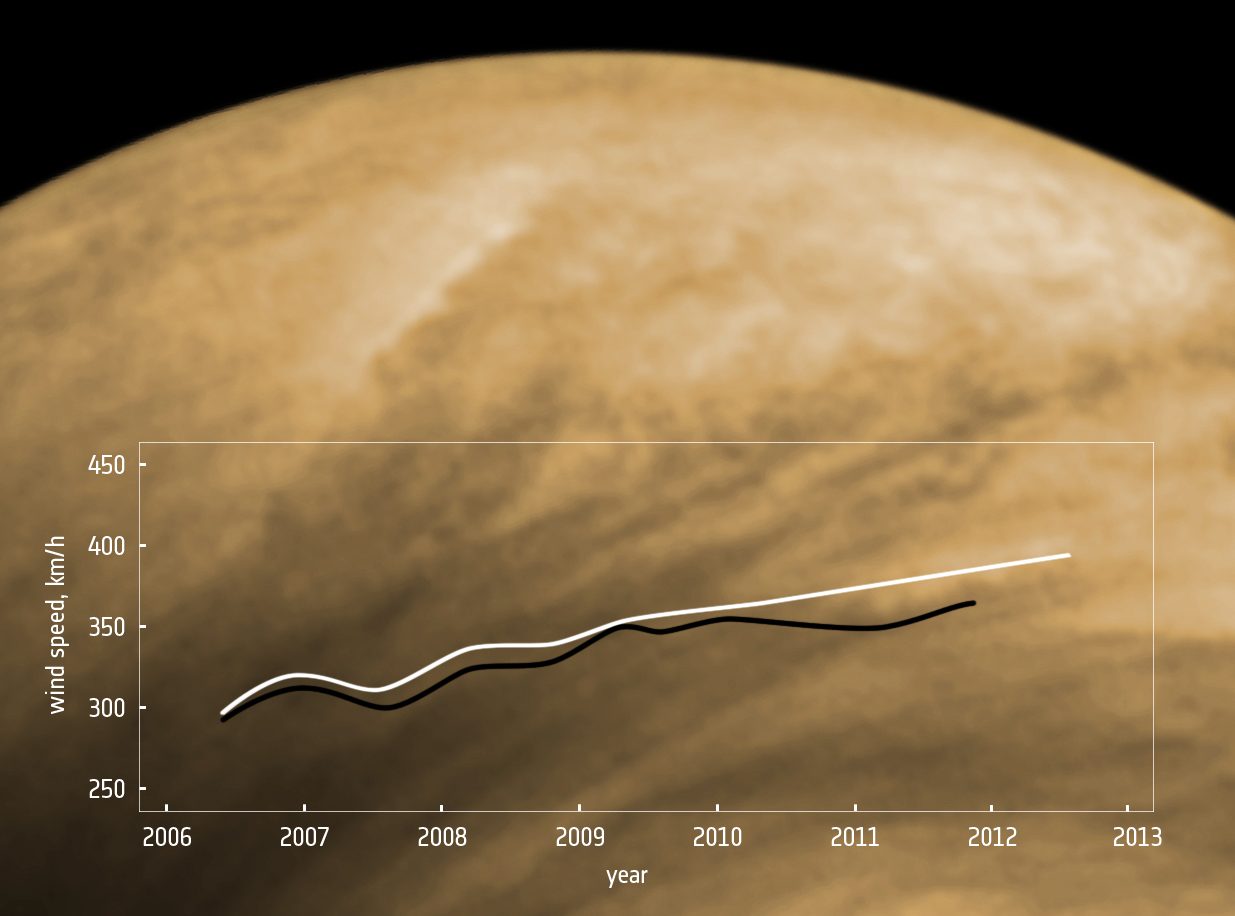
Over the past six years wind speeds in Venus' atmosphere have been steadily rising (ESA)
High-altitude winds on neighboring Venus have long been known to be quite speedy, whipping sulfuric-acid-laden clouds around the superheated planet at speeds well over 300 km/h (180 mph). And after over six years collecting data from orbit, ESA’s Venus Express has found that the winds there are steadily getting faster… and scientists really don’t know why.
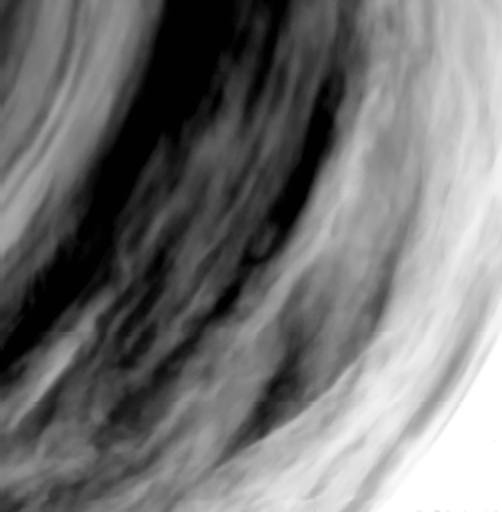
Cloud structures in Venus’ atmosphere, seen by Venus Express’ Ultraviolet, Visible and Near-Infrared Mapping Spectrometer (VIRTIS) in 2007 (ESA)
By tracking the movements of distinct features in Venus’ cloud tops at an altitude of 70 km (43 miles) over a period of six years — which is 10 of Venus’ years — scientists have been able to monitor patterns in long-term global wind speeds.
What two separate studies have found is a rising trend in high-altitude wind speeds in a broad swath south of Venus’ equator, from around 300 km/h when Venus Express first entered orbit in 2006 to 400 km/h (250 mph) in 2012. That’s nearly double the wind speeds found in a category 4 hurricane here on Earth!
“This is an enormous increase in the already high wind speeds known in the atmosphere. Such a large variation has never before been observed on Venus, and we do not yet understand why this occurred,” said Igor Khatuntsev from the Space Research Institute in Moscow and lead author of a paper to be published in the journal Icarus.
Long-term studies based on tracking the motions of several hundred thousand cloud features, indicated here with arrows and ovals, reveal that the average wind speeds on Venus have increased from roughly 300 km/h to 400 km/h over the first six years of the mission. (Khatuntsev et al.)
A complementary Japanese-led study used a different tracking method to determine cloud motions, which arrived at similar results… as well as found other wind variations at lower altitudes in Venus’ southern hemisphere.
“Our analysis of cloud motions at low latitudes in the southern hemisphere showed that over the six years of study the velocity of the winds changed by up 70 km/h over a time scale of 255 Earth days – slightly longer than a year on Venus,” said Toru Kouyama from Japan’s Information Technology Research Institute. (Their results are to be published in the Journal of Geophysical Research.)
Both teams also identified daily wind speed variations on Venus, along with shifting wave patterns that suggest “upwelling motions in the morning at low latitudes and downwelling flow in the afternoon.” (via Cloud level winds from the Venus Express Monitoring Camera imaging, Khatuntsev et al.)
A day on Venus is longer than its year, as the planet takes 243 Earth days to complete a single rotation on its axis. Its atmosphere spins around it much more quickly than its surface rotates — a curious feature known as super-rotation.
“The atmospheric super-rotation of Venus is one of the great unexplained mysteries of the Solar System,” said ESA’s Venus Express Project Scientist Håkan Svedhem. “These results add more mystery to it, as Venus Express continues to surprise us with its ongoing observations of this dynamic, changing planet.”
This article comes from the Universe Today archive, but was updated with this spiffy video.
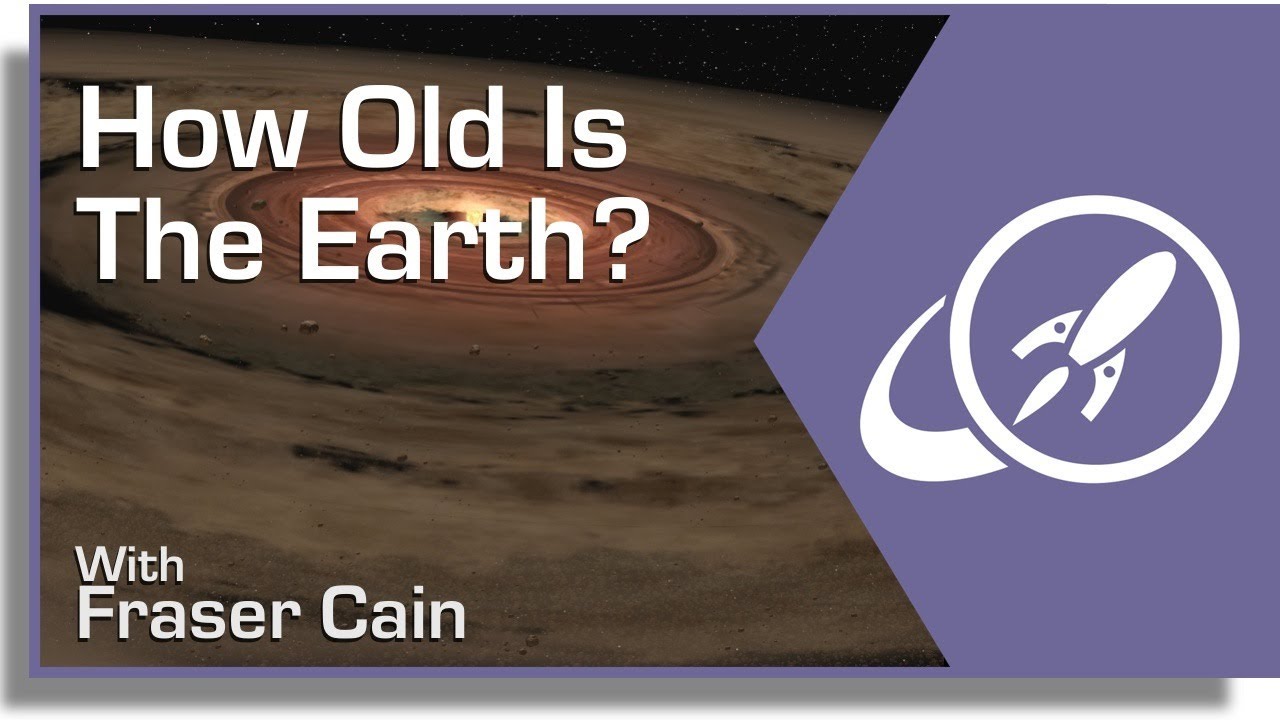
How old is the Earth? Scientists think that the Earth is 4.54 billion years old. Coincidentally, this is the same age as the rest of the planets in the Solar System, as well as the Sun. Of course, it’s not a coincidence; the Sun and the planets all formed together from a diffuse cloud of hydrogen billions of years ago.
In the early Solar System, all of the planets formed in the solar nebula; the remnants left over from the formation of the Sun. Small particles of dust collected together into larger and larger objects – pebbles, rocks, boulders, etc – until there were many planetoids in the Solar System. These planetoids collided together and eventually enough came together to become Earth-sized.
At some point in the early history of Earth, a planetoid the size of Mars crashed into our planet. The resulting collision sent debris into orbit that eventually became the Moon.
How do scientists know Earth is 4.54 billion years old? It’s actually difficult to tell from the surface of the planet alone, since plate tectonics constantly reshape its surface. Older parts of the surface slide under newer plates to be recycled in the Earth’s core. The oldest rocks ever found on Earth are 4.0 – 4.2 billion years old.
Scientists assume that all the material in the Solar System formed at the same time. Various chemicals, and specifically radioactive isotopes were formed together. Since they decay in a very known rate, these isotopes can be measured to determine how long the elements have existed. And by studying different meteorites from different locations in the Solar System, scientists know that the different planets all formed at the same time.
Failed Methods for Calculating the Age of the Earth
Our current, accurate method of measuring the age of the Earth comes at the end of a long series of estimates made through history. Clever scientists discovered features about the Earth and the Sun that change over time, and then calculated how old the planet Earth is from that. Unfortunately, they were all flawed for various reasons.
Declining Sea Levels – Benoit de Maillet, a French anthropologist who lived from 1656-1738 and guessed (incorrectly) that fossils at high elevations meant Earth was once covered by a large ocean. This ocean had taken 2 billion years to evaporate to current sea levels. Scientists abandoned this when they realized that sea levels naturally rise and fall.
Cooling of the Earth – William Thompson, later known as Lord Kelvin, assumed that the Earth was once a molten ball of rock with the same temperature of the Sun, and then has been cooling ever since. Based on these assumptions, Thompson calculated that the Earth took somewhere between 20 and 400 million years to cool to its current temperature. Of course, Thompson made several inaccurate assumptions, about the temperature of the Sun (it’s really 15 million degrees Kelvin at its core), the temperature of the Earth (with its molten core) and how the Sun is made of hydrogen and the Earth is made of rock and metal.
Cooling of the Sun – In 1856, the German physicist Hermann Ludwig Ferdinand von Helmholtz attempted to calculate the age of the Earth by the cooling of the Sun. He calculated that the Sun would have taken 22 million years to condense down to its current diameter and temperature from a diffuse cloud of gas and dust. Although this was inaccurate, Helmholtz correctly identified that the source of the Sun’s heat was driven by gravitational contraction.
Rock Erosion – In his book, The Origin of Species by Means of Natural Selection, Charles Darwin proposed that the erosion of chalk deposits might allow for a calculation of the minimum age of the planet. Darwin estimated that a chalk formation in the Weald region of England might have taken 300 million years to weather to its current form.
Orbit of the Moon – George Darwin, the son of Charles Darwin, guessed that the Moon might have been formed out of the Earth, and drifted out to its current location. The fission theory proposed that the Earth’s rapid rotation caused a chunk of the planet to spin off into space. Darwin calculated that it had taken the Moon at least 56 million years to reach its current distance from Earth. We now know the Moon was probably formed when a Mars-sized object smashed into the Earth billions of years ago.
Salinity of the Ocean – In 1715, the famous astronomer Edmund Halley proposed that the salinity of the oceans could be used to estimate the age of the planet. Halley observed that oceans and lakes fed by streams were constantly receiving more salt, which then stuck around as the water evaporated. Over time, the water would be come saltier and saltier, allowing an estimate of how long this process has been going on. Various geologists used this method to guess that the Earth was between 80 and 150 million years old. This method was flawed because scientists didn’t realize that geologic processes are extracting salt out of the water as well.
Radiometric Dating Provides an Accurate Method to Know the Age of the Earth
In 1896, the French chemist A. Henri Becquerel discovered radioactivity, the process where materials decay into other materials, releasing energy. Geologists realized that the interior of the Earth contained a large amount of radioactive material, and this would be throwing off their calculations for the age of the Earth. Although this discovery revealed flaws in the previous methods of calculating the age of the Earth, it provided a new method: radiometric dating.
Geologists discovered that radioactive materials decay into other elements at a very predictable rate. Some materials decay quickly, while others can take millions or even billions of years to fully decay. Ernest Rutherford and Frederick Soddy, working at McGill University, determined that half of any isotope of a radioactive element decays into another isotope at a set rate. For example, if you have a set amount of Thorium-232, half of it will decay over a billion years, and then half of that amount will decay in another billion years. This is the source of the term “half life”.
By measuring the half lives of radioactive isotopes, geologists were able to build a measurement ladder that let them accurately calculate the age of geologic formations, including the Earth. They used the decay of uranium into various isotopes of lead. By measuring the amount of three different isotopes of lead (Pb-206, Pb-207, and Pb-208 or Pb-204), geologists can calculate how much Uranium was originally in a sample of material.
If the Solar System formed from a common pool of matter, with uniformly distributed Pb isotopes, then all objects from that pool of matter should show similar amounts of the isotopes. Also, over time, the amounts of Pb-206 and Pb-207 will change because as these isotopes are end-products of uranium decay. This makes the amount of lead and uranium change. The higher the uranium-to-lead ratio of a rock, the more the Pb-206/Pb-204 and Pb-207/Pb-204 values will change with time. Now, supposing that the source of the Solar system was also uniformly distributed with uranium isotopes, then you can draw a data line showing a lead-to-uranium plot and, from the slope of the line, the amount of time which has passed since the pool of matter became separated into individual objects can be computed.
Bertram Boltwood applied this method of dating to 26 different samples of rocks, and discovered that they had been formed between 92 and 570 million years old, and further refinements to the technique gave ages between 250 million to 1.3 billion years.
Geologists set about exploring the Earth, seeking the oldest rock formations on the planet. The oldest surface rock is found in Canada, Australia and Africa, with ages ranging from 2.5 to 3.8 billion years. The very oldest rock was discovered in Canada in 1999, and estimated to be just over 4 billion years old.
This set a minimum age for the Earth, but thanks to geologic processes like weathering and plate tectonics, it could still be older.
Meteorites as the Final Answer to the Age of the Earth
The problem with measuring the age of rocks on Earth is that the planet is under constant geological change. Plate tectonics constantly recycle portions of the Earth, blending it up and forever hiding the oldest regions of the planet. But assuming that everything in the Solar System formed at the same time, meteorites in space have been unaffected by weathering and plate tectonics here on Earth.
Geologists used these pristine objects, such as the Canyon Diablo meteorite (the fragments of the asteroid that impacted at Barringer Crater) as a way to get at the true age of the Solar System, and therefore the Earth. By using the radiometric dating system on these meteorites, geologists have been able to determine that the Earth is 4.54 billion years old within a margin of error of about 1%.
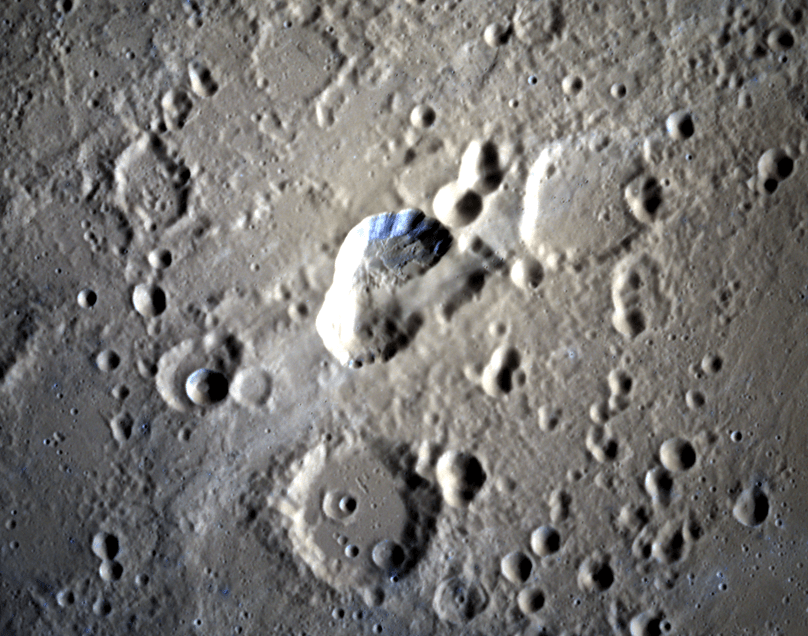
An 11-color MESSENGER targeted image of Mercury's Tyagaraja crater
At first glance, the planet Mercury may bear a striking resemblance to our own Moon. True, both are heavily-cratered, airless worlds that hide pockets of ice inside polar shadows… but there the similarities end. In addition to being compositionally different than the Moon, Mercury also has surface features that you won’t find on the lunar surface — or anywhere else in the Solar System.
The picture above, part of an 11-color targeted image acquired by MESSENGER on April 25, 2013, shows the varied terrain found within the 97-kilometer-wide Tyagaraja crater located near Mercury’s equator. The reds, blues, greens, and oranges, much more saturated than anything we’d see with our own eyes, correspond to surface materials of different compositions… and the brightest spots within the crater are features called “hollows” that are truly unique to Mercury, possibly resulting from the planet’s close interaction with the solar wind.
First noted in September of 2011, hollows have been identified across many areas of Mercury. One hypothesis is that they’re formed by the sublimation of subsurface material exposed inside larger craters. Being so close to the Sun and lacking a protective atmosphere, Mercury is constantly being scoured by the solar wind — a relentless stream of charged particles that’s actively “sandblasting” exposed volatiles from the planet’s surface!
A previous MESSENGER image of hollows inside Tyagaraja crater
The reddish spot at the center of the crater in the top image is likely material surrounding a pyroclastic vent, which appear red and orange in MDIS images. The dark material that appears bluish is something called “low reflectance material” (LRM).
The image was acquired as a targeted high-resolution 11-color image set. Acquiring 11-color targets is a new MESSENGER campaign that began in March and utilizes all of the Wide-Angle Camera’s 11 narrow-band color filters. Because of the large data volume involved, only features of special scientific interest are targeted for imaging in all 11 colors.
Full of geologically interesting features the crater was named for Kakarla Tyagabrahmam, an 18th century composer of classical South Indian music.
The first spacecraft to establish orbit around Mercury in summer 2011, MESSENGER is capable of continuing orbital operations until early 2015.
Read more on the Johns Hopkins University APL MESSENGER site here.
Credits: NASA/Johns Hopkins University Applied Physics Laboratory/Carnegie Institution of Washington
If you couldn’t tell, we love time-lapse videos… whether they’re made of photos looking up at the sky from Earth or looking down at Earth from the sky! This latest assembly by photographer Bruce W. Berry takes us on a tour around the planet from orbit, created from images taken by astronauts aboard the International Space Station and expertly de-noised, stabilized and smoothed to 24 frames per second. The result is — like several others before — simply stunning, a wonderful reminder of our place in space and the beauty of our living world.
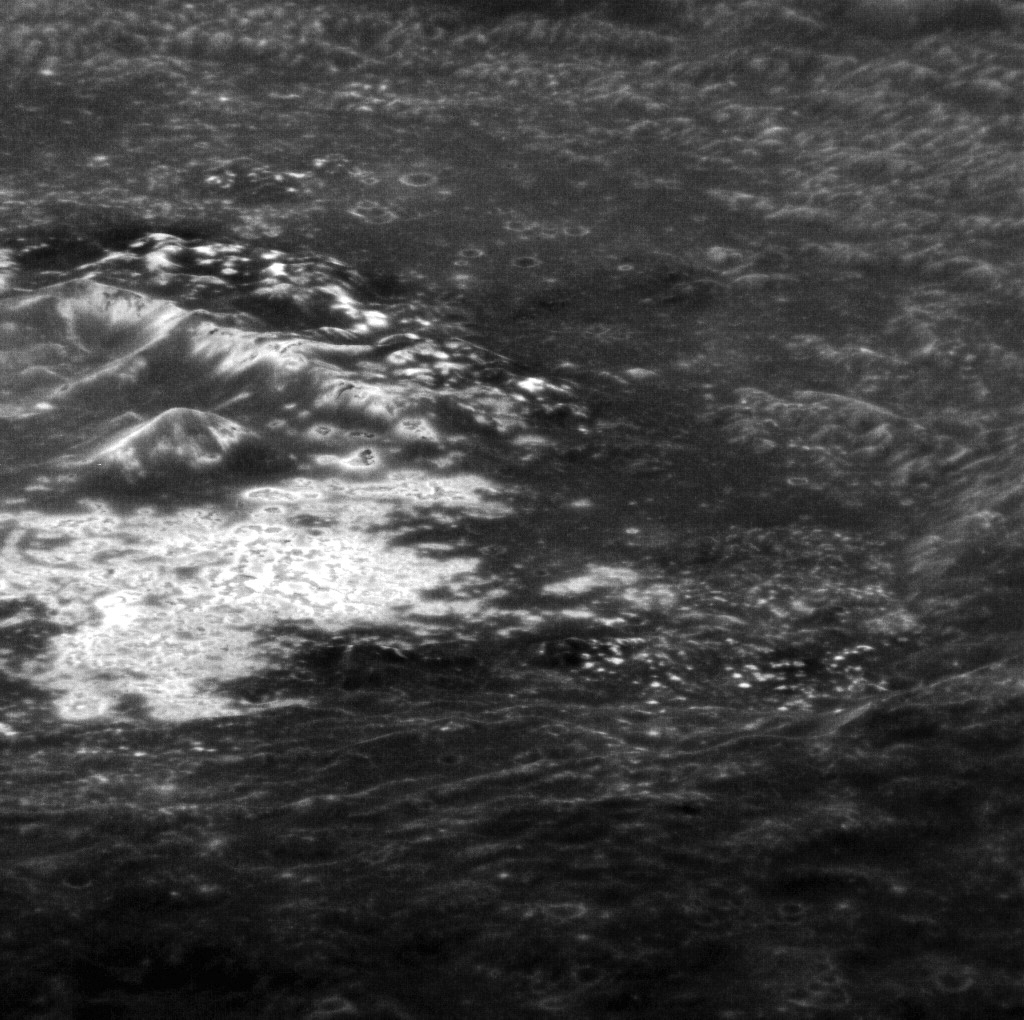
A high-resolution view of a "silky" surface on Mercury
During its two years in orbit around Mercury — as well as several more years performing flybys — the MESSENGER spacecraft has taken over 150,000 images of the innermost planet, giving us a look at its incredibly rugged, Sun-scoured surface like never before. But not all areas on Mercury appear so harsh — it has its softer sides too, as seen above in an image released earlier today.
Here we see the smooth walls, floor and upper surfaces around an irregular depression on Mercury in high definition. The velvety texture is the result of widespread layering of fine particles, because unlike many features on Mercury’s ancient surface this rimless depression wasn’t caused by an impact from above but rather explosively escaping lava from below — this is the rim of a volcanic vent, not a crater!
Previous images have been acquired of this irregularly-shaped depression but this is the highest resolution view MESSENGER has captured to date — about 26 meters per pixel.
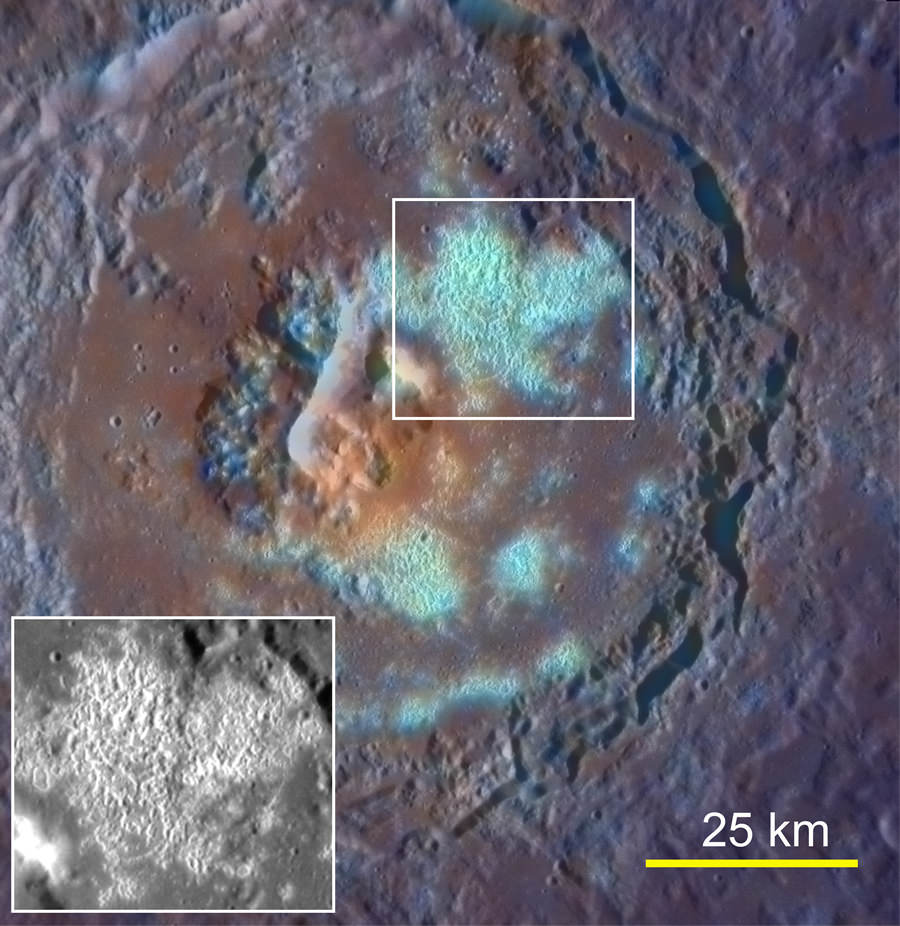
A wide-angle view of the same depression, captured by MESSENGER in July 2012
The full depression, located northeast of the Rachmaninoff basin, is about 36 km (22 miles) across at its widest. It’s surrounded by a smooth blanket of high-reflectance material — explosively ejected volcanic particles from a pyroclastic eruption that spread over the surface like snow.
Other similar vents have been found on Mercury, like this heart-shaped one in Caloris basin. The smooth, bright surface material is a telltale sign of a volcanic outburst, as are the rimless, irregular shapes of the vents.
The numerous small craters that are seen inside the vent and on the smooth surrounding surfaces would be from meteorite impacts that occurred well after the eruption.
On March 17, 2011, MESSENGER became the first spacecraft ever to orbit the planet Mercury. It is capable of continuing orbital operations until early 2015. Find out more about the mission here.
Image credits: NASA/Johns Hopkins University Applied Physics Laboratory/Carnegie Institution of Washington

 William Thompson, later known as Lord Kelvin, assumed that the Earth was once a molten ball of rock with the same temperature of the Sun, and then has been cooling ever since. Based on these assumptions, Thompson calculated that the Earth took somewhere between 20 and 400 million years to cool to its current temperature. Of course, Thompson made several inaccurate assumptions, about the temperature of the Sun (it’s really 15 million degrees Kelvin at its core), the temperature of the Earth (with its molten core) and how the Sun is made of hydrogen and the Earth is made of rock and metal.