The Milky Way’s Magnetic Personality

The sky map of the Faraday effect caused by the magnetic fields of the Milky Way. Red and blue colors indicate regions of the sky where the magnetic field points toward and away from the observer, respectively. The band of the Milky Way (the plane of the Galactic disk) extends horizontally in this panoramic view. The center of the Milky Way lies in the middle of the image. The North celestial pole is at the top left and the South Pole is at the bottom right. (Image Credit: Max Planck Institute for Astrophysics)

[/caption]

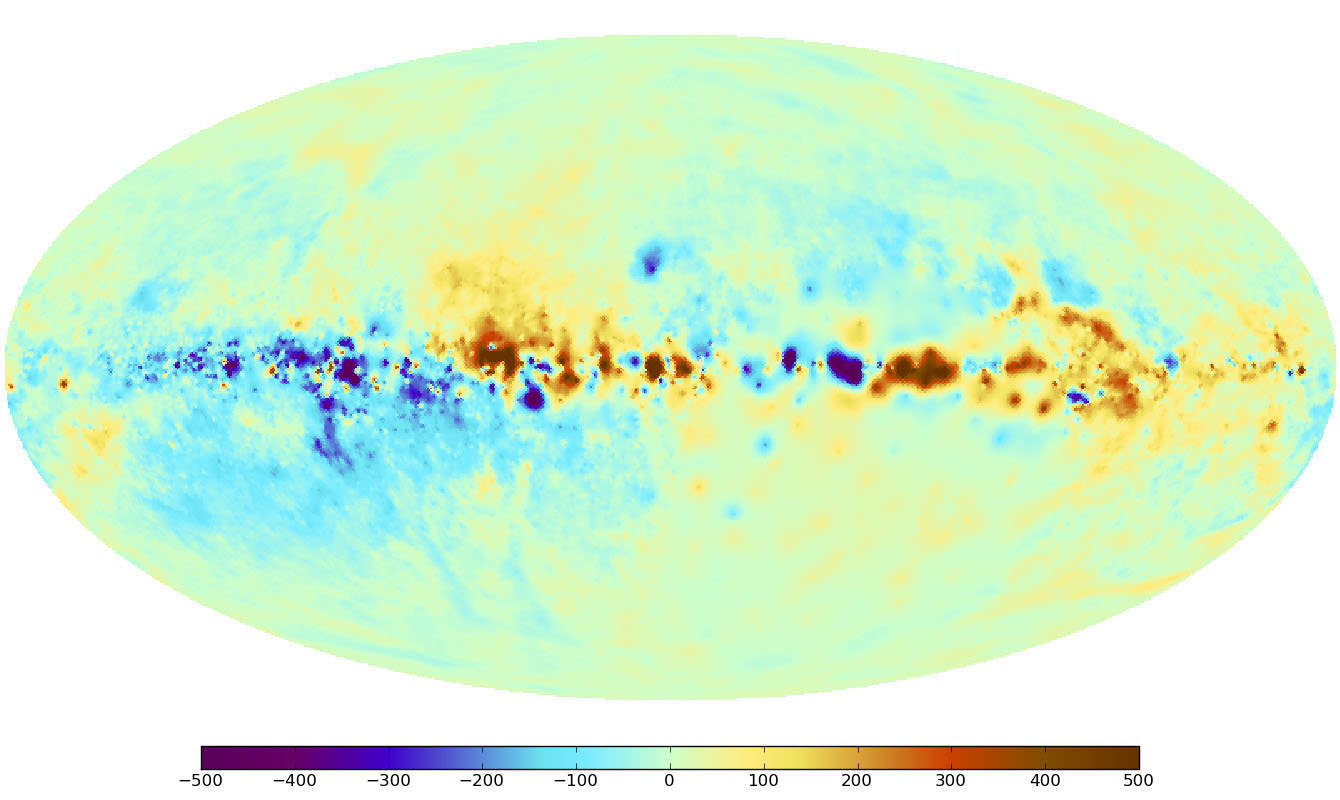
Recently we took a look at a very unusual type of map – the Faraday Sky. Now an international team of scientists, including those at the Naval Research Laboratory, have pooled their information and created one of the most high precision maps to date of the Milky Way’s magnetic fields. Like all galaxies, ours has a magnetic “personality”, but just where these fields come from and how they are created is a genuine mystery. Researchers have always simply assumed they were created by mechanical processes like those which occur in Earth’s interior and the Sun. Now a new study will give scientists an even better understanding about the structure of galactic magnetic fields as seen throughout our galaxy.

The team, led by the Max Planck Institute for Astrophysics (MPA), gathered their information and compiled it with theoretical simulations to create yet another detailed map of the magnetic sky. As NRL’s Dr. Tracy Clarke, a member of the research team explains, “The key to applying these new techniques is that this project brings together over 30 researchers with 26 different projects and more than 41,000 measurements across the sky. The resulting database is equivalent to peppering the entire sky with sources separated by an angular distance of two full moons.” This huge amount of data provides a new “all-sky” look which will enable scientists to measure the magnetic structure of the Milky Way in minute detail.

In this map of the sky, a correction for the effect of the Galactic disk has been made in order to emphasize weaker magnetic field structures. The magnetic field directions above and below the disk seem to be diametrically opposed, as indicated by the positive (red) and negative (blue) values. An analogous change of direction takes place across the vertical center line, which runs through the center of the Milky Way. (Image Credit: Max Planck Institute for Astrophysics)
Just what’s so “new” about this map? This time we’re looking at a quantity called Faraday depth – an idea dependent on a line-of-sight information set on the magnetic fields. It was created by combining more than 41,000 singular measurements which were then combined using a new image reconstruction method. In this case, all the researchers at MPA are specialists in the new discipline of information field theory. Dr. Tracy Clarke, working in NRL’s Remote Sensing Division, is part of the team of international radio astronomers who provided the radio observations for the database. It’s magnetism on a grand scale… and imparts even the smallest of magnetic features which will enable scientists to further understand the nature of galactic gas turbulence.

The concept of the Faraday effect isn’t new. Scientists have been observing and measuring these fields for the last century and a half. Just how is it done? When polarized light passes through a magnetized medium, the plane of the polarization flips… a process known as Faraday rotation. The amount of rotation shows the direction and strength of the field and thereby its properties. Polarized light is also generated from radio sources. By using different frequencies, the Faraday rotation can also be measured in this alternative way. By combining all of these unique measurements, researchers can acquire information about a single path through the Milky Way. To further enhance the “big picture”, information must be gathered from a variety of sources – a need filled by 26 different observing projects that netted a total of 41,330 individual measurements. To give you a clue of the size, that ends up being about one radio source per square degree of sky!

The uncertainty in the Faraday map. Note that the range of values is significantly smaller than in the Faraday map (Fig. 1). In the area of the celestial south pole, the measurement uncertainties are particularly high because of the low density of data points. (Image Credit: Max Planck Institute for Astrophysics)
Even with depth like this, there are still areas in the southern sky where only a few measurements have been cataloged. To fill in the gaps and give a more realistic view, researchers “have to interpolate between the existing data points that they have recorded.” However, this type of data causes some problems with accuracy. While you might think the more exact measurements would have the greatest impact on the map, scientists aren’t quite sure how reliable any single measurement could be – especially when they could be influenced by the environment around them. In this case, the most accurate measurements don’t always rank the highest in mapping points. Like Heisenberg, there’s an uncertainty associated with the process of obtaining measurements because the process is so complex. Just one small mistake could lead to a huge distortion in the map’s contents.

Thanks to an algorithm crafted by the MPA, scientists are able to face these types of difficulties with confidence as they put together the images. The algorithm, called the “extended critical filter,” employs tools from new disciplines known as information field theory – a logical and statistical method applied to fields. So far it has proven to be an effective method of weeding out errors and has even proven itself to be an asset to other scientific fields such as medicine or geography for a range of image and signal-processing applications.

Even though this new map is a great assistant for studying our own galaxy, it will help pave the way for researchers studying extragalactic magnetic fields as well. As the future provides new types of radio telescopes such as LOFAR, eVLA, ASKAP, MeerKAT and the SKA , the map will be a major resource of measurements of the Faraday effect – allowing scientists to update the image and further our understanding of the origin of galactic magnetic fields.

Original Story Source: Naval Research Laboratory News.

ISS Soars Over Stormy Africa

Comet Lovejoy can be seen in the video rising just right of the Milky Way.


Here’s a quick but lovely little gem: a time-lapse video taken from the ISS as it passed above central Africa, Madagascar and the southern Indian Ocean on December 29, 2011. The nighttime flyover shows numerous lightning storms and the thin band of our atmosphere, with a layer of airglow above, set against a stunning backdrop of the Milky Way and a barely-visible Comet Lovejoy, just two weeks after its close encounter with the Sun.

This video was made from photos taken by Expedition 30 astronauts. The photos were compiled at Johnson Space Center and uploaded to The Gateway to Astronaut Photography of Earth, an excellent database of… well, of astronauts’ photos of Earth.

[/caption]

The site’s description of this particular video states:

This video was taken by the crew of Expedition 30 on board the International Space Station. The sequence of shots was taken December 29, 2011 from 20:55:05 to 21:14:09 GMT, on a pass from over central Africa, near southeast Niger, to the South Indian Ocean, southeast of Madagascar. The complete pass is over southern Africa to the ocean, focusing on the lightning flashes from local storms and the Milky Way rising over the horizon. The Milky Way can be spotted as a hazy band of white light at the beginning of the video. The pass continues southeast toward the Mozambique Channel and Madagascar. The Lovejoy Comet can be seen very faintly near the Milky Way. The pass ends as the sun is rising over the dark ocean.

There are lots more time-lapse videos on the Gateway as well, updated periodically. Check them out here.

Video courtesy of the Image Science & Analysis Laboratory, NASA Johnson Space Center.

What Color is the Milky Way? White as Snow (not Milk)

An image of one of the Milky Way analogs found by Timothy Licquia and Jeffrey Newman. This galaxy, known to astronomers as SDSS J083909.27+450747.7, has properties which closely match those of the galaxy we live in. Credit: Sloan Digital Sky Survey

[/caption]

What color would the Milky Way appear to alien civilizations looking at our galaxy through their telescopes? It turns out the Milky Way has approximately the right name – but for all the wrong reasons. “The true color of the Milky Way is as white as fine-grained new spring snow seen in early morning light,” said Dr. Jeffrey Newman, from the University of Pittsburgh, speaking at a press conference from the American Astronomical Society (AAS) Meeting.

Our ancestors gave our galaxy the name “Milky Way” because when they looked up and saw the band of the stars that stretches from one horizon to the other, it appears white to our human eyes. “But that’s only because our low-light vision isn’t sensitive to color,” said Newman. “There are portions of the Milky Way that are more yellow or red versus more blue, but our eyes can’t pick that up. But a sensitive instrument or photograph can.”

When we look at other galaxies, we can see them in their entirety, and can examine them for color and luminosity. Color and luminosity have been great tool for astronomy, helping us to understand stars and galaxies.

“Unfortunately we can’t get a complete picture of the Milky Way from outside, so we have had to resort to other methods,” said Newman. “Not only are we looking at Milky Way from the inside, but it’s even worse than that — our view is blocked by dust, both in clouds and diffuse dust. We can only see about 1,000 -2,000 light years in any direction, even though our galaxy is a 100,000 light years across.”

A digital all-sky mosaic of our view of the Milky Way from Earth, assembled from more than 3,000 individual CCD frames. Credit: Axel Mellinger. Click on image to view a zoomable panorama.

So if you ask, ‘what is the integrated color of the Milky Way,’ we can can’t tell from a picture like the one above, we can only tell what color the local neighborhood is.

“We have had to resort to different techniques, and rather than looking at the Milky Way directly, we look at other galaxies that should be like the Milky Way and we can determine what their color and luminosity are,” Newman said.

Newman, along with Timothy Licquia, a PhD student in physics at Pitt, used images from the Sloan Digital Sky Survey — which contains detailed properties of nearly a million galaxies — and looked for galaxies with similar properties to the Milky Way in regards to total mass and star formation rates. The Milky Way Galaxy should then fall on a plot somewhere within the range of colors of these matching objects.

While the composite color of the Milky Way is snowy-white, our galaxy appears more yellow towards the center and more blue out in the spiral arms.

Newman and Licquia determined the light color temperature of the Milky Way is 4,840 K, which closely matches the light from a standard light bulb with a color temperature of 4,700-5,000K. “It is well within the range our eye can perceive as white—roughly halfway between the light from old-style incandescent light bulbs and the standard spectrum of white on a television,” said Newman. “Our eyes treat both as white.”

The color of new snow is the whitest natural color on Earth. While milk has a more bluish color than snow, the association of our Milky Way to milk has proven to be very appropriate, given the Milky Way’s true color.

Newman even wrote a Haiku about the color:

Look at new spring snow
See the River of Heaven
An hour after dawn

The Milky Way’s color could be on either side of a standard dividing line between red and blue galaxies: relatively red galaxies rarely form new stars and blue galaxies have stars still being born. This adds to the evidence that although the Milky Way is still producing stars, it is “on its way out,” according to Newman. “A few billion years from now, our Galaxy will be a much more boring place, full of middle-aged stars slowly using up their fuel and dying off, but without any new ones to take their place. It will be less interesting for astronomers in other galaxies to look at, too: The Milky Way’s spiral arms will fade into obscurity when there are no more blue stars left.”

Source: Pitt, AAS press briefing

First Look at a Black Hole’s Feast


A true heart of darkness lies at the center of our galaxy: Sagittarius A* (pronounced “A-star”) is a supermassive black hole with the mass of four million suns packed into an area only as wide as the distance between Earth and the Sun. Itself invisible to direct observation, Sgr A* makes its presence known through its effect on nearby stars, sending them hurtling through space in complex orbits at speeds upwards of 600 miles a second. And it emits a dull but steady glow in x-ray radiation, the last cries of its most recent meals. Gas, dust, stars… solar systems… anything in Sgr A*’s vicinity will be drawn inexorably towards it, getting stretched, shredded and ultimately absorbed (for lack of a better term) by the dark behemoth, just adding to its mass and further strengthening its gravitational pull.

Now, for the first time, a team of researchers led by Reinhard Genzel from the Max-Planck Institute for Extraterrestrial Physics in Germany will have a chance to watch a supermassive black hole’s repast take place.

Continue reading “First Look at a Black Hole’s Feast”

Globular Clusters on a Plane

Smaller satellite galaxies caught by a spiral galaxy are distorted into elongated structures consisting of stars, which are known as tidal streams, as shown in this artist's impression. Credit: Jon Lomberg

[/caption]

Globular clusters are generally some of the oldest structures in our galaxy. Many of the most famous ones formed around the same time as our galaxy, some 13 billion years ago. However, some are distinctly younger. While many classification schemes are used, one breaks globular clusters into three groups: an old halo group which includes the oldest of the clusters, those in the disk and bulge of the galaxy which tend to have higher metallicity, and a younger population of halo clusters. The latter of these provides a bit of a problem since the galaxy should have settled into a disk by the time they formed, depriving them of the necessary materials to form in the first place. But a new study suggests a solution that’s not of this galaxy.

The new study looked at the distribution of these younger clusters around our Milky Way. Of the three classifications for globular clusters discussed, the young halo clusters are scattered well beyond the range of the other populations. The young halo extends to as much as 120 kiloparsecs (400 thousand light years) while the old halo clusters tend to lie within 30 kiloparsecs (100 thousand light years). Additionally, the young clusters don’t appear to be rotating with the disk of the galaxy whereas the old halo slowly orbits in the same direction as the disk.

In looking more carefully at the positions of these satellites, the team, led by Stefan Keller at the Australian National University, found that the younger population tends to lie in a wide plane that is tilted from the rotational axis of our galaxy by a mere 8°.

This plane is strikingly similar to another recognized grouping of objects: Many of the known dwarf galaxies lie in a nearly identical plane, known as the Plane of Satellites (PoS). This finding suggests that this population of globular clusters is a relic of cannibalized galaxies. Even more interesting is that, while these objects are younger than the distinctly “old” population, there is still a large variation in their ages. This implies that this plane wasn’t created by the accretion of one, or even a few minor galaxies, but a consistent feeding of small galaxies onto the Milky Way for much of the history of the universe, and all from the same direction. Studies of the distribution of satellites around our nearest major neighbor, M31, the Andromeda galaxy, has turned up a similar preferred plane, tilted some 59° from its disk.

One explanation for this is that this is a preferred direction that traces invisible filaments of dark matter. While dark matter distributions are difficult to predict, models haven’t accounted for such strong filamentary structure on such small scales. Rather, in the neighborhood of our galaxy, the overall distribution is described as an oblate spheroid. One of the reasons astronomers believe our own dark matter halo is so nicely shaped is the way it is affecting the Sagittarius dwarf galaxy which is slowly being accreted onto our own. If the dark matter were more wispy, it should be stretched out in different manners.

Another possibility the authors consider is that the objects were created in a preferred plane “from the break up of a large progenitor at early times”. In other words, the filament could be a fossil of larger structure before our galaxy formed along which these dwarf galaxies formed and from which these galaxies could have been slowly accreting over the history of the galaxy.

The Genesis of Galaxy Eris…

This image of the Eris simulation shows the stars in the galaxy as observers would see it. Blue colors are regions of recent star formation, while redder regions are associated with older stars. The spiral arms are typically star-forming, and the central bulge is basically "red and dead." Credit: J. Guedes and P. Madau.

[/caption]

In as much time as it takes to give birth to human life, a supercomputer and a team of researchers at the University of California, Santa Cruz, and the Institute for Theoretical Physics in Zurich have given rise to the first simulation of the physics involved in galaxy formation that produced the Milky Way. They named their child Eris…

“Previous efforts to form a massive disk galaxy like the Milky Way had failed, because the simulated galaxies ended up with huge central bulges compared to the size of the disk,” said Javiera Guedes, who recently earned her Ph.D. in astronomy and astrophysics at UC Santa Cruz and is first author of a paper which has been accepted for publication in the Astrophysical Journal.

This comparison shows the Eris simulation (top) and the Milky Way (bottom). Credit: S. Callegari, J. Guedes, and the 2MASS collaboration.
Like the Milky Way, Eris is a lovely barred spiral galaxy – her figure and star content as identical as modeling can make it. By studying our own galaxy and others like it, this simulation fits the mold from every angle. “We dissected the galaxy in many different ways to confirm that it fits with observations,” Guedes said.

And “seven sisters” were involved in the project, too. NASA’s state-of-the-art Pleiades supercomputer took on the task of 1.4 million processor-hours. But the calculations didn’t stop there. Simulations on supercomputers at UCSC and the Swiss National Supercomputing Center were involved, too. “We took some risk spending a huge amount of supercomputer time to simulate a single galaxy with extra-high resolution,” Madau said.

For over two decades, attempts at creating the evolution of a Milky Way type galaxy have been just outside the grasp of researchers. They just weren’t able to produce the proper shape, size and population to fit known properties. Thanks to this new breakthrough, support for the “cold dark matter” theory has predominated and the Big Bang theory supported. What gave Eris the edge? Try our now better understanding star formation.

“Star formation in real galaxies occurs in a clustered fashion, and to reproduce that out of a cosmological simulation is hard,” Madau said. “This is the first simulation that is able to resolve the high-density clouds of gas where star formation occurs, and the result is a Milky Way type of galaxy with a small bulge and a big disk. It shows that the cold dark matter scenario, where dark matter provides the scaffolding for galaxy formation, is able to generate realistic disk-dominated galaxies.”

Giving birth to Eris wasn’t an easy task. Through low-resolution simulations, researchers began assembling clumps of dark matter – shaping them into galactic halos. From there they selected information on a halo with similar mass and merger history to our own and “rewound the tape” to its infancy. By focusing on a small area, they were able to add additional particle information and step up the resolution.

“The simulation follows the interactions of more than 60 million particles of dark matter and gas. A lot of physics goes into the code–gravity and hydrodynamics, star formation and supernova explosions–and this is the highest resolution cosmological simulation ever done this way,” said Guedes, who is currently a postdoctoral researcher at the Swiss Federal Institute of Technology in Zurich (ETH Zurich).

What sets Eris apart from its predecessors is the ability to “see” in high resolution / high density. This allows for a more pragmatic approach to star formation and placement. It’s an important consideration, because supernova occur in high density regions and high resolution allows them to be taken into account.

“Supernovae produce outflows of gas from the inner part of the galaxy where it would otherwise form more stars and make a large bulge,” Madau said. “Clustered star formation and energy injection from supernovae are making the difference in this simulation.”

Arise, Eris… Your time has come!

Original Story Source: University of Santa Cruz News. For Further Reading: Forming Realistic Late-Type Spirals in a LCDM Universe: The Eris Simulation.

Huge Reservoir of Water Discovered in Space 30 Billion Trillion Miles Away

This artist's concept illustrates a quasar, or feeding black hole, similar to APM 08279+5255, where astronomers discovered huge amounts of water vapor. Gas and dust likely form a torus around the central black hole, with clouds of charged gas above and below. Image credit: NASA/ESA

[/caption]

From a Caltech Press Release:

Water really is everywhere. Two teams of astronomers, each led by scientists at the California Institute of Technology (Caltech), have discovered the largest and farthest reservoir of water ever detected in the universe. Looking from a distance of 30 billion trillion miles away into a quasar—one of the brightest and most violent objects in the cosmos—the researchers have found a mass of water vapor that’s at least 140 trillion times that of all the water in the world’s oceans combined, and 100,000 times more massive than the sun.

Because the quasar is so far away, its light has taken 12 billion years to reach Earth. The observations therefore reveal a time when the universe was just 1.6 billion years old. “The environment around this quasar is unique in that it’s producing this huge mass of water,” says Matt Bradford, a scientist at NASA’s Jet Propulsion Laboratory (JPL), and a visiting associate at Caltech. “It’s another demonstration that water is pervasive throughout the universe, even at the very earliest times.” Bradford leads one of two international teams of astronomers that have described their quasar findings in separate papers that have been accepted for publication in the Astrophysical Journal Letters.

Read Bradford & team’s paper here.

A quasar is powered by an enormous black hole that is steadily consuming a surrounding disk of gas and dust; as it eats, the quasar spews out huge amounts of energy. Both groups of astronomers studied a particular quasar called APM 08279+5255, which harbors a black hole 20 billion times more massive than the sun and produces as much energy as a thousand trillion suns.

Since astronomers expected water vapor to be present even in the early universe, the discovery of water is not itself a surprise, Bradford says. There’s water vapor in the Milky Way, although the total amount is 4,000 times less massive than in the quasar, as most of the Milky Way’s water is frozen in the form of ice.

Nevertheless, water vapor is an important trace gas that reveals the nature of the quasar. In this particular quasar, the water vapor is distributed around the black hole in a gaseous region spanning hundreds of light-years (a light-year is about six trillion miles), and its presence indicates that the gas is unusually warm and dense by astronomical standards. Although the gas is a chilly –53 degrees Celsius (–63 degrees Fahrenheit) and is 300 trillion times less dense than Earth’s atmosphere, it’s still five times hotter and 10 to 100 times denser than what’s typical in galaxies like the Milky Way.

The water vapor is just one of many kinds of gas that surround the quasar, and its presence indicates that the quasar is bathing the gas in both X-rays and infrared radiation. The interaction between the radiation and water vapor reveals properties of the gas and how the quasar influences it. For example, analyzing the water vapor shows how the radiation heats the rest of the gas. Furthermore, measurements of the water vapor and of other molecules, such as carbon monoxide, suggest that there is enough gas to feed the black hole until it grows to about six times its size. Whether this will happen is not clear, the astronomers say, since some of the gas may end up condensing into stars or may be ejected from the quasar.

Bradford’s team made their observations starting in 2008, using an instrument called Z-Spec at the Caltech Submillimeter Observatory (CSO), a 10-meter telescope near the summit of Mauna Kea in Hawaii. Z-Spec is an extremely sensitive spectrograph, requiring temperatures cooled to within 0.06 degrees Celsius above absolute zero. The instrument measures light in a region of the electromagnetic spectrum called the millimeter band, which lies between infrared and microwave wavelengths. The researchers’ discovery of water was possible only because Z-Spec’s spectral coverage is 10 times larger than that of previous spectrometers operating at these wavelengths. The astronomers made follow-up observations with the Combined Array for Research in Millimeter-Wave Astronomy (CARMA), an array of radio dishes in the Inyo Mountains of Southern California.

This discovery highlights the benefits of observing in the millimeter and submillimeter wavelengths, the astronomers say. The field has developed rapidly over the last two to three decades, and to reach the full potential of this line of research, the astronomers—including the study authors—are now designing CCAT, a 25-meter telescope to be built in the Atacama Desert in Chile. CCAT will allow astronomers to discover some of the earliest galaxies in the universe. By measuring the presence of water and other important trace gases, astronomers can study the composition of these primordial galaxies.

The second group, led by Dariusz Lis, senior research associate in physics at Caltech and deputy director of the CSO, used the Plateau de Bure Interferometer in the French Alps to find water. In 2010, Lis’s team was looking for traces of hydrogen fluoride in the spectrum of APM 08279+5255, but serendipitously detected a signal in the quasar’s spectrum that indicated the presence of water. The signal was at a frequency corresponding to radiation that is emitted when water transitions from a higher energy state to a lower one. While Lis’s team found just one signal at a single frequency, the wide bandwidth of Z-Spec enabled Bradford and his colleagues to discover water emission at many frequencies. These multiple water transitions allowed Bradford’s team to determine the physical characteristics of the quasar’s gas and the water’s mass.

Read Lis & team’s paper here.

Timelapse: Milky Way from the Dakotas

Growing up in the Dakotas, I can attest to the dark skies that grace the northern plains. However, there is also cold weather (even in the spring) and — at times — almost unbelievably windy conditions. But that didn’t stop videographer Randy Halverson from shooting this magnificent timelapse video of the Milky Way. And in fact, his low shots enhance the beauty of the landscape and sky. “There were very few nights, when I could shoot, that were perfectly clear, and often the wind was blowing 25mph +,” Halverson said. “That made it hard to get the shots I wanted. I kept most of the shots low to the ground, so the wind wouldn’t catch the setup and cause camera shake, or blow it over.”

Ten seconds of the video is about 2 hours 20 minutes in real time. Randy tells us he has been doing astro timelapse for only about 16 months, but shooting other types of video since the mid 90’s. See more of his marvelous work at his Dakotalapse website.

Hubble Finds “Oddball” Stars in Milky Way Hub

Astronomers using the Hubble Space Telescope to peer deep into the central bulge of our galaxy have found a population of rare and unusual stars. Dubbed “blue stragglers”, these stars seem to defy the aging process, appearing to be much younger than they should be considering where they are located. Previously known to exist within ancient globular clusters, blue stragglers have never been seen inside our galaxy’s core – until now.

The stars were discovered following a seven-day survey in 2006 called SWEEPS – the Sagittarius Window Eclipsing Extrasolar Planet Search – that used Hubble to search a section of the central portion of our Milky Way galaxy, looking for the presence of Jupiter-sized planets transiting their host stars. During the search, which examined 180,000 stars, Hubble spotted 42 blue stragglers.

Of the 42 it’s estimated that 18 to 37 of them are genuine.

What makes blue stragglers such an unusual find? For one thing, stars in the galactic hub should appear much older and cooler… aging Sun-like stars and old red dwarfs. Scientists believe that the central bulge of the Milky Way stopped making new stars billions of years ago. So what’s with these hot, blue, youthful-looking “oddballs”? The answer may lie in their formation.

Artist's concept of a blue straggler pair. NASA, ESA, and G. Bacon (STScI)

A blue straggler may start out as a smaller member of a binary pair of stars. Over time the larger star ages and gets even bigger, feeding material onto the smaller one. This fuels fusion in the smaller star which then grows hotter, making it shine brighter and bluer – thus appearing similar to a young star.

However they were formed, just finding the blue stragglers was no simple task. The stars’ orbits around the galactic core had to be determined through a confusing mix of foreground stars within a very small observation area. The region of the sky Hubble studied was no larger than the width of a fingernail held at arm’s length! Still, within that small area Hubble could see over 250,000 stars. Incredible.

“Only the superb image quality and stability of Hubble allowed us to make this measurement in such a crowded field.”

– Lead author Will Clarkson, Indiana University in Bloomington and the University of California in Los Angeles

The discovery of these rare stars will help astronomers better understand star formation in the Milky Way’s hub and thus the evolution of our galaxy as a whole.

Read more on the Hubble News Center.

Image credit: NASAESA, W. Clarkson (Indiana University and UCLA), and K. Sahu (STScI)

Awe-Inspiring View of the Milky Way

The Milky Way as seen near the Very Large Telescope in the Atacama Desert. Credit: ESO/Y. Beletsky

[/caption]

The Chilean Atacama Desert boasts some of the darkest skies on Earth – which is why it is home to several telescopes, including the Very Large Telescope. This beautiful panoramic image was taken there, showing the VLT’s Unit Telescope 1, and across on the other side of the image are the Large and Small Magellanic Clouds glowing brightly. Like an arch in between is plane of our Milky Way galaxy. This awe-inspiring image was taken by ESO Photo Ambassador Yuri Beletsky. These photographers specialize in taking images of not only the night sky, but also the large telescopes that give us eyes to see across the great distances of our Universe.

See this ESO page for a larger version of this image.