Andromeda Galaxy. Credit: Wikipedia Commons/Adam Evans
Since ancient times, astronomers have looked up at the night sky and seen the Andromeda galaxy. As the closest galaxy to our own, scientists have been able to observe and scrutinize this giant spiral galaxy for millennia. By the 20th century, astronomers realized that Andromeda was the Milky Way’s sister galaxy and was moving towards us. In 4.5 billion years, it will even merge with our own to form a supergalaxy.
However, it seems astronomers were wrong about the Andromeda galaxy in one major respect. According to recent study led by a team of French and Chinese astronomers, this giant spiral galaxy formed from a major merger that occurred less than 3 billion years ago. This means that Andromeda, as we know it today, is effectively younger than our very own Solar System, which has it beat by about 1.5 billion years!
For the sake of their study, the relied on data gathered by recent surveys that noted considerable differences between the Andromeda and Milky Way galaxies. The first of these studies, which took place between 2006 and 2014, demonstrated all Andromeda has a wealth of young blue stars in its disk (less than 2 billion years old) that undergo random motions over large scales. This is contrast to the stars in the Milky Way’s disk, which are subject only to simple rotation.
In addition, deep observations conducted between 2008 and 2014 with the French-Canadian telescope in the Hawaiian Islands (CFHT) indicated some interesting things about Andromeda’s halo. This vast region, which is 10 times the size of the galaxy itself, is populated by gigantic currents of stars. The most prominent of which is called the “Giant Stream”, a warped disk that has shells and clumps at its very edges.
Using this data, the French-Chinese collaboration then created a detailed numerical model of Andromeda using the two most powerful computers available in France – the Paris Observatory’s MesoPSL and the National Center for Scientific Research’s (CNRS) IDRIS-GENCI supercomputer. With the resulting numerical model, the team was able to demonstrate that these recent observations could be explained only by a recent collision.
Basically, they concluded that between 7 and 10 billion years ago, Andromeda consisted of two galaxies that had slowly achieved a encountering orbit. After optimizing the trajectories of both galaxies, they determined that they would have collided 1.8 to 3 billion years ago. This collision is what gave birth to Andromeda as we know it today, which effectively makes it younger than our Solar System – which formed almost 4.6 billion years ago.
What’s more, they were able to calculate mass distributions for both parent galaxies that merged to formed Andromeda, which indicated that the larger galaxy was four times the size of the smaller. But most importantly, the team was able to reproduce in detail all the structures that compose Andromeda today – including the bulge, the bar, the huge disk, and the presence of young stars.
The presence of young blue stars in its disk, which has remained unexplained until now, is attributable to a period of intense star formation that took place after the collision. In addition, structures like the “Giant Stream” and the shells of the halo belonged to the smaller parent galaxy, whereas the diffuse clumps and the warped nature of the halo were derived from the larger one.
Their study also explains why the features attributed to the smaller galaxy have an under-abundance in heavy elements compared to the others – i.e. it was less massive so it formed fewer heavy elements and stars. This study is immensely significant when it comes to galactic formation and evolution, mainly because it is the first numerical simulation that has succeeded in reproducing a galaxy in such detail.
It is also of significance given that such a recent impact it could have left materials in the Local Group. In other words, this study could have implications that range far beyond our galactic neighborhood. It is also a good example of how increasingly sophisticated instruments are leading to more detailed observations which, when combined with increasingly sophisticated computers and algorithms, are leading to more detailed models.
One can only wonder if future extra-terrestrial intelligence (ETI) will draw similar conclusions about our own galaxy once it merges with Andromeda, billions of years from now. The collision and resulting features are sure to be of interest to anyone advanced species that’s around to study it!
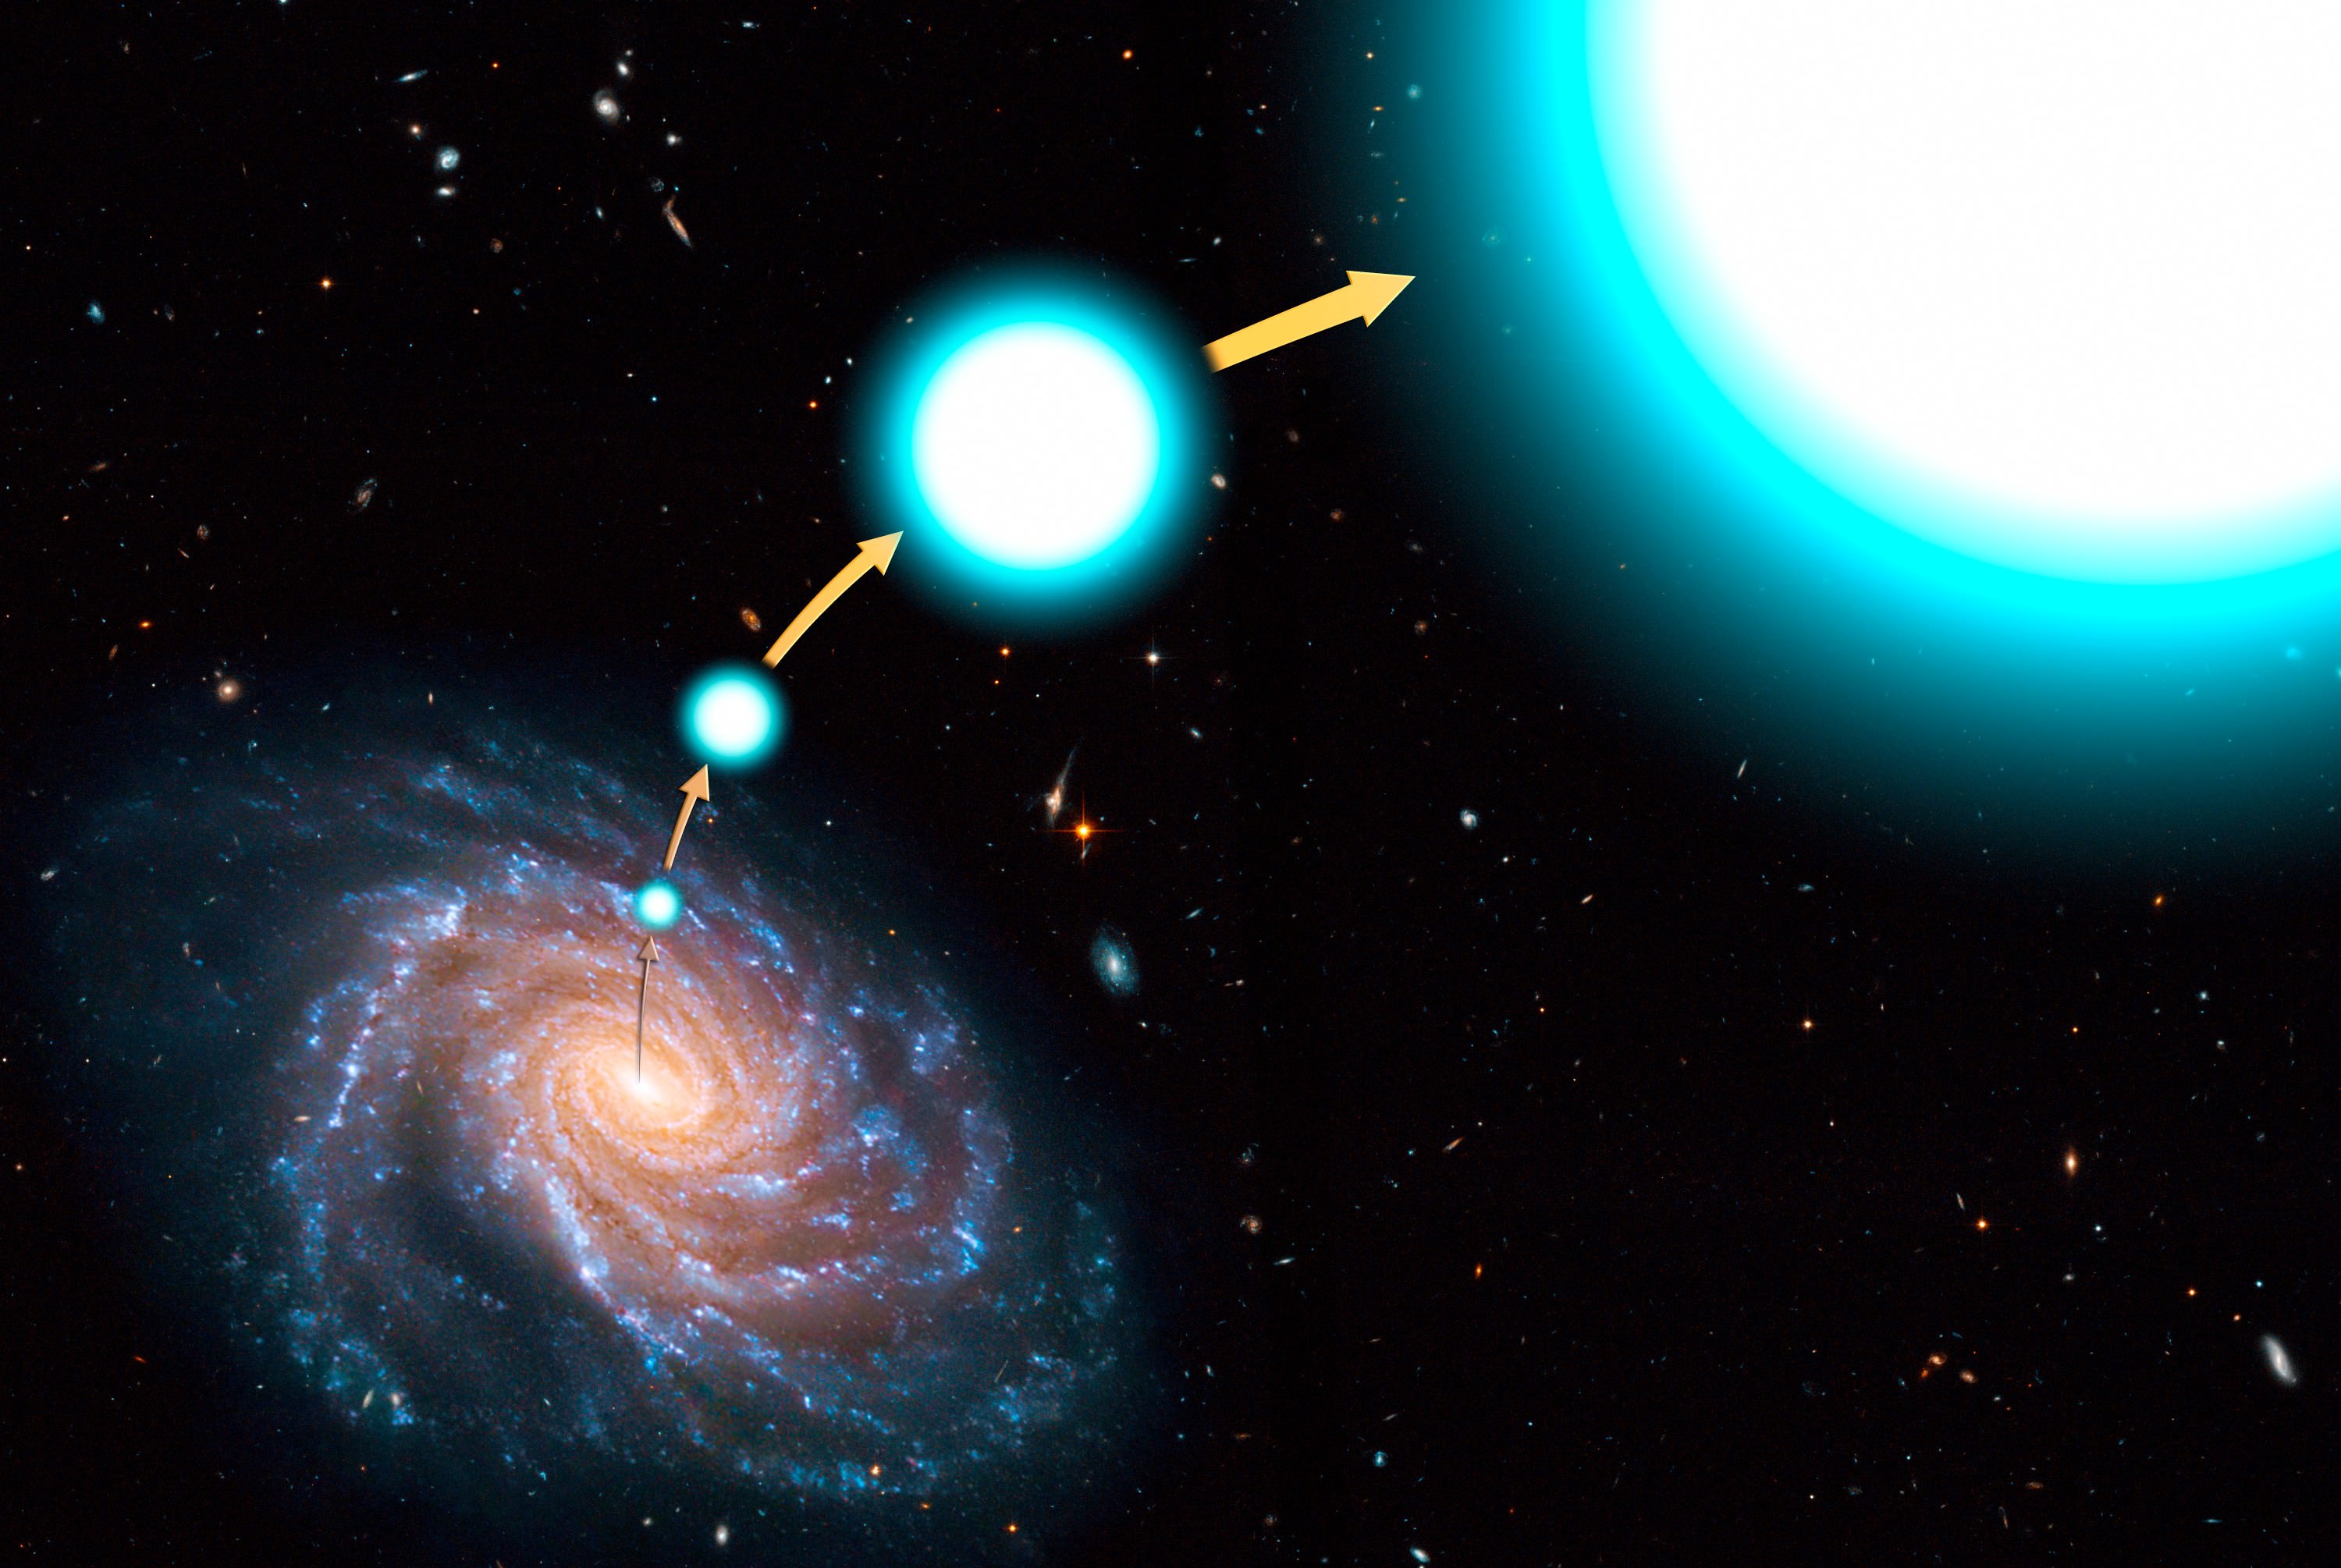
A recent survey has discovered the first stars of the Milky Way. Credit: Gabriel Pérez, SMM (IAC)
According to modern cosmological models, the Universe began in a cataclysm event known as the Big Bang. This took place roughly 13.8 billion years ago, and was followed by a period of expansion and cooling. During that time, the first hydrogen atoms formed as protons and electrons combined and the fundamental forces of physics were born. Then, about 100 million years after the Big Bang, that the first stars and galaxies began to form.
The formation of the first stars was also what allowed for the creation of heavier elements, and therefore the formation of planets and all life as we know it. However, until now, how and when this process took place has been largely theoretical since astronomers did not know where the oldest stars in our galaxy were to be found. But thanks to a new study by a team of Spanish astronomers, we may have just found the oldest star in the Milky Way!
Artist’s impression of the Milky Way Galaxy. Credit: NASA/JPL-Caltech/R. Hurt (SSC-Caltech)
This star is located roughly 7,500 light years from the Sun, and was found in the halo of the Milky Way along the line of sight to the Lynx constellation. Known as J0815+4729, this star is still in its main sequence and has a low mass, (around 0.7 Solar Masses), though the research team estimates that it has a surface temperature that is about 400 degrees hotter – 6,215 K (5942 °C; 10,727 °F) compared to 5778 K (5505 °C; 9940 °F).
For the sake of their study, the team was looking for a star that showed signs of being metal-poor, which would indicate that it has been in its main sequence for a very long time. The team first selected J0815+4729 from the Sloan Digital Sky Survey-III Baryon Oscillation Spectroscopic Survey (SDSS-III/BOSS) and then conducted follow-up spectroscopic investigations to determine its composition (and hence its age).
Consistent with what modern theory predicts, the star was found in the Galactic halo – the extended component of our galaxy that reaches beyond the galactic disk (the visible portion). It is in this region that the oldest and most metal-poor stars are believed to be found in galaxies, hence why the team was confident that a star dating back to the early Universe would be found here.
The William Herschel Telescope, part of the Isaac Newton group of telescopes, located on Canary Island. Credit: ing.iac.es
As Jonay González Hernández – a professor from the University of La Laguna, a member of the IAC and a co-author on the paper – explained in an IAC press release:
“Theory predicts that these stars could use material from the first supernovae, whose progenitors were the first massive stars in the galaxy, around 300 million years after the Big Bang. In spite of its age, and its distance away from us, we can still observe it.”
Spectra obtained by both the ISIS and OSIRIS instruments confirmed that the star was poor in metals, indicating that J0815+4729 has only one-millionth of the calcium and iron that the Sun contains. In addition, the team also noticed that the star has a higher carbon content than our Sun, accounting for almost 15% percent of its solar abundance (i.e. the relative abundance of its elements).
In short, J0815+4729 may be the most iron-poor and carbon-rich star currently known to astronomers. Moreover, finding it was rather difficult since the star is both weak in luminosity and was buried within a massive amount of SDSS/BOSS archival data. As Carlos Allende Prieto, another IAC researcher and a co-author on the paper, indicated:
“This star was tucked away in the database of the BOSS project, among a million stellar spectra which we have analysed, requiring a considerable observational and computational effort. It requires high-resolution spectroscopy on large telescopes to detect the chemical elements in the star, which can help us to understand the first supernovae and their progenitors.”
In the near future, the team predicts that next-generation spectrographs could allow for further research that would reveal more about the star’s chemical abundances. Such instruments include the HORS high-resolution spectrograph, which is presently in a trial phase on the Gran Telescopio Canarias (GTC).
“Detecting lithium gives us crucial information related to Big Bang nucleosynthesis,” said Rafael Rebolo, the director of the IAC and a coauthor of the paper. “We are working on a spectrograph of high-resolution and wide spectral range in order to measure the detailed chemical composition of stars with unique properties such as J0815+4719.”
These future studies are sure to be a boon for astronomers and cosmologists. In addition to being a chance to study stars that formed when the Universe was still in its infancy, they could provide new insight into the early stages of the universe, the formation of the first stars, and the properties of the first supernovae. In other words, they would put us a step closer to know how the Universe as we know it formed and evolved.
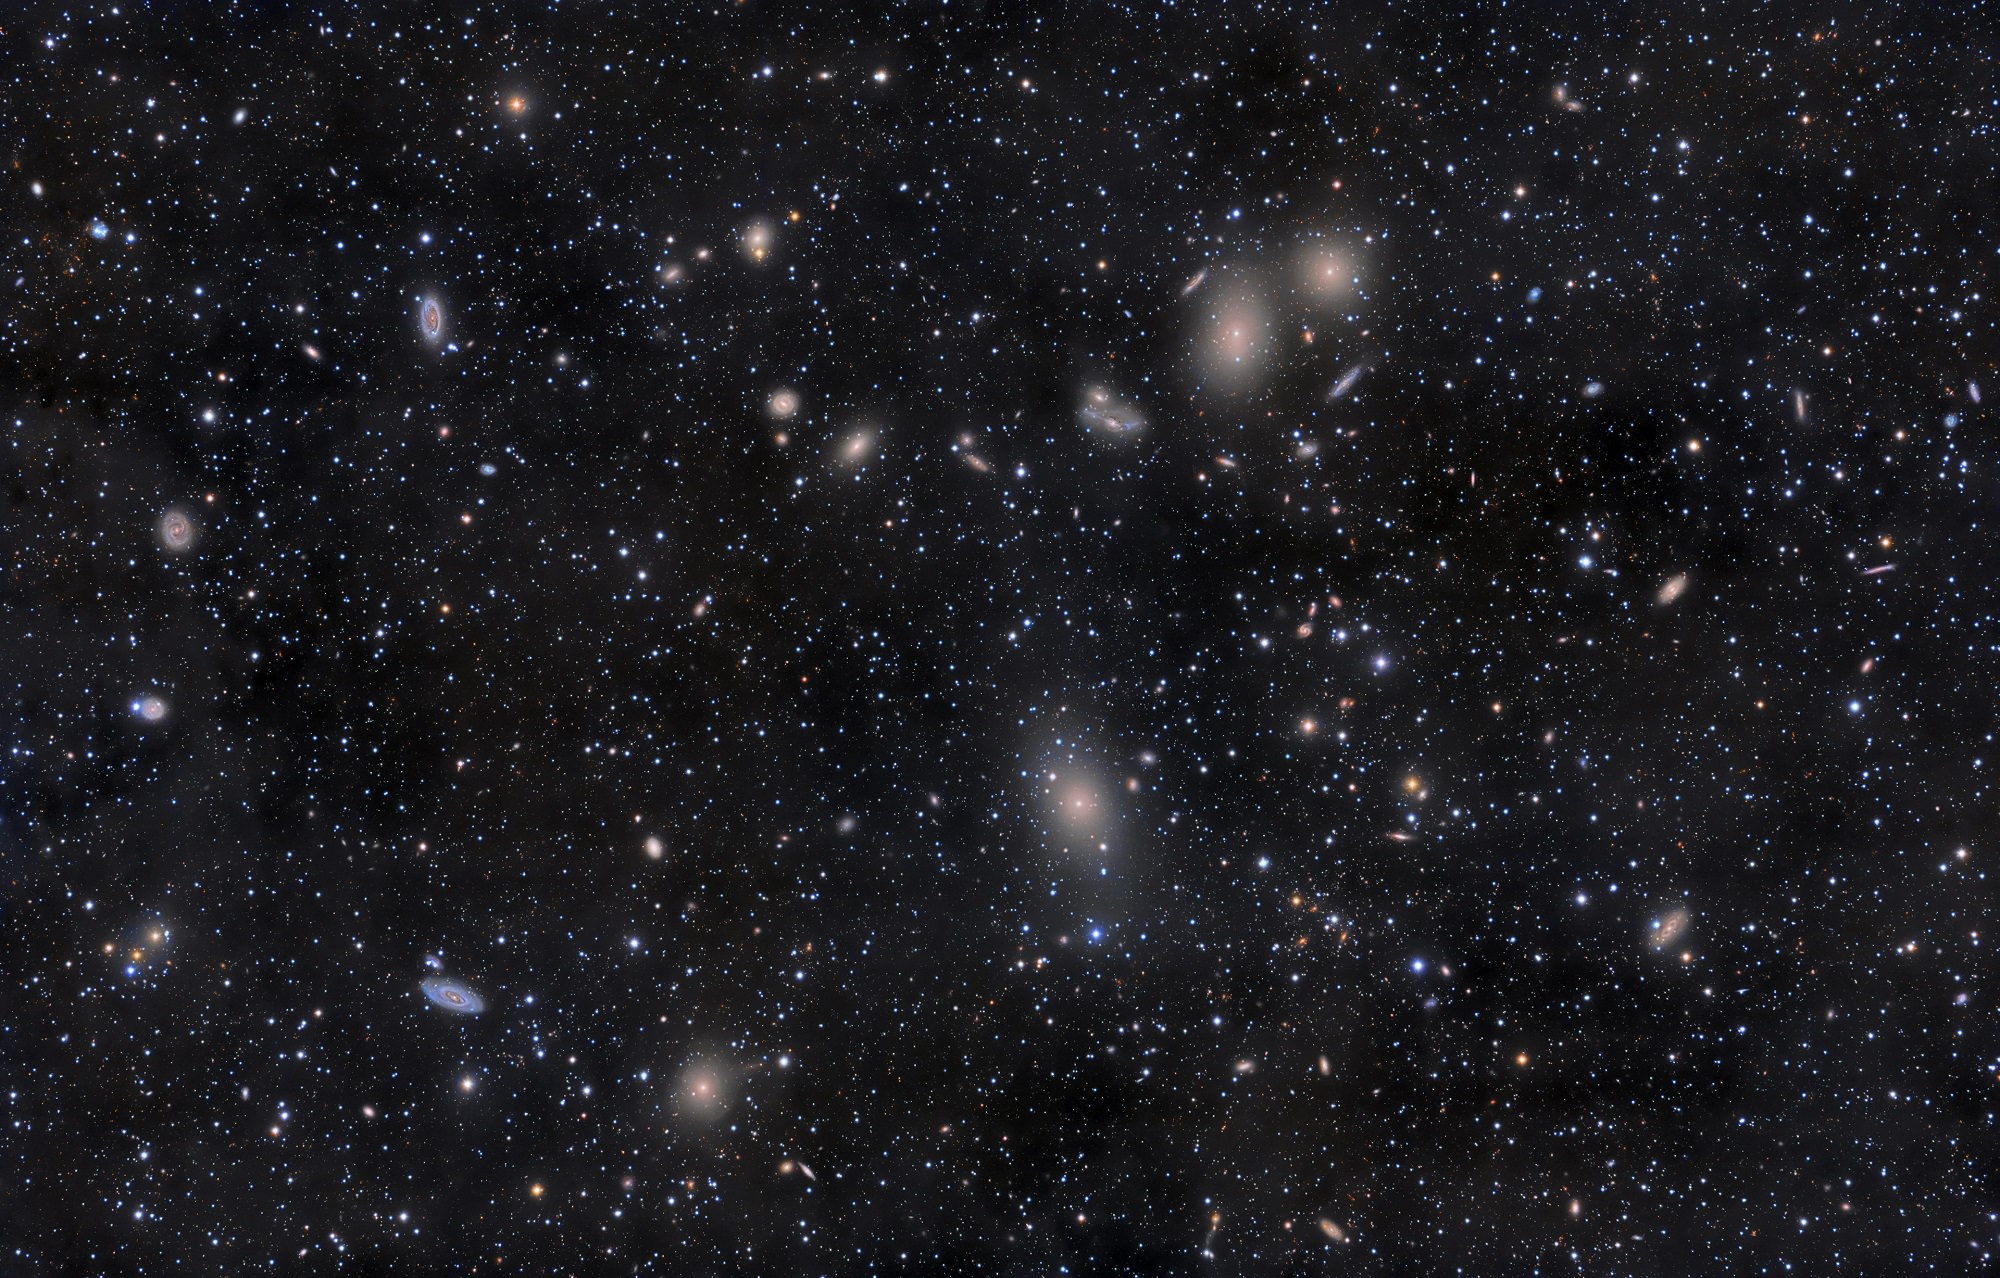
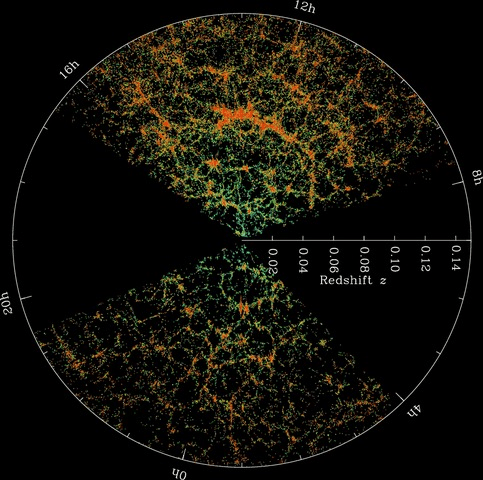
A mosaic of telescopic images showing the galaxies of the Virgo Supercluster. It's part of the cosmic web in which a galaxy can exist during part of its evolution. Credit: NASA/Rogelio Bernal Andreo
For almost a century, astronomers have understood that the Universe is in a state of expansion. This is a consequence of General Relativity, and the rate at which it is expanding is known as the Hubble Constant – named after the man who first noticed the phenomena. However, astronomers have also learned that withing the large-scale structures of the Universe, galaxies and clusters have also been moving closer and relative to one other.
For decades, astronomers have sought to track how these movements have taken place over the course of cosmic history. And thanks to the efforts of international team of astronomers, the most detailed map to date of the orbits of galaxies that lie within the Virgo Supercluster has been created. This map encompasses the past motions of almost 1,400 galaxies within 100 million light years of space, showing how our cosmic neighborhood has changed.
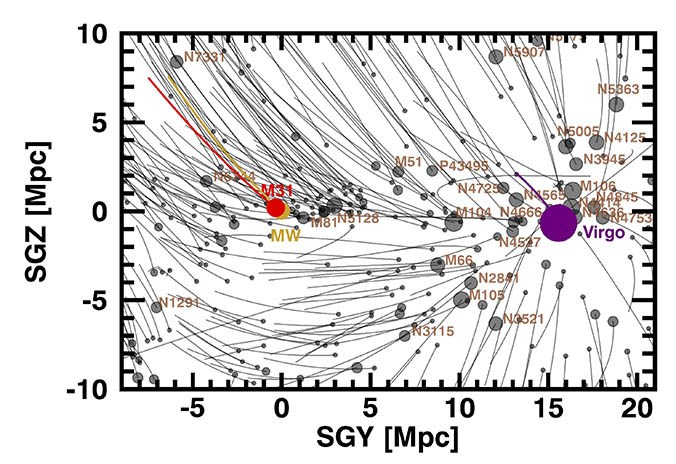
Orbits of galaxies in the Local Supercluster. Credit: Brent Tully.
For the sake of their study, the team used data from the CosmicFlows surveys, a series of three studies that calculated the distance and speed of neighboring galaxies between 2011 and 2016. Several members of the study team were involved in these surveys, which they then paired with other distance and gravity field estimates to construct a massive flow study of the Virgo Supercluster.
From this, they were able to create computer models that charted the motions of almost 1,400 galaxies within 100 million light years, and over the course of 13 billion years (just 800 million years after the Big Bang). As Brent Tully, an astronomer with the UH Institute of Astronomy and a co-author on the study, explained in a UH press release:
“For the first time, we are not only visualizing the detailed structure of our Local Supercluster of galaxies but we are seeing how the structure developed over the history of the universe. An analogy is the study of the current geography of the Earth from the movement of plate tectonics.”
What they found was that their models fit the present day velocity flow well, meaning that the structures and speeds they observed in their models fit with what has been observed from galaxies in the present day. They also determined that within the area of space they mapped, the main gravitational attractor is the Virgo Cluster – which is located about 50 million light years away and contains between 1300 and 2000 galaxies.
Moreover, their study indicated that more than a thousand galaxies have fallen into the Virgo Cluster in the past 13 billion years, while all galaxies within 40 million light-years of the cluster will eventually be captured. At present, the Milky Way lies just outside this capture zone, but both the Milky Way and the Andromeda Galaxy are destined to merge in the next 4 billion years.
Once they do, the fate of the resulting massive galaxy will be similar to the rest of the galaxies in the area of study. This was another takeaway from the study, where the team determined that these merger events are merely part of a larger pattern. Basically, within the region of space they observed, there are two overarching flow patterns. Within one hemisphere of this region, all galaxies – including the Milky Way – are streaming towards a single flat sheet.
At the same time, every galaxy over the entire volume of space is moving towards gravitational attractors that are located far beyond the area of study. They determined that these outside forces are none other than the Centaurus Supercluster – a cluster of hundreds of galaxies, located approximately 170 million light years away in the Centaurus constellation – and the Great Attractor.
The Great Attractor is located 150 million light years away, and is a mysterious region that cannot be seen because of its location (on the opposite side of the Milky Way). However, for decades, scientists have known that our galaxy and other nearby galaxies are moving towards it. The region is also the core of the Laniakea Supercluster, a region that spans more than 500 million light-years and contains about 100,000 large galaxies.
In short, while the Universe is in a state of expansion, the dynamics of galaxies and galaxy clusters indicate that they still gravitate into tighter structures. Within our cosmic neighborhood, the main attractor is clearly the Virgo Cluster, which is affecting all galaxies within a 40 million light-year radius. Beyond this, it is the Centaurus Supercluster and the Great Attractor (as part of the larger Laniakea Supercluster) that is tugging at our strings.
By charting this process of attraction that has been taking place over the past 13 billion years, astronomers and cosmologists are able to see just how our Universe has evolved over the course of the majority of its history. With time, and improved instruments that are capable of looking even deeper into the cosmos (such as the James Webb Space Telescope) we are expected to be able to probe even further back towards the beginning of the cosmos.
Charting how our Universe has changed over time not only confirms our cosmological models and verifies predominant theories about how matter behaves on the largest of scales (i.e. General Relativity). It also allows scientists to predict the future of our Universe with a fair degree of certainty, modelling how galaxies and superclusters will eventually come together to form even larger structures.
The team also created a video showing the results of their study, as well as an interactive model that let’s users examine the frame of reference from multiple vantage points. Be sure to check out the video below, and head on over to the UH page to access their interactive model.
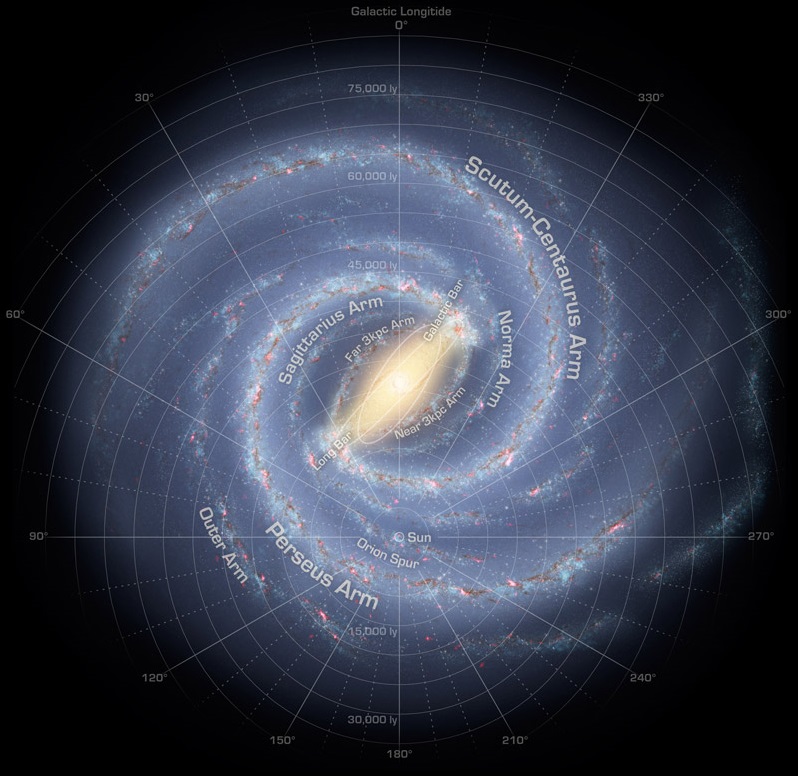
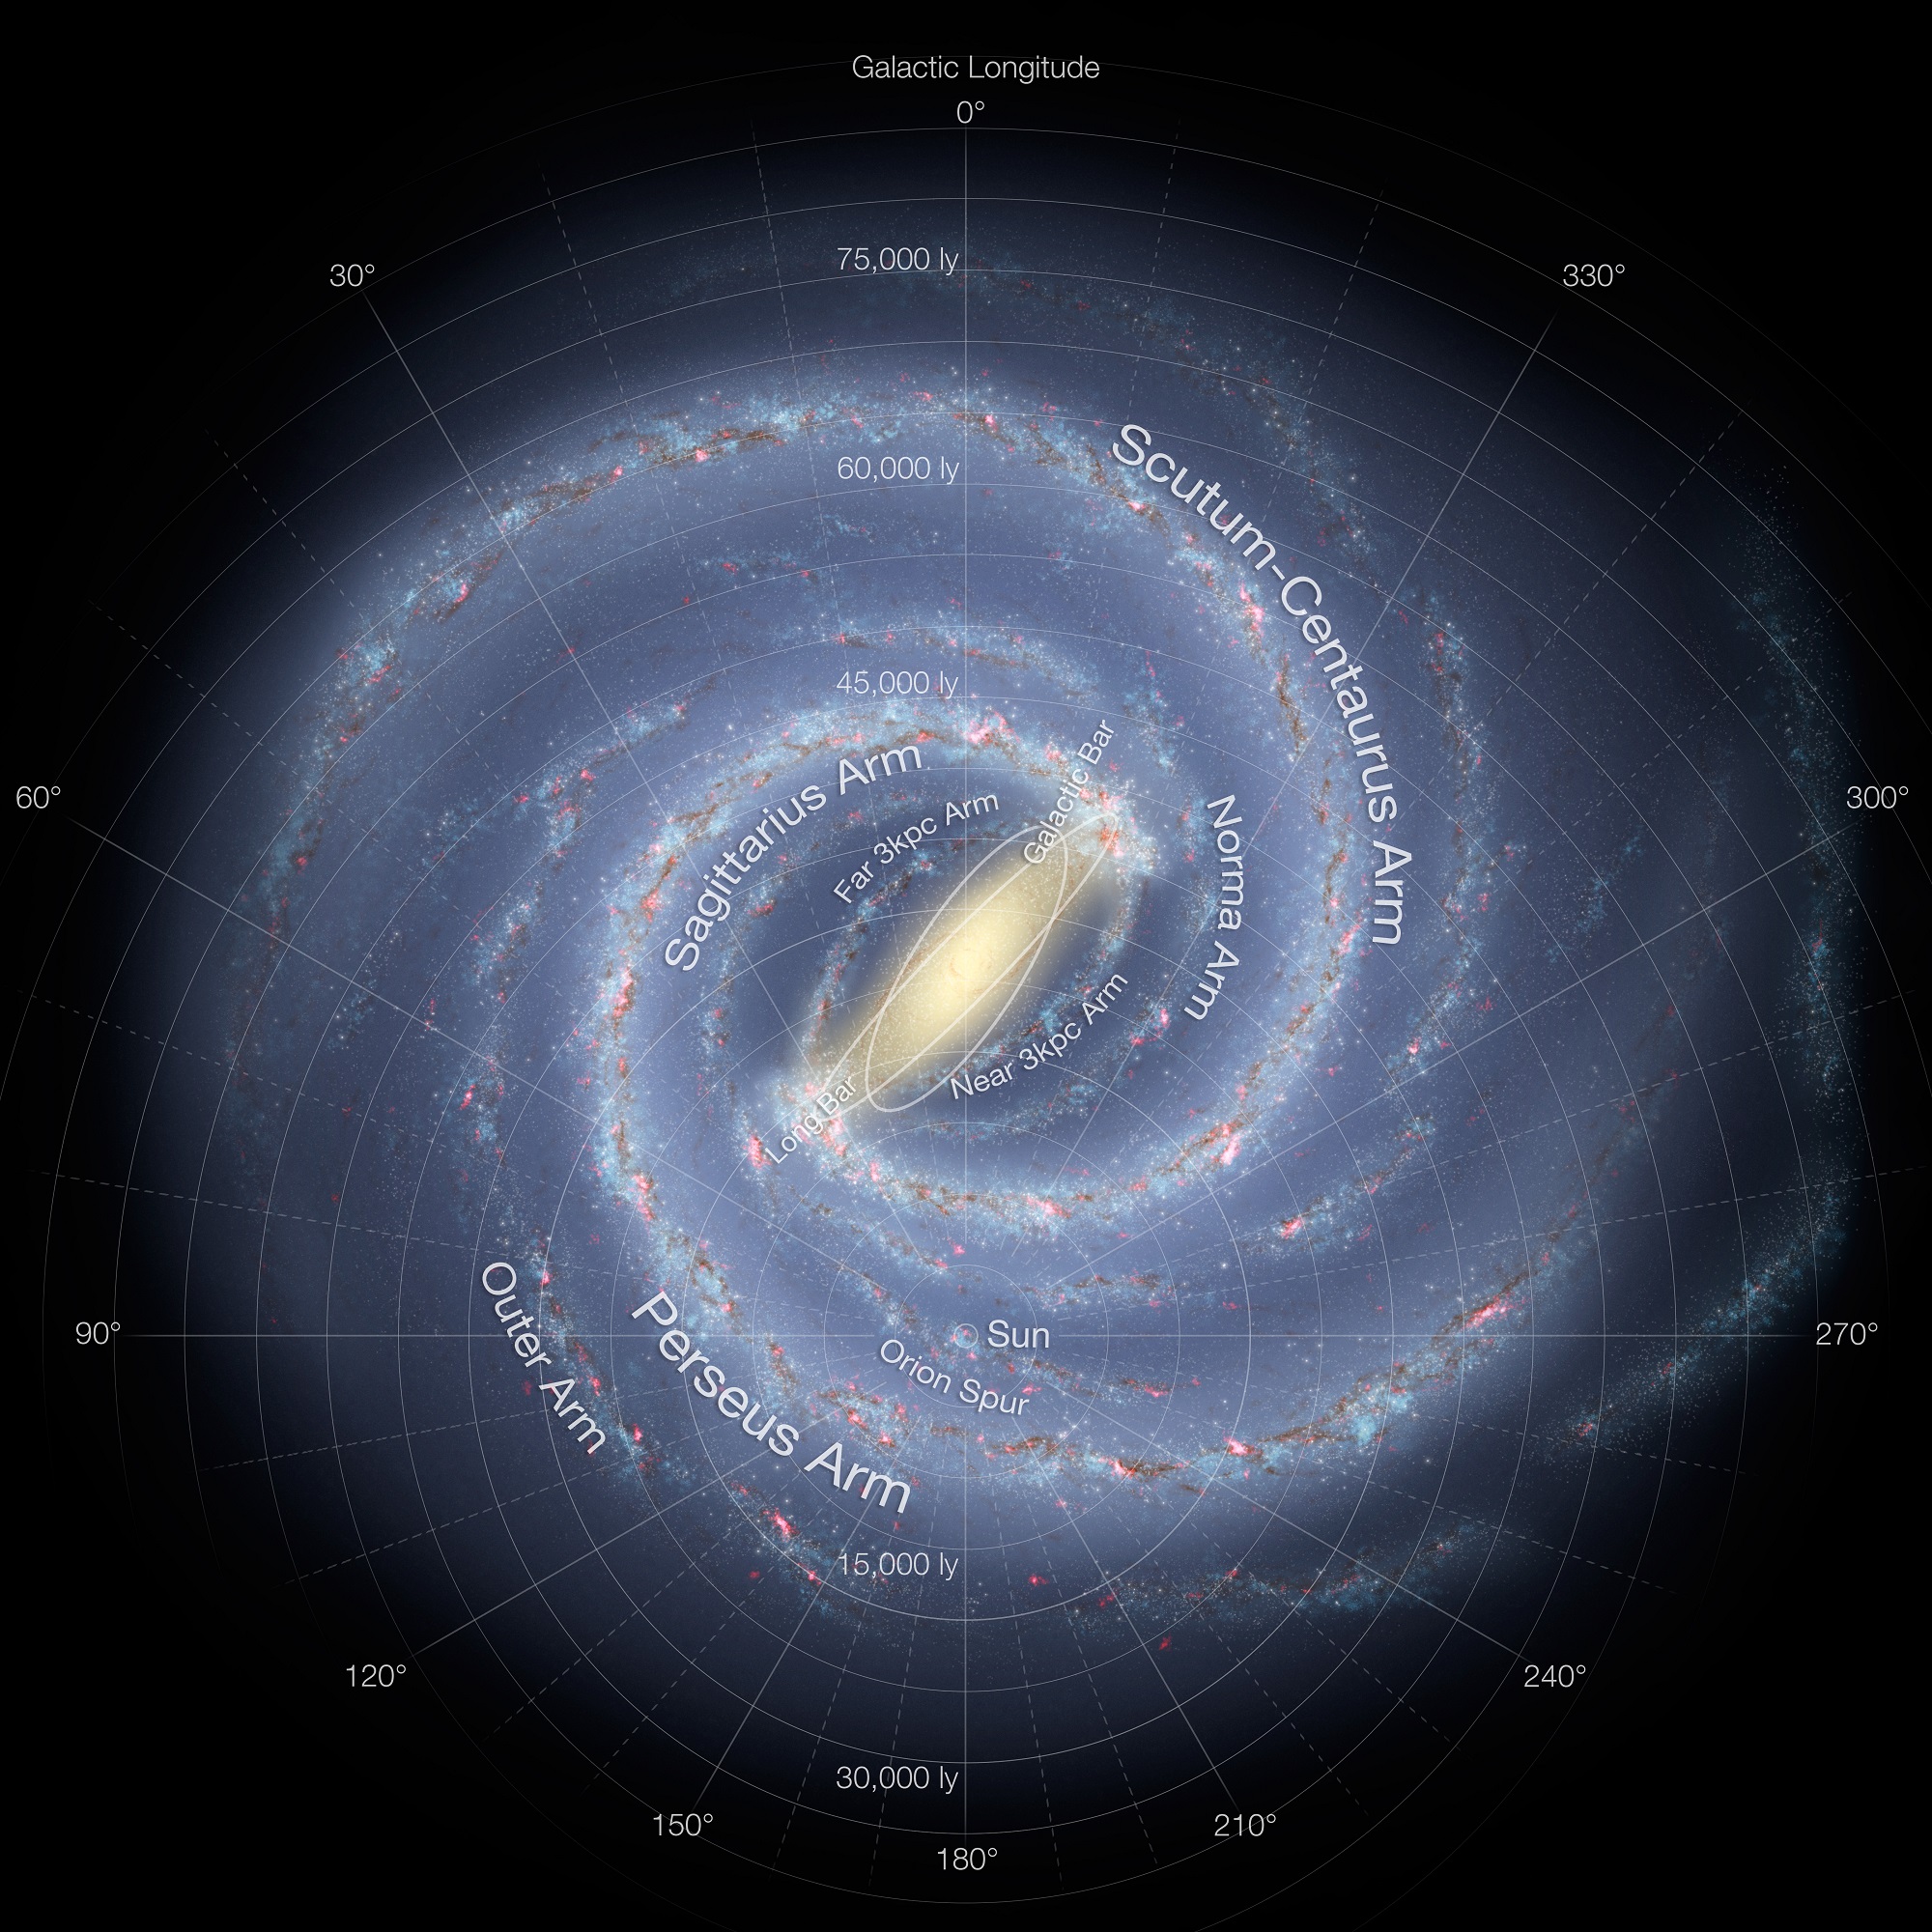
Artist's impression of the spiral structure of the Milky Way with two major stellar arms and a bar. Credit: NASA/JPL-Caltech/ESO/R. Hurt
Since the 18th century, astronomers have been aware that our Solar System is embedded in a vast disk of stars and gas known as the Milky Way Galaxy. Since that time, the greatest scientific minds have been attempting to obtain accurate distance measurements in order to determine just how large the Milky Way is. This has been no easy task, since the fact that we are embedded in our galaxy’s disk means that we cannot view it head-on.
Artist’s view of the Milky Way with the location of the Sun and the star forming region at the opposite side in the Scutum-Centaurus spiral arm. Credit: Bill Saxton, NRAO/AUI/NSF; Robert Hurt, NASA.
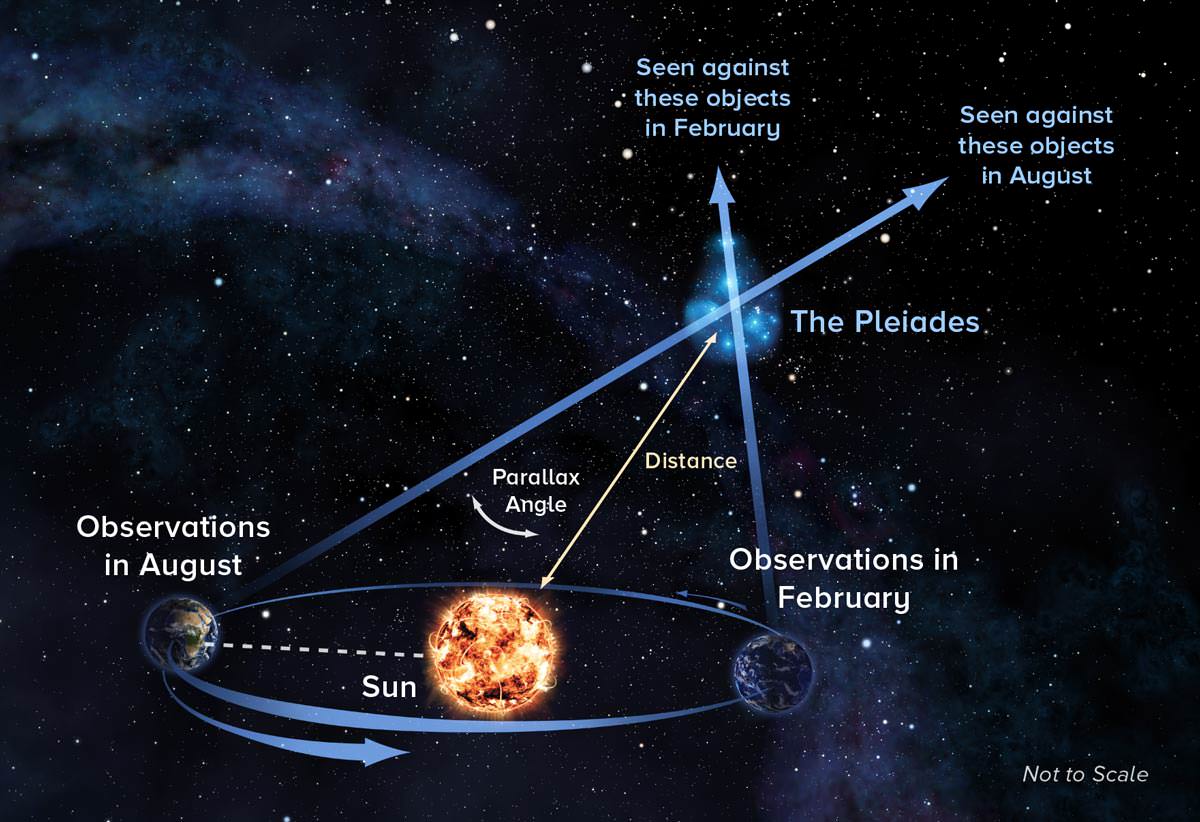
To do this, the team relied on a technique first applied by Freidrich Wilhelm Bessel in 1838 to measure the distance to the star 61 Cygni. Known as trigonometric parallax, this technique involves viewing an object from opposite sides of the Earth’s orbit around the Sun, and then measuring the angle of the object’s apparent shift in position. In this way, astronomers are able to use simple trigonometry to calculate the distance to that object.
In short, the smaller the measured angle, the greater the distance to the object. These measurements were performed using data from the Bar and Spiral Structure Legacy (BeSSeL) Survey, which was named in honor of Freidrich Wilhelm Bessel. But whereas Bessel and his contemporaries were forced to measure parallax using basic instruments, the VLBA has ten dish antennas distributed across North America, Hawaii, and the Caribbean.
With such an array at its disposal, the VLBA is capable of measuring parallaxes with one thousand times the accuracy of those performed by astronomers in Bessel’s time. And rather than being confined to nearby star systems, the VLBA is capable of measuring the minuscule angles associated with vast cosmological distances. As Sanna explained in a recent MPIfR press release:
“Using the VLBA, we now can accurately map the whole extent of our Galaxy. Most of the stars and gas in our Galaxy are within this newly-measured distance from the Sun. With the VLBA, we now have the capability to measure enough distances to accurately trace the Galaxy’s spiral arms and learn their true shapes.”
With parallax technique, astronomers observe object at opposite ends of Earth’s orbit around the Sun to precisely measure its distance. Credit: Alexandra Angelich, NRAO/AUI/NSF.
The VLBA observations, which were conducted in 2014 and 2015, measured the distance to the star-forming region known as G007.47+00.05. Like all star-forming regions, this one contains molecules of water and methanol, which act as natural amplifiers of radio signals. This results in masers (the radio-wave equivalent of lasers), an effect that makes the radio signals appear bright and readily observable with radio telescopes.
This particular region is located over 66,000 light years from Earth and at on opposite side of the Milky Way, relative to our Solar System. The previous record for a parallax measurement was about 36,000 light-years, roughly 11,000 light years farther than the distance between our Solar System and the center of our galaxy. As Sanna explained, this accomplishment in radio astronomy will enable surveys that reach much farther than previous ones:
“Most of the stars and gas in our Galaxy are within this newly-measured distance from the Sun. With the VLBA, we now have the capability to measure enough distances to accurately trace the Galaxy’s spiral arms and learn their true shapes.”
Hundreds of star-forming regions exist within the Milky Way. But as Karl Menten – a member of the MPIfR and a co-author on the study – explained, this study was significant because of where this one is located. “So we have plenty of ‘mileposts’ to use for our mapping project,” he said. “But this one is special: Looking all the way through the Milky Way, past its center, way out into the other side.”
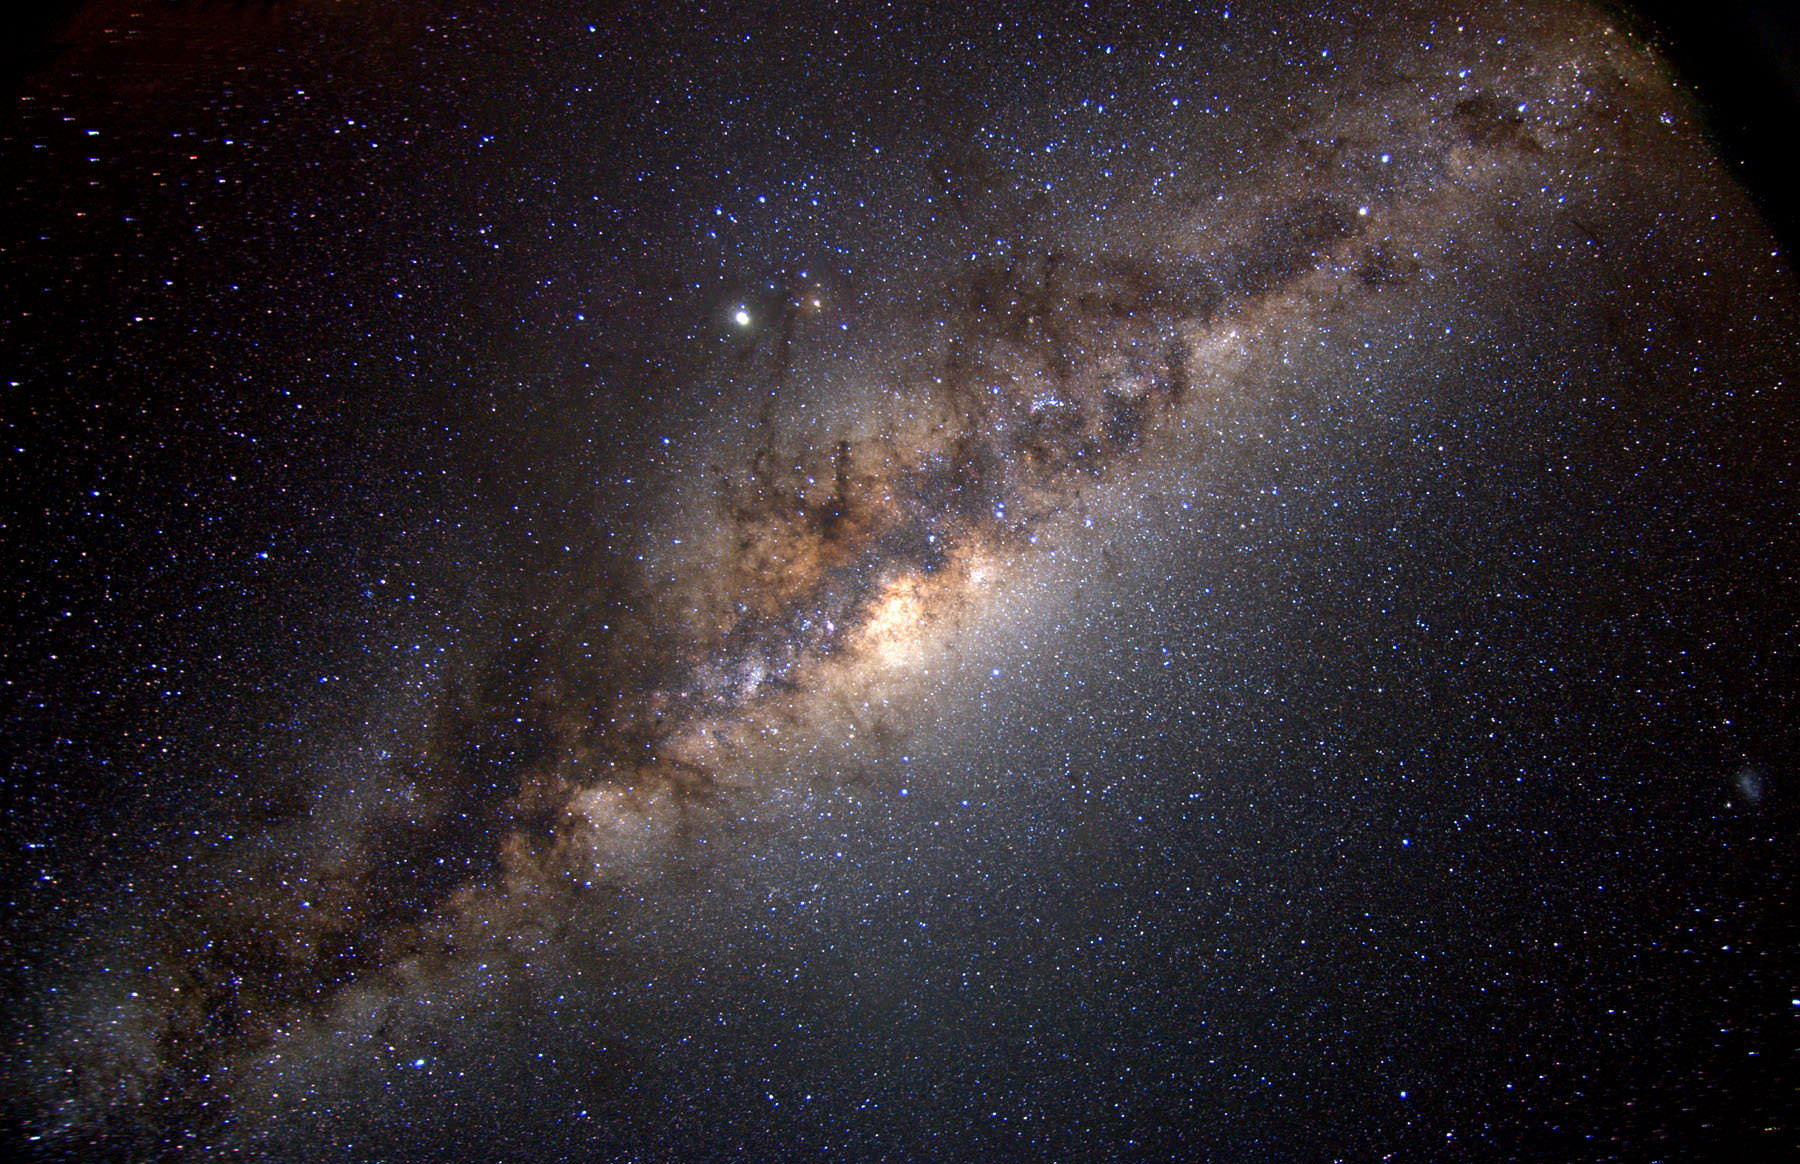
The band of light (the Milky Way) that is visible in the night sky, showing the stellar disk of our galaxy. Credit: Bob King
In the coming years, Sanna and his colleagues hope to conduct additional observations of G007.47+00.05 and other distant star-forming regions of the Milky Way. Ultimately, the goal is to gain a complete understanding of our galaxy, one that is so accurate that scientists will be able to finally place precise constraints on its size, mass, and its total number of stars.
With the necessary tools now in hand, Sanna and his team even estimate that a complete picture of the Milky Way could be available in about ten years time. Imagine that! Future generations will be able to study the Milky Way with the same ease as one that is located nearby, and which they can view edge-on. At long last, all those artist’s impression of our Milky Way will be to scale!
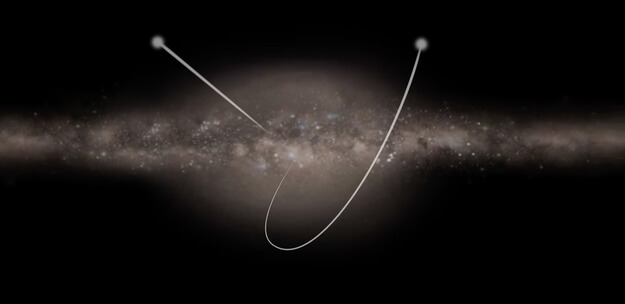
An artist's conception of a hypervelocity star that has escaped the Milky Way. Credit: NASA
For centuries, astronomers have been looking beyond our Solar System to learn more about the Milky Way Galaxy. And yet, there are still many things about it that elude us, such as knowing its precise mass. Determining this is important to understanding the history of galaxy formation and the evolution of our Universe. As such, astronomers have attempted various techniques for measuring the true mass of the Milky Way.
So far, none of these methods have been particularly successful. However, a new study by a team of researchers from the Harvard-Smithsonian Center for Astrophysics proposed a new and interesting way to determine how much mass is in the Milky Way. By using hypervelocity stars (HVSs) that have been ejected from the center of the galaxy as a reference point, they claim that we can constrain the mass of our galaxy.
Their study, titled “Constraining Milky Way Mass with Hypervelocity Stars“, was recently published in the journal Astronomy and Astrophysics. The study was produced by Dr. Giacomo Fragione, an astrophysicist at the University of Rome, and Professor Abraham Loeb – the Frank B. Baird, Jr. Professor of Science, the Chair of the Astronomy Department, and the Director of the Institute for Theory and Computation at Harvard University.
Stars speeding through the Galaxy. Credit: ESA
To be clear, determining the mass of the Milky Way Galaxy is no simple task. On the one hand, observations are difficult because the Solar System lies deep within the disk of the galaxy itself. But at the same time, there’s also the mass of our galaxy’s dark matter halo, which is difficult to measure since it is not “luminous”, and therefore invisible to conventional methods of detection.
Current estimates of the galaxy’s total mass are based on the motions of tidal streamers of gas and globular clusters, which are both influenced by the gravitational mass of the galaxy. But so far, these measurements have produced mass estimates that range from one to several trillion solar-masses. As Professor Loeb explained to Universe Today via email, precisely measuring the mass of the Milky Way is of great importance to astronomers:
“The Milky Way provides a laboratory for testing the standard cosmological model. This model predicts that the number of satellite galaxies of the Milky Way depends sensitively on its mass. When comparing the predictions to the census of known satellite galaxies, it is essential to know the Milky Way mass. Moreover, the total mass calibrates the amount of invisible (dark) matter and sets the depth of the gravitational potential well and implies how fast should stars move for them to escape to intergalactic space.”
For the sake of their study, Prof. Loeb and Dr. Fragione therefore chose to take a novel approach, which involved modeling the motions of HVSs to determine the mass of our galaxy. More than 20 HVSs have been discovered within our galaxy so far, which travel at speeds of up to 700 km/s (435 mi/s) and are located at distances of about 100 to 50,000 light-years from the galactic center.
Artist’s conception of a hyperveloctiy star heading out from a spiral galaxy (similar to the Milky Way) and moving into dark matter nearby. Credit: Ben Bromley, University of Utah
These stars are thought to have been ejected from the center of our galaxy thanks to the interactions of binary stars with the supermassive black hole (SMBH) at the center of our galaxy – aka. Sagittarius A*. While their exact cause is still the subject of debate, the orbits of HVSs can be calculated since they are completely determined by the gravitational field of the galaxy.
As they explain in their study, the researchers used the asymmetry in the radial velocity distribution of stars in the galactic halo to determine the galaxy’s gravitational potential. The velocity of these halo stars is dependent on the potential escape speed of HVSs, provided that the time it takes for the HVSs to complete a single orbit is shorter than the lifetime of the halo stars.
From this, they were able to discriminate between different models for the Milky Way and the gravitational force it exerts. By adopting the nominal travel time of these observed HVSs – which they calculated to about 330 million years, about the same as the average lifetime of halo stars – they were able to derive gravitational estimates for the Milky Way which allowed for estimates on its overall mass.
“By calibrating the minimum speed of unbound stars, we find that the Milky Way mass is in the range of 1.2-1.9 trillions solar masses,” said Loeb. While still subject to a range, this latest estimate is a significant improvement over previous estimates. What’s more, these estimates are consistent our current cosmological models that attempt to account for all visible matter in the Universe, as well as dark matter and dark energy – the Lambda-CDM model.
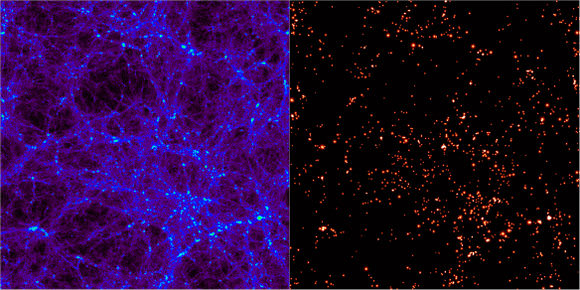
Distribution of dark matter when the Universe was about 3 billion years old, obtained from a numerical simulation of galaxy formation. Credit: VIRGO Consortium/Alexandre Amblard/ESA
“The inferred Milky Way mass is in the range expected within the standard cosmological model,” said Leob, “where the amount of dark matter is about five times larger than that of ordinary (luminous) matter.”
Based on this breakdown, it can be said that normal matter in our galaxy – i.e. stars, planets, dust and gas – accounts for between 240 and 380 billion Solar Masses. So not only does this latest study provide more precise mass constraints for our galaxy, it could also help us to determine exactly how many star systems are out there – current estimates say that the Milky Way has between 200 to 400 billion stars and 100 billion planets.
Beyond that, this study is also significant to the study of cosmic formation and evolution. By placing more precise estimates on our galaxy’s mass, ones which are consistent with the current breakdown of normal matter and dark matter, cosmologists will be able to construct more accurate accounts of how our Universe came to be. One step clsoer to understanding the Universe on the grandest of scales!
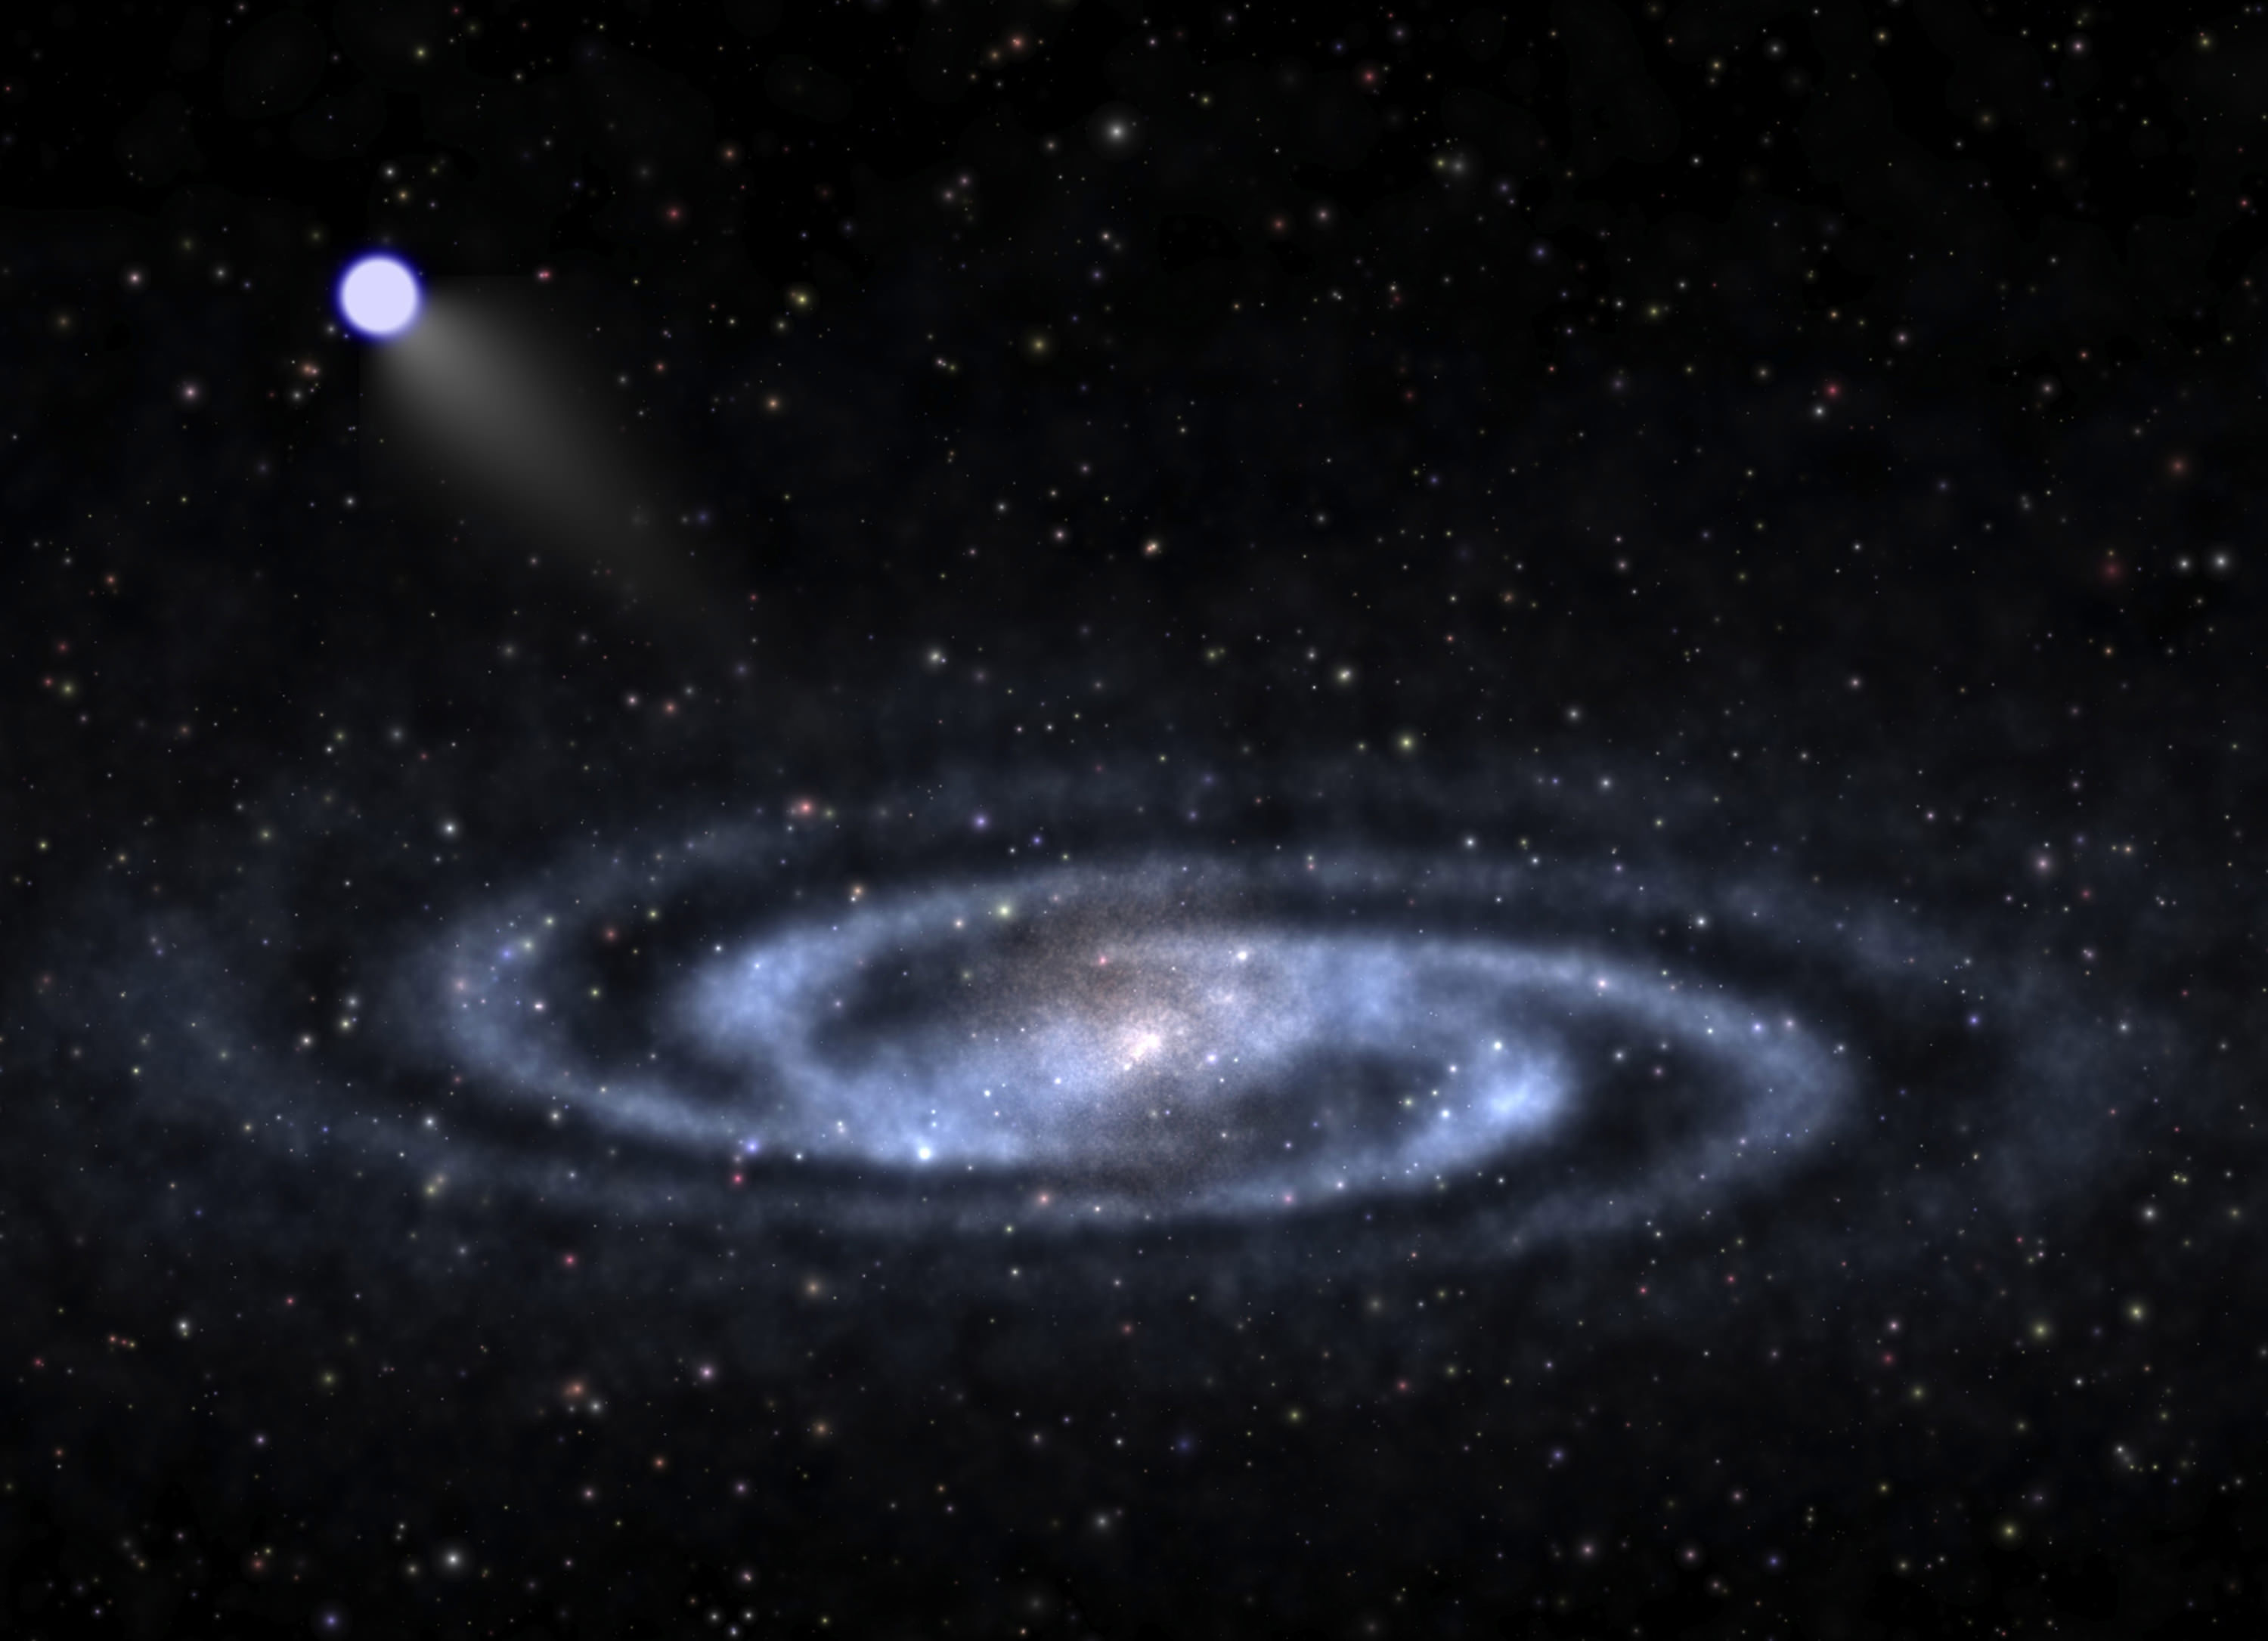
An artist's conception of a hypervelocity star that has escaped the Milky Way. Credit: NASA
Most stars in our galaxy behave predictably, orbiting around the center of the Milky Way at speeds of about 100 km/s (62 mi/s). But some stars achieve velocities that are significantly greater, to the point that they are even able to escape the gravitational pull of the galaxy. These are known as hypervelocity stars (HVS), a rare type of star that is believed to be the result of interactions with a supermassive black hole (SMBH).
The existence of HVS is something that astronomers first theorized in the late 1980s, and only 20 have been identified so far. But thanks to a new study by a team of Chinese astronomers, two new hypervelocity stars have been added to that list. These stars, which have been designated LAMOST-HVS2 and LAMOST-HVS3, travel at speeds of up to 1,000 km/s (620 mi/s) and are thought to have originated in the center of our galaxy.
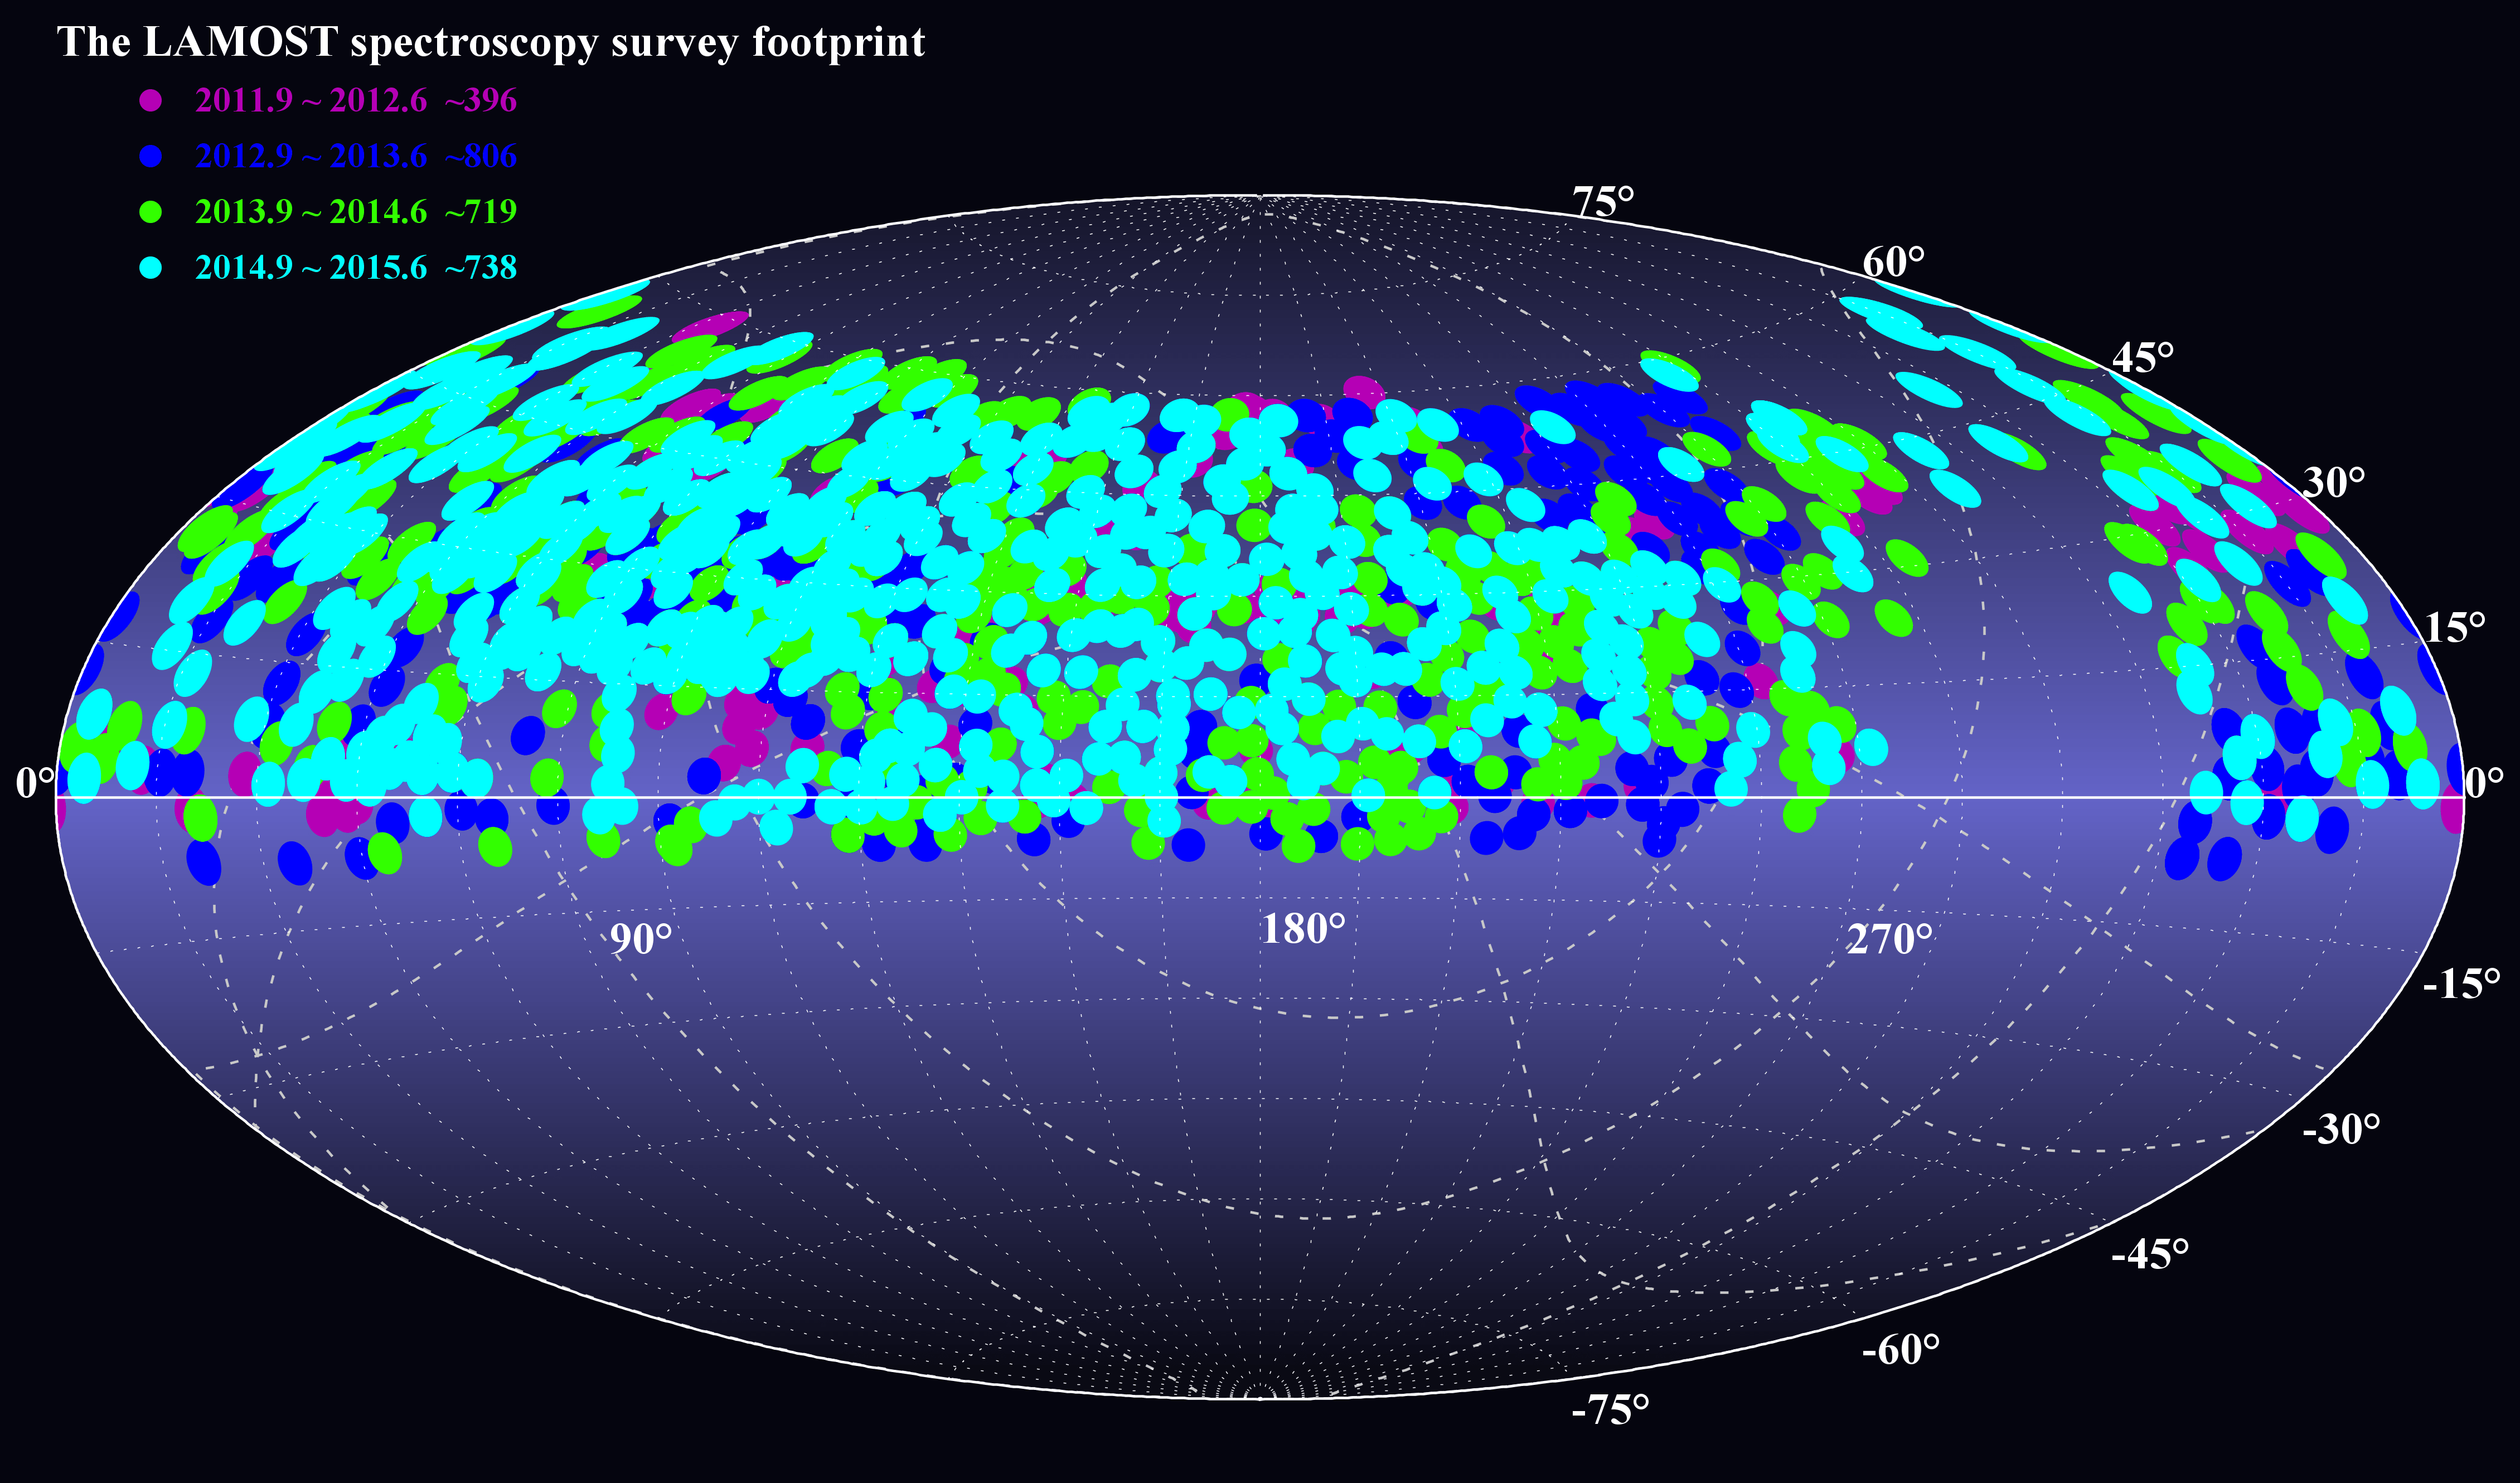
Footprint of the LAMOST pilot survey and the first three years’ general survey. Credit: LAMOST
Astronomers estimates that only 1000 HVS exist within the Milky Way. Given that there are as many as 200 billion stars in our galaxy, that’s just 0.0000005 % of the galactic population. While these stars are thought to originate in the center of our galaxy – supposedly as a result of interaction with our SMBH, Sagittarius A* – they manage to travel pretty far, sometimes even escaping our galaxy altogether.
It is for this very reason that astronomers are so interested in HVS. Given their speed, and the vast distances they can cover, tracking them and creating a database of their movements could provide constraints on the shape of the dark matter halo of our galaxy. Hence why Dr. Huang and his colleagues began sifting through LAMOST data to find evidence of new HVS.
Located in Hebei Province, northwestern China, the LAMOST observatory is operated by the Chinese Academy of Sciences. Over the course of five years, this observatory conducted a spectroscopic survey of 10 million stars in the Milky Way, as well as millions of galaxies. In June of 2017, LAMOST released its third Data Release (DR3), which included spectra obtained during the pilot survey and its first three years’ of regular surveys.
Containing high-quality spectra of 4.66 million stars and the stellar parameters of an additional 3.17 million, DR3 is currently the largest public spectral set and stellar parameter catalogue in the world. Already, LAMOST data had been used to identify one hypervelocity star, a B1IV/V-type (main sequence blue subgiant/subdwarf) star that was 11 Solar Masses, 13490 times as bright as our Sun, and had an effective temperature of 26,000 K (25,727 °C; 46,340 °F).
Artist’s impression of hypervelocity stars (HVSs) speeding through the Galaxy. Credit: ESA
This HVS was designated LAMOST-HSV1, in honor of the observatory. After detecting two new HVSs in the LAMOST data, these stars were designated as LAMOST-HSV2 and LAMOST-HSV3. Interestingly enough, these newly-discovered HVSs are also main sequence blue subdwarfs – or a B2V-type and B7V-type star, respectively.
Whereas HSV2 is 7.3 Solar Masses, is 2399 times as luminous as our Sun, and has an effective temperature of 20,600 K (20,327 °C; 36,620 °F), HSV3 is 3.9 Solar Masses, is 309 times as luminous as the Sun, and has an effective temperature of 14,000 K (24,740 °C; 44,564 °F). The researchers also considered the possible origins of all three HVSs based on their spatial positions and flight times.
In addition to considering that they originated in the center of the Milky Way, they also consider alternate possibilities. As they state in their study:
“The three HVSs are all spatially associated with known young stellar structures near the GC, which supports a GC origin for them. However, two of them, i.e. LAMOST-HVS1 and 2, have life times smaller than their flight times, indicating that they do not have enough time to travel from the GC to the current positions unless they are blue stragglers (as in the case of HVS HE 0437-5439). The third one (LAMOST-HVS3) has a life time larger than its flight time and thus does not have this problem.
In other words, the origins of these stars is still something of a mystery. Beyond the idea that they were sped up by interacting with the SMBH at the center of our galaxy, the team also considered other possibilities that have suggested over the years.
Artist’s impression of the ESA’s Gaia spacecraft, looking into the heart of the Milky Way Galaxy. Credit: ESA/ATG medialab/ESO/S. Brunier
As they state in these study, these “include the tidal debris of an accreted and disrupted dwarf galaxy (Abadi et al. 2009), the surviving companion stars of Type Ia supernova (SNe Ia) explosions (Wang & Han 2009), the result of dynamical interaction between multiple stars (e.g, Gvaramadze et al. 2009), and the runaways ejected from the Large Magellanic Cloud (LMC), assuming that the latter hosts a MBH (Boubert et al. 2016).”
In the future, Huang and his colleagues indicate that their study will benefit from additional information that will be provided by the ESA’s Gaia mission, which they claim will shed additional light on how HVS behave and where they come from. As they state in their conclusions:
“The upcoming accurate proper motion measurements by Gaia should provide a direct constraint on their origins. Finally, we expect more HVSs to be discovered by the ongoing LAMOST spectroscopic surveys and thus to provide further constraint on the nature and ejection mechanisms of HVSs.”
Accroding to new research, the Milky Way may still bear the marks of "ancient impacts". Credit: NASA/Serge Brunier
Understanding how the Universe came to be is one of the greater challenges of being an astrophysicist. Given the observable Universe’s sheer size (46.6 billion light years) and staggering age (13.8 billion years), this is no easy task. Nevertheless, ongoing observations, calculations and computer simulations have allowed astrophysicists to learn a great deal about how galaxies and larger structures have changed over time.
For example, a recent study by a team from the University of Kentucky (UK) has challenged previously-held notions about how our galaxy has evolved to become what we see today. Based on observations made of the Milky Way’s stellar disk, which was previously thought to be smooth, the team found evidence of asymmetric ripples. This indicates that in the past, our galaxy may have been shaped by ancient impacts.
This study evolved from Ferguson’s senior thesis, which was overseen by Prof. Gardner. At the time, Ferguson sought to expand on previous research by Gardner and Yanny, which also sought to understand the presence of ripples in our galaxy’s stellar disk. For the sake of this new study, the team relied on data obtained by the Sloan Digital Sky Survey‘s (SDSS) 2.5m Telescope, located at the Apache Point Observatory in New Mexico.
This allowed the team to examine the spatial distribution of 3.6 million stars in the Milky Way Galaxy, from which they confirmed the presence of asymmetric ripples. These, they claim, can be interpreted as evidence of the Milky Way’s ancient impacts – in other words, that these ripples resulted from our galaxy coming into contact with other galaxies in the past.
These could include a merger between the Milky Way and the Sagittarius dwarf galaxy roughly 0.85 billion years ago, as well as our galaxy’s current merger with the Canis Major dwarf galaxy. As Prof. Gardner explained in a recent UK press release:
“These impacts are thought to have been the ‘architects’ of the Milky Way’s central bar and spiral arms. Just as the ripples on the surface of a smooth lake suggest the passing of a distant speed boat, we search for departures from the symmetries we would expect in the distributions of the stars to find evidence of ancient impacts. We have found extensive evidence for the breaking of all these symmetries and thus build the case for the role of ancient impacts in forming the structure of our Milky Way.”
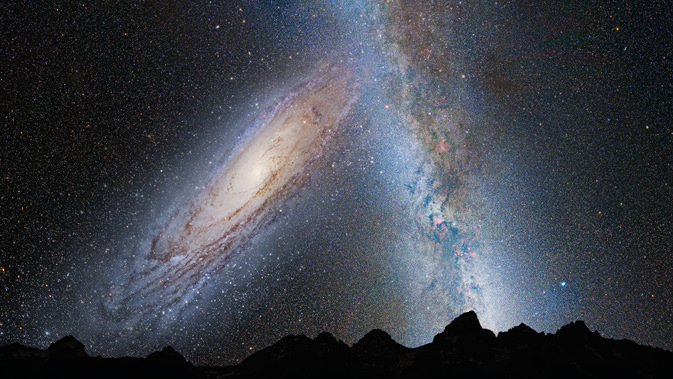
Illustration showing a stage in the predicted merger between our Milky Way galaxy and the neighboring Andromeda galaxy, as it will unfold over the next several billion years. Credit: NASA; ESA; Z. Levay and R. van der Marel, STScI; T. Hallas; and A. Mellinger
As noted, Gardner’s previous work also indicated that when it came to north/south symmetry of stars in the Milky Way’s disk, there was a vertical “ripple”. In other words, the number of stars that lay above or below the stellar disk would increase from one sampling to the next the farther they looked from the center of the galactic disk. But thanks to the most recent data obtained by the SDSS, the team had a much larger sample to base their conclusions on.
And ultimately, these findings confirmed the observations made by Ferguson and Lally, and also turned up evidence of an asymmetry in the plane of the galactic disk as well. As Ferguson explained:
“Having access to millions of stars from the SDSS allowed us to study galactic structure in an entirely new way by breaking the sky up into smaller regions without loss of statistics. It has been incredible watching this project evolve and the results emerge as we plotted the stellar densities and saw intriguing patterns across the footprint. As more studies are being done in this field, I am excited to see what we can learn about the structure of our galaxy and the forces that helped to shape it.”
Understanding how our galaxy evolved and what role ancient impact played is essential to understanding the history and evolution of the Universe as a whole. And in addition to helping us confirm (or update) our current cosmological models, studies like this one can also tell us much about what lies in store for our galaxy billions of years from now.
For decades, astronomers have been of the opinion that in roughly 4 billion years, the Milky Way will collide with Andromeda. This event is likely to have tremendous repercussions, leading to the merger of both galaxy’s supermassive black holes, stellar collisions, and stars being ejected. While it’s doubtful humanity will be around for this event, it would still be worthwhile to know how this process will shape our galaxy and the local Universe.
Image of the large-scale structure of the Universe, showing filaments and voids within the cosmic structure. Credit: Millennium Simulation Project
Ever since Galileo pointed his telescope at Jupiter and saw moons in orbit around that planet, we began to realize we don’t occupy a central, important place in the Universe. In 2013, a study showed that we may be further out in the boondocks than we imagined. Now, a new study confirms it: we live in a void in the filamental structure of the Universe, a void that is bigger than we thought.
In 2013, a study by University of Wisconsin–Madison astronomer Amy Barger and her student Ryan Keenan showed that our Milky Way galaxy is situated in a large void in the cosmic structure. The void contains far fewer galaxies, stars, and planets than we thought. Now, a new study from University of Wisconsin student Ben Hoscheit confirms it, and at the same time eases some of the tension between different measurements of the Hubble Constant.
The void has a name; it’s called the KBC void for Keenan, Barger and the University of Hawaii’s Lennox Cowie. With a radius of about 1 billion light years, the KBC void is seven times larger than the average void, and it is the largest void we know of.
The large-scale structure of the Universe consists of filaments and clusters of normal matter separated by voids, where there is very little matter. It’s been described as “Swiss cheese-like.” The filaments themselves are made up of galaxy clusters and super-clusters, which are themselves made up of stars, gas, dust and planets. Finding out that we live in a void is interesting on its own, but its the implications it has for Hubble’s Constant that are even more interesting.
Hubble’s Constant is the rate at which objects move away from each other due to the expansion of the Universe. Dr. Brian Cox explains it in this short video.
The problem with Hubble’s Constant, is that you get a different result depending on how you measure it. Obviously, this is a problem. “No matter what technique you use, you should get the same value for the expansion rate of the universe today,” explains Ben Hoscheit, the Wisconsin student who presented his analysis of the KBC void on June 6th at a meeting of the American Astronomical Society. “Fortunately, living in a void helps resolve this tension.”
There are a couple ways of measuring the expansion rate of the Universe, known as Hubble’s Constant. One way is to use what are known as “standard candles.” Supernovae are used as standard candles because their luminosity is so well-understood. By measuring their luminosity, we can determine how far away the galaxy they reside in is.
Another way is by measuring the CMB, the Cosmic Microwave Background. The CMB is the left over energy imprint from the Big Bang, and studying it tells us the state of expansion in the Universe.
This is a map of the observable Universe from the Sloan Digital Sky Survey. Orange areas show higher density of galaxy clusters and filaments. Image: Sloan Digital Sky Survey.
The two methods can be compared. The standard candle approach measures more local distances, while the CMB approach measures large-scale distances. So how does living in a void help resolve the two?
Measurements from inside a void will be affected by the much larger amount of matter outside the void. The gravitational pull of all that matter will affect the measurements taken with the standard candle method. But that same matter, and its gravitational pull, will have no effect on the CMB method of measurement.
“One always wants to find consistency, or else there is a problem somewhere that needs to be resolved.” – Amy Barger, University of Hawaii, Dept. of Physics and Astronomy
Hoscheit’s new analysis, according to Barger, the author of the 2013 study, shows that Keenan’s first estimations of the KBC void, which is shaped like a sphere with a shell of increasing thickness made up of galaxies, stars and other matter, are not ruled out by other observational constraints.
“It is often really hard to find consistent solutions between many different observations,” says Barger, an observational cosmologist who also holds an affiliate graduate appointment at the University of Hawaii’s Department of Physics and Astronomy. “What Ben has shown is that the density profile that Keenan measured is consistent with cosmological observables. One always wants to find consistency, or else there is a problem somewhere that needs to be resolved.”
Artist’s conception of the Gaia telescope backdropped by a photograph of the Milky Way taken at the European Southern Observatory. Credit: ESA/ATG medialab; background: ESO/S. Brunier
In 2013, the European Space Agency deployed the long-awaited Gaia space observatory. As one of a handful of next-generation space observatories that will be going up before the end of the decade, this mission has spent the past few years cataloging over a billion astronomical objects. Using this data, astronomers and astrophysicists hope to create the largest and most precise 3D map of the Milky Way to date.
Though it is almost to the end of its mission, much of its earliest information is still bearing fruit. For example, using the mission’s initial data release, a team of astrophysicists from the University of Toronto managed to calculate the speed at which the Sun orbits the Milky Way. From this, they were able to obtain a precise distance estimate between our Sun and the center of the galaxy for the first time.
For some time, astronomers have been unsure as to exactly how far our Solar System is from the center of our galaxy. Much of this has to do with the fact that it is impossible to view it directly, due to a combination of factors (i.e. perspective, the size of our galaxy, and visibility barriers). As a result, since the year 2000, official estimates have varied between 7.2 and 8.8 kiloparsecs (~23,483 to 28,700 light years).
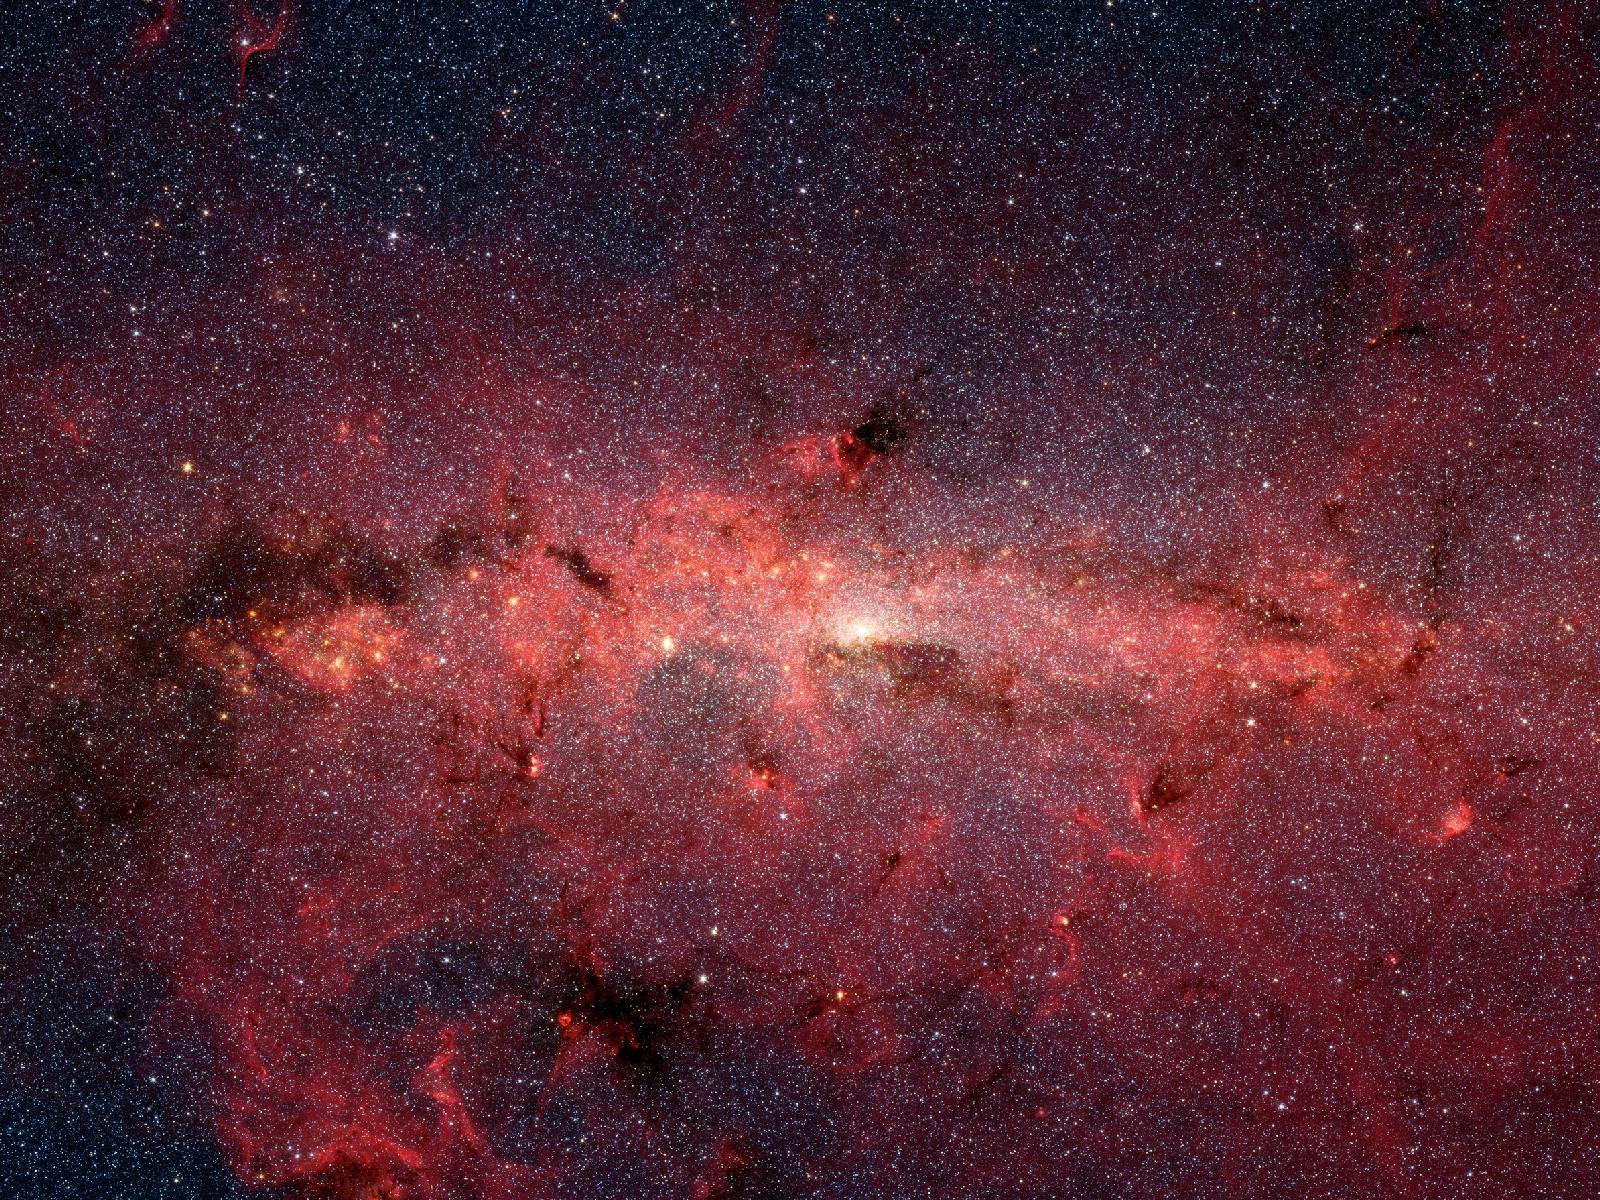
Infrared image from Spitzer Space Telescope, showing the stars at the center of the Milky Way Galaxy. Credit: NASA/JPL-Caltech/S. Stolovy (SSC/Caltech)
For the sake of their study, the team – which was led by Jason Hunt, a Dunlap Fellow at the Dunlap Institute for Astronomy & Astrophysics at the University of Toronto – combined Gaia’s initial release with data from the RAdial Velocity Experiment (RAVE). This survey, which was conducted between 2003 and 2013 by the Australian Astronomical Observatory (AAO), measured the positions, distances, radial velocities and spectra of 500,000 stars.
Over 200,000 of these stars were also observed by Gaia and information on them was included in its initial data release. As they explain in their study, which was published in the Journal of Astrophysical Letters in November 2016, they used this to examined the speeds at which these stars orbit the center of the galaxy (relative to the Sun), and in the process discovered that there was an apparent distribution in their relative velocities.
In short, our Sun moves around the center of the Milky Way at a speed of 240 km/s (149 mi/s), or 864,000 km/h (536,865 mph). Naturally, some of the more than 200,000 candidates were moving faster or slower. But for some, there was no apparent angular momentum, which they attributed to these stars being scattering onto “chaotic, halo-type orbits when they pass through the Galactic nucleus”.
As Hunt explained in Dunlap Institute press release:
“Stars with very close to zero angular momentum would have plunged towards the Galactic center where they would be strongly affected by the extreme gravitational forces present there. This would scatter them into chaotic orbits taking them far above the Galactic plane and away from the Solar neighbourhood… By measuring the velocity with which nearby stars rotate around our Galaxy with respect to the Sun, we can observe a lack of stars with a specific negative relative velocity. And because we know this dip corresponds to 0 km/sec, it tells us, in turn, how fast we are moving.”
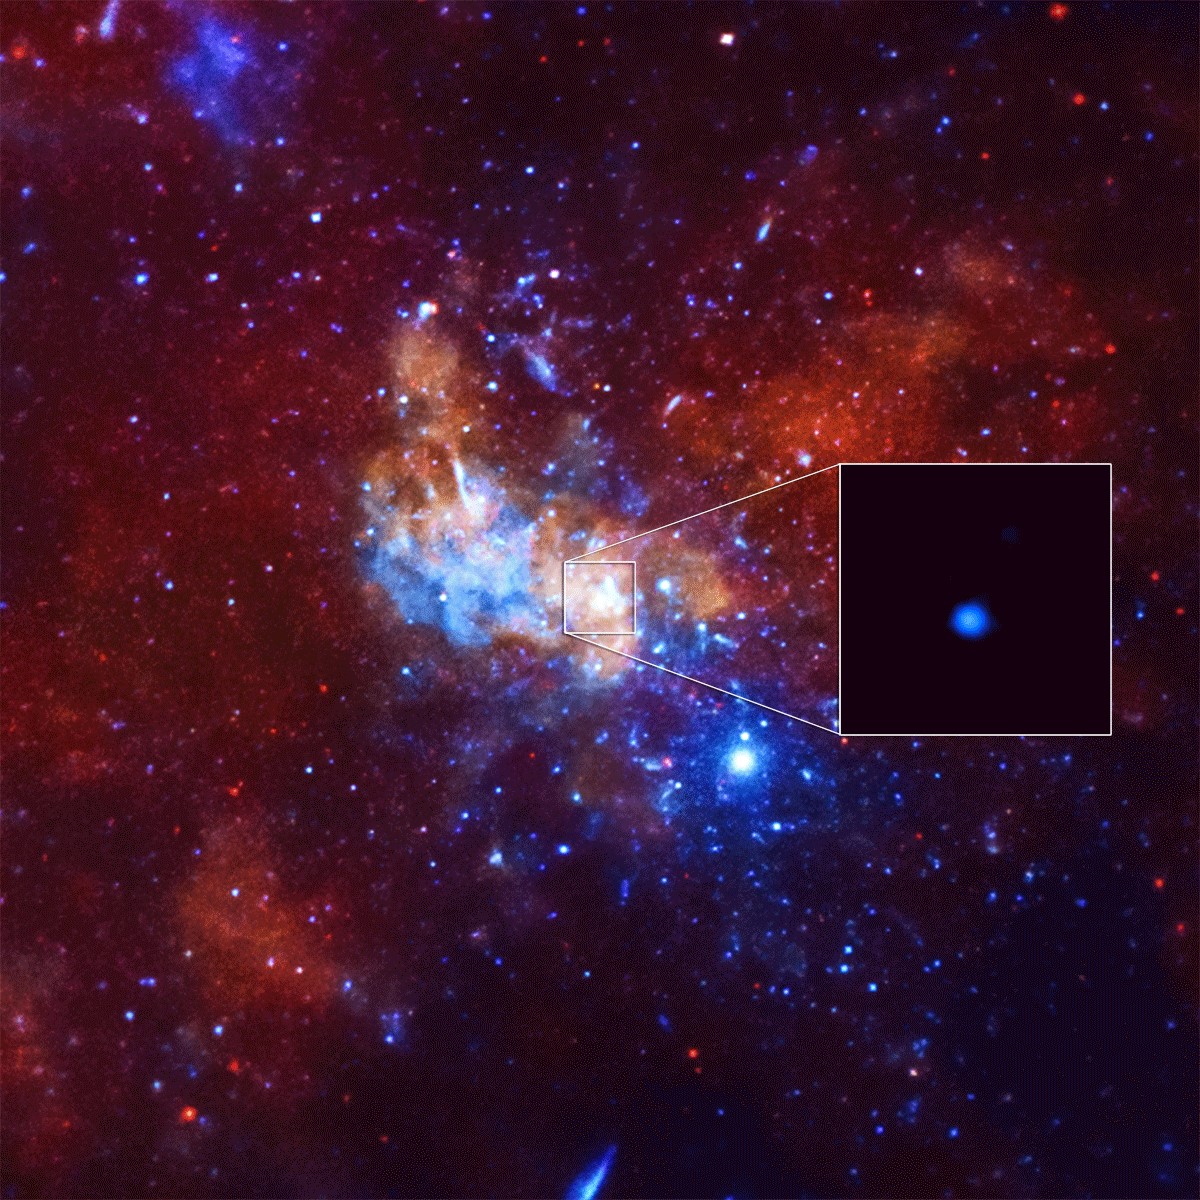
Detection of an unusually bright X-Ray flare from Sagittarius A*, a supermassive black hole in the center of the Milky Way galaxy. Credit: NASA/CXC/Stanford/I. Zhuravleva et al.
The next step was to combine this information with proper motion calculations of Sagittarius A* – the supermassive black hole believed to be at the center of our galaxy. After correcting for its motion relative to background objects, they were able to effectively triangulate the Earth’s distance from the center of the galaxy. From this, they derived a refined distance of estimate of 7.6 to 8.2 kpc – which works out to about 24,788 to 26,745 light years.
This study builds upon previous work conducted by the study’s co-authors – Prof. Ray Calberg, the current chair of the Department of Astronomy & Astrophysics at the University of Toronto. Years ago, he and Prof. Kimmo Innanen of the Department of Physics and Astronomy at York University conducted a similar study using radial velocity measurement from 400 of the Milky Way’s stars.
But by incorporating data from the Gaia observatory, the UofT team was able to obtain a much more comprehensive data set and narrow the distance to galactic center by a significant amount. And this was based on only the initial data released by the Gaia mission. Looking ahead, Hunt anticipates that further data releases will allow his team and other astronomers to refine their calculations even more.
“Gaia’s final release in late 2017 should enable us to increase the precision of our measurement of the Sun’s velocity to within approximately one km/sec,” he said, “which in turn will significantly increase the accuracy of our measurement of our distance from the Galactic center.”
As more next-generation space telescopes and observatories are deployed, we can expect them to provide us with a wealth of new information about our Universe. And from this, we can expect that astronomers and astrophysicists will begin to shine the light on a number of unresolved cosmological questions.
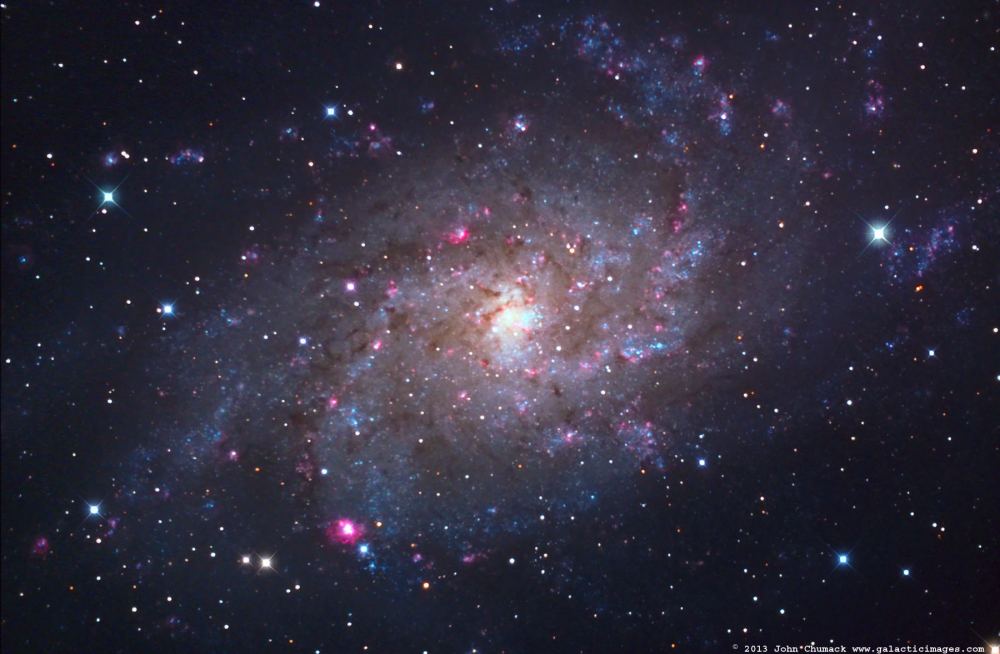
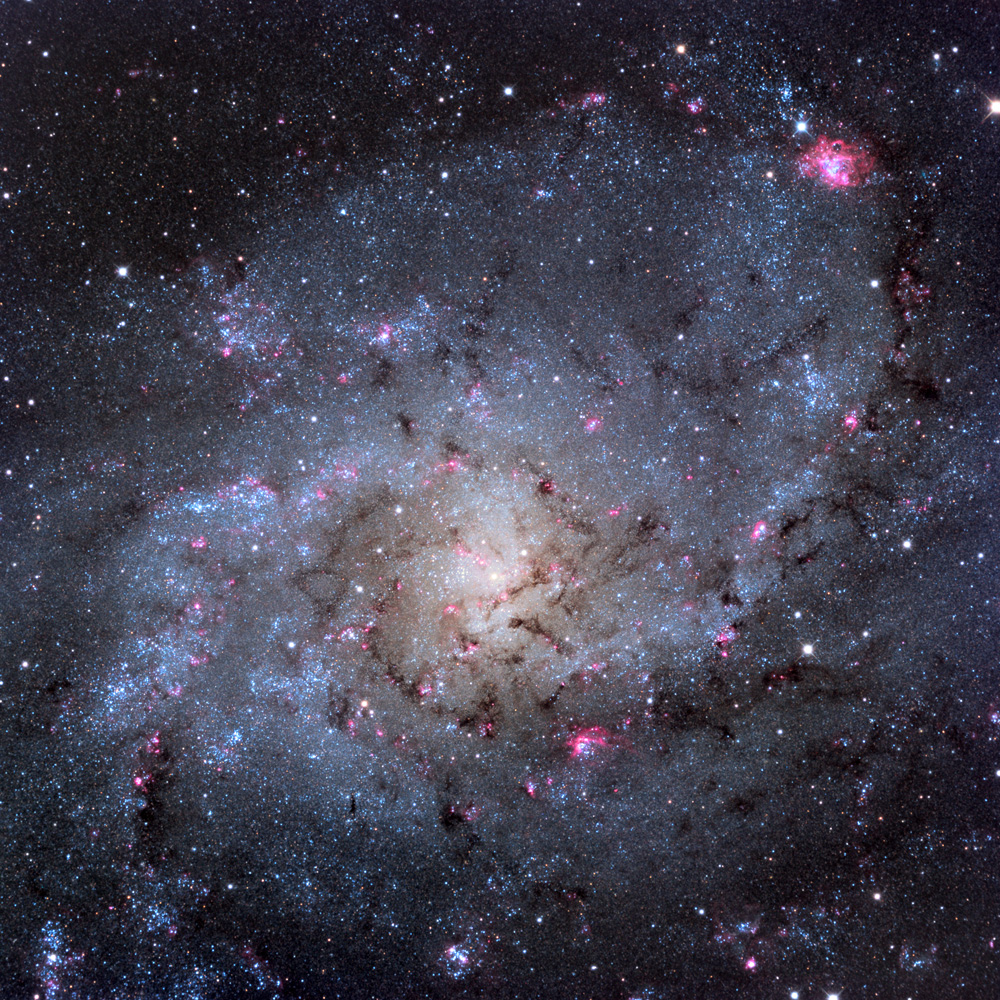
M33, the Triangulum Spiral Galaxy, seen here in a 4.3 hour exposure image. Astronomers used JWST to examine a section of its south spiral arm to search out and find nearly 800 newly forming stars. Credit and copyright: John Chumack.
Welcome back to Messier Monday! In our ongoing tribute to the great Tammy Plotner, we take a look at the Triangulum Galaxy, also known as Messier 33. Enjoy!
During the 18th century, famed French astronomer Charles Messier noted the presence of several “nebulous objects” in the night sky. Having originally mistaken them for comets, he began compiling a list of them so that others would not make the same mistake he did. In time, this list (known as the Messier Catalog) would come to include 100 of the most fabulous objects in the night sky.
One of these is the Triangulum Galaxy, a spiral galaxy located approximately 3 million light-years from Earth in the direction of the Triangulum constellation. As the third-largest member of the Local Group of galaxies (behind the Andromeda Galaxy and the Milky Way), it is the one of the most distant objects that can be seen with the naked eye. Much like M32, M33 is very close to Andromeda, and is believed to be a satellite of this major galaxy.
Description:
At some 3 million light years away from Earth, the Triangulum Galaxy is the third largest galaxy in our Local Group and it may be a gravitationally bound companion of the Andromeda Galaxy. Its beautiful spiral arms show multitudes of red HII regions and blue clouds of young stars. The largest of these HII regions (NGC 604) spans nearly 1500 across and is the largest so far known.
The Triangulum Galaxy (M33), taken by the Swift Gamma-Ray Burst Mission. Credit: NASA/Swift
It has a spectrum similar to the Orion Nebula – our own Milky Way’s most celebrated starbirth region. “M33 is a gigantic laboratory where you can watch dust being created in novae and supernovae, being distributed in the winds of giant stars, and being reborn in new stars,” said University of Minnesota researcher and lead author Elisha Polomski. By studying M33, “you can see the Universe in a nutshell.”
Of course, our curiousity about our neighboring galaxy has driven us to try to understand more over the years. Once Edwin Hubble set the standard with Cepheid variables, we began measuring distance by discovering about 25 of them in M33. By 2004 we were studying the red giant star branch to peer even further. As A.W. McConnachie said in a 2004 study of the galaxy:
“The absolute bolometric luminosity of the point of core helium ignition in old, metal-poor, red giant stars is of roughly constant magnitude, varying only very slightly with mass or metallicity. It can thus be used as a standard candle. This technique then allows for the determination of realistic uncertainties which reflect the quality of the luminosity function used. Finally, we apply our technique to the Local Group spiral galaxy M33 and the dwarf galaxies Andromeda I and II, and derive distance. The result for M33 is in excellent agreement with the Cepheid distances to this galaxy, and makes the possibility of a significant amount of reddening in this object unlikely.”
By 2005, astronomers had detected two water masers on either side of M33 and for the first time ever – revealed what direction it as going in. According to Andreas Brunthaler (et al), who published a study about the distance and proper motion of the galaxy in 2005:
“We measured the angular rotation and proper motion of the Triangulum Galaxy (M33) with the Very Long Baseline Array by observing two H2O masers on opposite sides of the galaxy. By comparing the angular rotation rate with the inclination and rotation speed, we obtained a distance of 730 +/- 168 kiloparsecs. This distance is consistent with the most recent Cepheid distance measurement. This distance is consistent with the most recent Cepheid distance measurement. M33 is moving with a velocity of 190 +/- 59 kilometers per second relative to the Milky Way. These measurements promise a method to determine dynamical models for the Local Group and the mass and dark-matter halos of M31, M33, and the Milky Way.”
Composite image of the Triangulum Galaxy (Messier 33), taken at Mount Lemmon Observatory. Credit: Adam Block/Mount Lemmon SkyCenter/University of Arizona
Yes, it’s moving toward the Andromeda Galaxy, much like how Andromeda is moving towards us! In 2006, a group of astronomers announced the discovery of an eclipsing binary star in M33. As A.Z. Bonanos, the lead author of the study that detailed the discovery, said:
“We present the first direct distance determination to a detached eclipsing binary in M33, which was found by the DIRECT Project. Located in the OB 66 association, it was one of the most suitable detached eclipsing binaries found by DIRECT for distance determination, given its 4.8938 day period.”
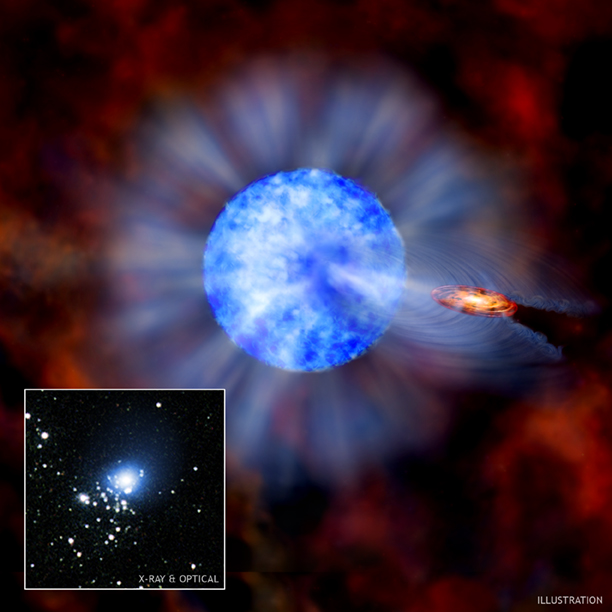
By studying the eclipsing binary, astronomers soon knew their size, distance, temperature and absolute magnitude. But more was yet to come! In 2007, the Chandra X-ray Observatory revealed even more when a black hole nearly 16 times the mass of the Sun was revealed. The black hole, named M33 X-7, orbits a companion star which it eclipses every 3.5 days. This means the companion star must also have an incredibly large mass as well….
Yet how huge must the parent star have been to have formed a black hole in advance of its companion? As Jerome Orosz, of San Diego State University, was quoted as saying in a 2007 Chandra press release:
“This discovery raises all sorts of questions about how such a big black hole could have been formed. Massive stars can be much less extravagant than people think by hanging onto a lot more of their mass toward the end of their lives. This can have a big effect on the black holes that these stellar time-bombs make.”
Artist’s rendering of the black hole found in orbit of the large blue star in M33 . Credit: Chandra/Harvard/HST
Stellar bombs? You bet. Gigantic stellar explosions even. Although no supernovae events have been detected in the Triangulum galaxy, it certainly doesn’t lack for evidence of supernova remnants. According to a 2004 study by F. Haberl and W. Pietsch of the Max-Planck-Institute:
“We present a catalogue of 184 X-ray sources within 50′ of the nucleus of the local group spiral galaxy M 33. The catalogue is derived from an analysis of the complete set of ROSAT archival data pointed in the direction of M 33 and contains X-ray position, existence likelihood, count rates and PSPC spectral hardness ratios. To identify the sources the catalog was correlated with previous X-ray catalogues, optical and radio catalogues. In addition sources were classified according to their X-ray properties. We find seven candidates for supersoft X-ray sources, of which two may be associated with known planetary nebulae in M 33. The majority of X-ray detected supernova remnants is also detected at radio frequencies and seen in optical lines. The low overall X-ray detection rate of optically selected SNRs can probably be attributed to their expansion into interstellar matter of low density.”
Or the creation of black holes…
History of Observation:
While the Triangulum Galaxy was probably first observed by Hodierna before 1654 (back when skies were dark), it was independently rediscovered by Charles Messier, and cataloged by him on August 25, 1764. As he recorded in his notes on the occasion:
“I have discovered a nebula between the head of the northern Fish and the large Triangle, a bit distant from a star which had not been known, of sixth magnitude, of which I have determined the position; the right ascension of that star was 22d 7′ 13″, and its declination 29d 54′ 10″ north: near that star, there is another one which is the first of Triangulum, described by the letter b. Flamsteed described it in his catalog, of sixth magnitude; it is less beautiful than that of which I have given the position, and one should set it to the rank of the stars of the eighth class. The nebula is a whitish light of 15 minutes in diameter, of an almost even density, despite a bit more luminous at two third of its diameter; it doesn’t contain any star: one sees it with difficulty with an ordinary refractor of one foot.”
The location of the Triangulum Galaxy in the night sky. Credit: Wikisky
While Sir William Herschel wouldn’t publish papers on Messier’s findings, he was an astronomically curious soul and couldn’t help but study M33 intently on his own, writing:
“There is a suspicion that the nebula consists of exceedingly small stars. With this low power it has a nebulous appearance; and it vanishes when I put on the higher magnifying powers of 278 and 460.” He would continue to observe this grand galaxy again and again over the years, cataloging its various regions with their own separate numbers and keeping track of his findings: “The stars of the cluster are the smallest points imaginable. The diameter is nearly 18 minutes.”
Yet it would take a very special observer, one named Bill Parsons – the third Earl of Rosse – to become the very first to describe it as spiral. As he wrote of it:
“September 16, 1849. – New spiral: Alpha the brighter branch; Gamma faint; Delta short but pretty bright; Beta pretty distinct; Epsilon but suspected; the whole involved in a faint nebula, which probably extends past several knots which lie about it in different directions. Faint nebula seems to extend very far following: drawing taken.”
Quite the description indeed, since it would eventually lead to Rosse’s description of M33 being “…full of knots. Spiral arrangement. Two similar curves like an “S” cross in the center”, and to other astronomers discovering that these “spiral nebulae” were extra-galactic!
The location of Messier 33 in the Triangulum constellation. Credit: IAU and Sky & Telescope magazine (Roger Sinnott & Rick Fienberg)
Locating Messier 33:
While actually locating Messier 33 isn’t so difficult, seeing Messier 33 can be. Even though it is billed at nearly unaided eye magnitude, this huge, low surface brightness galaxy requires some experience with equipment and observing conditions or you may hunt forever in the right place and never find it. Let’s begin first by getting you in the proper area! First locate the Great Square of Pegasus – and its easternmost bright star, Alpha. About a hand span further east you will see the brightest star in Triangulum – Alpha.
M33 is just a couple of degrees (about 2 finger widths) west. Now, the most important part to understand is that you must use the lowest magnification possible, or you won’t be able to see the proverbial forest because of the trees. The image you see here at the top of the page is around a full degree of sky – about 1/3 the field of view of average binoculars and far larger than your average telescope eyepiece.
However, by using the least amount of magnification with a telescope you are causing M33 to appear much smaller – allowing it to fit within eyepiece field of view range. The larger the aperture, the more light it gathers and the brighter the image will be. The next thing to understand is M33 really is low surface brightness… Light pollution, a fine haze in the sky, moonlight… All of these things will make it difficult to find. Yet, there are places left here on Earth where the Triangulum Galaxy can be seen with no optical aid at all!
Enjoy your quest for M33. You may find it your first time out and it may be years before you see it in all its glory. But when you do, we guarantee you’ll never forget! Be sure to enjoy this video of the Triangulum galaxy too, courtesy of the European Southern Observatory:
Enjoy your quest for M33. You may find it your first time out and it may be years before you see it in all its glory. But when you do, we guarantee you’ll never forget!
And here are the quick facts on M33 to help you get started:
Object Name: Messier 33 Alternative Designations: M33, NGC 598, Triangulum Galaxy, Pinwheel Galaxy Object Type: Type Sc, Spiral Galaxy Constellation: Triangulum Right Ascension: 01 : 33.9 (h:m) Declination: +30 : 39 (deg:m) Distance: 3000 (kly) Visual Brightness: 5.7 (mag) Apparent Dimension: 73×45 (arc min)