Jupiter has an extremely powerful magnetic field. Ganymede has one, too, and is the only moon with one. Jupiter's envelops Ganymede's and their interactions are just part of the pair's complicated relationship. Image Credit: NASA Goddard Space Flight Center.
Jupiter is a huge planet, but its magnetosphere is mind-blowingly massive. It extends out to nearly 5 million kilometers (3 million miles) wide on average, 150 times wider than Jupiter itself and almost 15 times wider than the Sun, making it one of the largest structures in the Solar System.
“If you were to look up into the night sky and if we could see the outline of Jupiter’s magnetosphere, it would be about the size of the Moon in our sky,” said Jack Connerney, deputy principal investigator and head of the Juno mission magnetometer team. “It’s a very large feature in our Solar System, and it’s a pity we can’t see it.”
But the Juno spacecraft is about to change our understanding of Jupiter’s magnetosphere and allow scientists to “see” for the first time Jupiter’s magnetic field.
A magnetosphere is the area of space around a planet that is controlled by the planet’s magnetic field. The stronger the magnetic field, the larger the magnetosphere. It is estimated that Jupiter’s magnetic field is about 20,000 times stronger than Earth’s.
Jupiter has spectacular aurora, such as this view captured by the Hubble Space Telescope. Auroras are formed when charged particles in the space surrounding the planet are accelerated to high energies along the planet’s magnetic field. Credit: NASA, ESA, and J. Nichols (University of Leicester)
Magnetic fields are produced by what are known as dynamos – an electric current created from the convection motion of a planet’s interior. Earth’s magnetic field is generated by its circulating core of molten iron and nickel. But what creates Jupiter’s dynamo? Is it like Earth’s or could it be very different? Jupiter consists predominantly of hydrogen and helium, and it is currently unknown if there is a rocky core at the center of the planet.
“With Jupiter, we don’t know what material is producing the planet’s magnetic field,” said Jared Espley, Juno program scientist for NASA Headquarters, “What material is present and how deep down it lies is one of the questions Juno is designed to answer.”
Juno has a pair of magnetometers to basically look inside the planet. The magnetometers will allow scientists to map Jupiter’s magnetic field with high accuracy and observe variations in the field over time. The instruments will be able to show how the magnetic field is generated by dynamo action deep in the planet’s interior, providing the first look at what the magnetic field looks like from the surface of the dynamo where it is generated.
“The best way to think of a magnetometer is like a compass,” said Connerney. “Compasses record the direction of a magnetic field. But magnetometers expand on that capability and record both the direction and magnitude of the magnetic field.”
But Jupiter presents a lot of problems as far as being nice to instruments. Trapped within the magnetosphere are charged particles from the Sun that form intense radiation belts around the planet. These belts are similar to the Earth’s Van Allen belts, but are many millions of times stronger.
To help protect the spacecraft and instrument electronics, Juno has a radiation vault about the size of a car trunk made of titanium that limits the radiation exposure to Juno’s command and data handling box (the spacecraft’s brain), power and data distribution unit (its heart) and about 20 other electronic assemblies. But the instruments themselves need to be outside of the vault in order to make their observations. Workers place the special radiation vault for NASA’s Juno spacecraft onto the propulsion module. Image credit: NASA/JPL-Caltech/LMSS
The magnetometer sensors are on a boom attached to one of the solar arrays, placing them about 40 feet (12 meters) from the body of the spacecraft. This helps ensure that the rest of the spacecraft does not interfere with the magnetometer.
But there are other ways to help limit the amount of radiation exposure, at least in the first part of the mission.
Scientists designed a path that takes Juno around Jupiter’s poles so that the spacecraft spends the least amount of time possible in those blistering radiation belts around Jupiter’s equator. Engineers also used designs for electronics already approved for the Martian radiation environment, which is harsher than Earth’s, though not as harsh as Jupiter’s.
That elliptical orbit — between radiation belt and the planet — also puts the spacecraft very close to Jupiter, about 5,000 km above the cloud tops, enabling a close-up look at this amazing planet.
“This is our first opportunity to do very precise, high-accuracy mapping of the magnetic field of another planet,” Connerney said. “We are going to be able to explore the entire three-dimensional space around Jupiter, wrapping Jupiter in a dense net of magnetic field observations completely covering the sphere.”
By studying Jupiter’s magnetosphere, scientists will gain a better understanding about how Jupiter’s magnetic field is generated. They also hope to measure how fast Jupiter is spinning, determine whether the planet has a solid core, and learn more about Jupiter’s formation.
“It’s always incredible to be the first person in the world to see anything,” Connerney said, “and we stand to be the first to look down upon the dynamo and see it clearly for the first time.”
The magnetic field and electric currents in and around Earth generate complex forces that have immeasurable impact on every day life. The field can be thought of as a huge bubble, protecting us from cosmic radiation and charged particles that bombard Earth in solar winds. It's shaped by winds of particles blowing from the sun called the solar wind, the reason it's flattened on the "sun-side" and swept out into a long tail on the opposite side of the Earth. Credit: ESA/ATG medialab
Illustration of the invisible magnetic field lines generated by the Earth. Unlike a classic bar magnet, the matter governing Earth’s magnetic field moves around. The flow of liquid iron in Earth’s core creates electric currents, which in turn creates the magnetic field. Credit and copyright: Peter Reid, University of Edinburgh
Although invisible to the eye, Earth’s magnetic field plays a huge role in both keeping us safe from the ever-present solar and cosmic winds while making possible the opportunity to witness incredible displays of the northern lights. Like a giant bar magnet, if you could sprinkle iron filings around the entire Earth, the particles would align to reveal the nested arcs of our magnetic domain. The same field makes your compass needle align north to south.
We can picture our magnetic domain as a huge bubble, protecting us from cosmic radiation and electrically charged atomic particles that bombard Earth in solar winds. Satellites and instruments on the ground keep a constant watch over this bubble of magnetic energy surrounding our planet. For good reason: it’s always changing.
Earth’s magnetic field is thought to be generated by an ocean of super-heated, swirling liquid iron that makes up its the outer core 1,860 miles (3000 kilometers) under our feet. Acting like the spinning conductor similar to a bicycle dynamo that powers a headlight, it generates electrical currents and a constantly changing electromagnetic field. Other sources of magnetism come from minerals in Earth’s mantle and crust, while the ionosphere, magnetosphere and oceans also play a role. The three Swarm satellites precisely identify and measure precisely these different magnetic signals. Copyright: ESA/ATG Medialab
The European Space Agency’s Swarm satellite trio, launched at the end of 2013, has been busy measuring and untangling the different magnetic signals from Earth’s core, mantle, crust, oceans, ionosphere (upper atmosphere where the aurora occurs) and magnetosphere, the name given to the region of space dominated by Earth’s magnetic field.
At this week’s Living Planet Symposiumin Prague, Czech Republic, new results from the constellation of Swarm satellites show where our protective field is weakening and strengthening, and how fast these changes are taking place.
Based on results from ESA’s Swarm mission, the animation shows how the strength of Earth’s magnetic field has changed between 1999 and mid-2016. Blue depicts where the field is weak and red shows regions where the field is strong. The field has weakened by about 3.5% at high latitudes over North America, while it has grown about 2% stronger over Asia. Watch also the migration of the north geomagnetic pole (white dot).
Between 1999 and May 2016 the changes are obvious. In the image above, blue depicts where the field is weak and red shows regions where it is strong. As well as recent data from the Swarm constellation, information from the CHAMPand Ørsted satellites were also used to create the map.
The animation shows changes in the rate at which Earth’s magnetic field strengthened and weakened between 2000 and 2015. Regions where changes in the field have slowed are shown in blue while red shows where changes sped up. For example, in 2015 changes in the field have slowed near South Africa but changes got faster over Asia. This map has been compiled using data from ESA’s Swarm mission.
The animation show that overall the field has weakened by about 3.5% at high latitudes over North America, while it has strengthened about 2% over Asia. The region where the field is at its weakest – the South Atlantic Anomaly – has moved steadily westward and weakened further by about 2%. Moreover, the magnetic north pole is also on the move east, towards Asia. Unlike the north and south geographic poles, the magnetic poles wander in an erratic way, obeying the movement of sloshing liquid iron and nickel in Earth’s outer core. More on that in a minute.
The ‘South Atlantic Anomaly’ refers to an area where Earth’s protective magnetic shield is weak. The white spots on this map indicate where electronic equipment on a TOPEX/Poseidon satellite was affected by radiation as it orbited above. The colors indicate the strength of the planet’s magnetic field with red the highest value and blue the lowest. Credit: ESA/DTU Space
The anomaly is a region over above South America, about 125-186 miles (200 – 300 kilometers) off the coast of Brazil, and extending over much of South America, where the inner Van Allen radiation belt dips just 125-500 miles (200 – 800 kilometers) above the Earth’s surface. Satellites passing through the anomaly experience extra-strong doses of radiation from fast-moving, charged particles.
This cutaway of planet Earth shows the familiar exterior of air, water and land as well as the interior: from the mantle down to the outer and inner cores. Currents in hot, liquid iron-nickel in the outer core create our planet’s protective but fluctuating magnetic field. Credit: Kelvinsong / Wikipedia
The magnetic field is thought to be produced largely by an ocean of molten, swirling liquid iron that makes up our planet’s outer core, 1,860 miles (3000 kilometers) under our feet. As the fluid churns inside the rotating Earth, it acts like a bicycle dynamo or steam turbine. Flowing material within the outer core generates electrical currents and a continuously changing electromagnetic field. It’s thought that changes in our planet’s magnetic field are related to the speed and direction of the flow of liquid iron and nickel in the outer core.
Chris Finlay, senior scientist at DTU Space in Denmark, said, “Swarm data are now enabling us to map detailed changes in Earth’s magnetic field. Unexpectedly, we are finding rapid localized field changes that seem to be a result of accelerations of liquid metal flowing within the core.”
The magnetic field and electric currents in and around Earth generate complex forces that have immeasurable impact on every day life. The field can be thought of as a huge bubble, protecting us from cosmic radiation and charged particles that bombard Earth in solar winds. It’s shaped by winds of particles blowing from the sun called the solar wind, the reason it’s flattened on the “sun-side” and swept out into a long tail on the opposite side of the Earth. Credit: ESA/ATG medialab
Further results are expected to yield a better understanding as why the field is weakening in some places, and globally. We know that over millions of years, magnetic poles can actually flip with north becoming south and south north. It’s possible that the current speed up in the weakening of the global field might mean it’s ready to flip.
Although there’s no evidence previous flips affected life in a negative way, one thing’s for sure. If you wake up one morning and find your compass needle points south instead of north, it’s happened.
Surface features of the four members at different levels of zoom in each row
Continuing with our “Definitive Guide to Terraforming“, Universe Today is happy to present to our guide to terraforming Jupiter’s Moons. Much like terraforming the inner Solar System, it might be feasible someday. But should we?
Fans of Arthur C. Clarke may recall how in his novel, 2010: Odyssey Two (or the movie adaptation called 2010: The Year We Make Contact), an alien species turned Jupiter into a new star. In so doing, Jupiter’s moon Europa was permanently terraformed, as its icy surface melted, an atmosphere formed, and all the life living in the moon’s oceans began to emerge and thrive on the surface.
As we explained in a previous video (“Could Jupiter Become a Star“) turning Jupiter into a star is not exactly doable (not yet, anyway). However, there are several proposals on how we could go about transforming some of Jupiter’s moons in order to make them habitable by human beings. In short, it is possible that humans could terraform one of more of the Jovians to make it suitable for full-scale human settlement someday.
Venus is often referred to as “Earth’s Twin” (or “sister planet”), and for good reason. Despite some rather glaring differences, not the least of which is their vastly different atmospheres, there are enough similarities between Earth and Venus that many scientists consider the two to be closely related. In short, they are believed to have been very similar early in their existence, but then evolved in different directions.
Earth and Venus are both terrestrial planets that are located within the Sun’s Habitable Zone (aka. “Goldilocks Zone”) and have similar sizes and compositions. Beyond that, however, they have little in common. Let’s go over all their characteristics, one by one, so we can in what ways they are different and what ways they are similar.
At one time, astronomers believed the surface of Mars was crisscrossed by canal systems. This in turn gave rise to speculation that Mars was very much like Earth, capable of supporting life and home to a native civilization. But as human satellites and rovers began to conduct flybys and surveys of the planet, this vision of Mars quickly dissolved, replaced by one in which the Red Planet was a cold, desiccated and lifeless world.
However, over the past few decades, scientists have come to learn a great deal about the history of Mars that has altered this view as well. We now know that though Mars may currently be very cold, very dry, and very inhospitable, this wasn’t always the case. What’s more, we have come to see that even in its current form, Mars and Earth actually have a lot in common.
Between the two planets, there are similarities in size, inclination, structure, composition, and even the presence of water on their surfaces. That being said, they also have a lot of key differences that would make living on Mars, a growing preoccupation among many humans (looking at you, Elon Musk and Bas Lansdorp!), a significant challenge. Let’s go over these similarities and the difference in an orderly fashion, shall we?
Sizes, Masses and Orbits:
In terms of their size and mass, Earth and Mars are quite different. With a mean radius of 6371 km and a mass of 5.97×1024 kg, Earth is the fifth largest and fifth most-massive planet in the Solar System, and the largest of the terrestrial planets. Mars, meanwhile, has a radius of approximately 3,396 km at its equator (3,376 km at its polar regions), which is the equivalent of roughly 0.53 Earths. However, it’s mass is just 6.4185 x 10²³ kg, which is around 10.7% that of Earth’s.
Artistic representation of the orbits of Earth and Mars. Credit: NASA
Similarly, Earth’s volume is a hefty 1.08321 x 10¹² km3, which works out 1,083 billion cubic kilometers. By comparison, Mars has a volume of 1.6318 x 10¹¹ km³ (163 billion cubic kilometers) which is the equivalent of 0.151 Earths. Between this difference in size, mass, and volume, Mars’s surface gravity is 3.711 m/s², which works out to 37.6% of Earths (0.376 g).
In terms of their orbits, Earth and Mars are also quite different. For instance, Earth orbits the Sun at an average distance (aka. semi-major axis) of 149,598,261 km – or one Astronomical Unit (AU). This orbit has a very minor eccentricity (approx. 0.0167), which means its orbit ranges from 147,095,000 km (0.983 AU) at perihelion to 151,930,000 km (1.015 AU) at aphelion.
At its greatest distance from the Sun (aphelion), Mars orbits at a distance of approximately 249,200,000 km (1.666 AU). At perihelion, when it is closest to the Sun, it orbits at a distance of approximately 206,700,000 km (1.3814 AU). At these distances, the Earth has an orbital period of 365.25 days (1.000017 Julian years) while Mars has an orbital period of 686.971 days (1.88 Earth years).
However, in terms of their sidereal rotation (time it takes for the planet to complete a single rotation on its axis) Earth and Mars are again in the same boat. While Earth takes precisely 23h 56m and 4 s to complete a single sidereal rotation (0.997 Earth days), Mars does the same in about 24 hours and 40 minutes. This means that one Martian day (aka. Sol) is very close to single day on Earth.
Earth’s axial tilt (or obliquity) and its relation to the rotation axis and plane of orbit. Credit: Wikipedia Commons
Mars’s axial tilt is very similar to Earth’s, being inclined 25.19° to its orbital plane (whereas Earth’s axial tilt is just over 23°). This means that Mars also experiences seasons and temperature variations similar to that of Earth (see below).
Structure and Composition:
Earth and Mars are similar when it comes to their basic makeups, given that they are both terrestrial planets. This means that both are differentiated between a dense metallic core and an overlying mantle and crust composed of less dense materials (like silicate rock). However, Earth’s density is higher than that of Mars – 5.514 g/cm3 compared to 3.93 g/cm³ (or 0.71 Earths) – which indicates that Mars’ core region contains more lighter elements than Earth’s.
Earth’s core region is made up of a solid inner core that has a radius of about 1,220 km and a liquid outer core that extends to a radius of about 3,400 km. Both the inner and outer cores are composed of iron and nickel, with trace amounts of lighter elements, and together, they add to a radius that is as large as Mars itself. Current models of Mars’ interior suggest that its core region is roughly 1,794 ± 65 kilometers (1,115 ± 40 mi) in radius, and is composed primarily of iron and nickel with about 16-17% sulfur.
Both planets have a silicate mantle surrounding their cores and a surface crust of solid material. Earth’s mantle – consisting of an upper mantle of slightly viscous material and a lower mantle that is more solid – is roughly 2,890 km (1,790 mi) thick and is composed of silicate rocks that are rich in iron and magnesium. The Earth’s crust is on average 40 km (25 mi) thick, and is composed of rocks that are rich in iron and magnesium (i.e. igneous rocks) and granite (rich in sodium, potassium, and aluminum).
Artist’s impression of the interior of Mars. Credit: NASA/JPL
Comparatively, Mars’ mantle is quite thin, measuring some 1,300 to 1,800 kilometers (800 – 1,100 mi) in thickness. Like Earth, this mantle is believed to be composed of silicate rock that are rich in minerals compared to the crust, and to be partially viscous (resulting in convection currents which shaped the surface). The crust, meanwhile, averages about 50 km (31 mi) in thickness, with a maximum of 125 km (78 mi). This makes it about three times as hick as Earth’s crust, relative to the sizes of the two planets.
Ergo, the two planets are similar in composition, owing to their common status as terrestrial planets. And while they are both differentiated between a metallic core and layers of less dense material, there is some variance in terms of how proportionately thick their respective layers are.
Surface Features:
When it comes to the surfaces of Earth and Mars, things once again become a case of contrasts. Naturally, it is the differences that are most apparent when comparing Blue Earth to the Red Planet – as the nicknames would suggest. Unlike other planet’s in our Solar System, the vast majority of Earth is covered in liquid water, about 70% of the surface – or 361.132 million km² (139.43 million sq mi) to be exact.
The surface of Mars is dry, dusty, and covered in dirt that is rich iron oxide (aka. rust, leading to its reddish appearance). However, large concentrations of ice water are known to exist within the polar ice caps – Planum Boreum and Planum Australe. In addition, a permafrost mantle stretches from the pole to latitudes of about 60°, meaning that ice water exists beneath much of the Martian surface. Radar data and soil samples have confirmed the presence of shallow subsurface water at the middle latitudes as well.
As for the similarities, Earth and Mars’ both have terrains that varies considerably from place to place. On Earth, both above and below sea level, there are mountainous features, volcanoes, scarps (trenches), canyons, plateaus, and abyssal plains. The remaining portions of the surface are covered by mountains, deserts, plains, plateaus, and other landforms.
Mars is quite similar, with a surface covered by mountain ranges, sandy plains, and even some of the largest sand dunes in the Solar System. It also has the largest mountain in the Solar System, the shield volcano Olympus Mons, and the longest, deepest chasm in the Solar System: Valles Marineris.
Earth and Mars have also experienced many impacts from asteroids and meteors over the years. However, Mars’ own impact craters are far better preserved, with many dating back billions of years. The reason for this is the low air pressure and lack of precipitation on Mars, which results in a very slow rate of erosion. However, this was not always the case.
Mars has discernible gullies and channels on its surface, and many scientists believe that liquid water used to flow through them. By comparing them to similar features on Earth, it is believed that these were were at least partially formed by water erosion. Some of these channels are quite large, reaching 2,000 kilometers in length and 100 kilometers in width.
Color mosaic of Mars’ greatest mountain, Olympus Mons, viewed from orbit. Credit NASA/JPL
So while they look quite different today, Earth and Mars were once quite similar. And similar geological processes occurred on both planets to give them the kind of varied terrain they both currently have.
Atmosphere and Temperature:
Atmospheric pressure and temperatures are another way in which Earth and Mars are quite different. Earth has a dense atmosphere composed of five main layers – the Troposphere, the Stratosphere, the Mesosphere, the Thermosphere, and the Exosphere. Mars’ is very thin by comparison, with pressure ranging from 0.4 – 0.87 kPa – which is equivalent to about 1% of Earth’s at sea level.
Earth’s atmosphere is also primarily composed of nitrogen (78%) and oxygen (21%) with trace concentrations of water vapor, carbon dioxide, and other gaseous molecules. Mars’ is composed of 96% carbon dioxide, 1.93% argon and 1.89% nitrogen along with traces of oxygen and water. Recent surveys have also noted trace amounts of methane, with an estimated concentration of about 30 parts per billion (ppb).
Because of this, there is a considerable difference between the average surface temperature on Earth and Mars. On Earth, it is approximately 14°C, with plenty of variation due to geographical region, elevation, and time of year. The hottest temperature ever recorded on Earth was 70.7°C (159°F) in the Lut Desert of Iran, while the coldest temperature was -89.2°C (-129°F) at the Soviet Vostok Station on the Antarctic Plateau.
Space Shuttle Endeavor silhouetted against the atmosphere. The orange layer is the troposphere, the white layer is the stratosphere and the blue layer the mesosphere. Credit: NASABecause of its thin atmosphere and its greater distance from the Sun, the surface temperature of Mars is much colder, averaging at -46 °C (-51 °F). However, because of its tilted axis and orbital eccentricity, Mars also experiences considerable variations in temperature. These can be seen in the form of a low temperature of -143 °C (-225.4 °F) during the winter at the poles, and a high of 35 °C (95 °F) during summer and midday at the equator.
The atmosphere of Mars is also quite dusty, containing particulates that measure 1.5 micrometers in diameter, which is what gives the Martian sky a tawny color when seen from the surface. The planet also experiences dust storms, which can turn into what resembles small tornadoes. Larger dust storms occur when the dust is blown into the atmosphere and heats up from the Sun.
So basically, Earth has a dense atmosphere that is rich in oxygen and water vapor, and which is generally warm and conducive to life. Mars, meanwhile, is generally very cold, but can become quite warm at times. It’s also quite dry and very dusty.
Magnetic Fields:
When it comes to magnetic fields, Earth and Mars are in stark contrast to each other. On Earth, the dynamo effect created by the rotation of Earth’s inner core, relative to the rotation of the planet, generates the currents which are presumed to be the source of its magnetic field. The presence of this field is of extreme importance to both Earth’s atmosphere and to life on Earth as we know it.
Map from the Mars Global Surveyor of the current magnetic fields on Mars. Credit: NASA/JPL
Essentially, Earth’s magnetosphere serves to deflect most of the solar wind’s charged particles which would otherwise strip away the ozone layer and expose Earth to harmful radiation. The field ranges in strength between approximately 25,000 and 65,000 nanoteslas (nT), or 0.25–0.65 Gauss units (G).
Today, Mars has weak magnetic fields in various regions of the planet which appear to be the remnant of a magnetosphere. These fields were first measured by the Mars Global Surveyor, which indicated fields of inconsistent strengths measuring at most 1500 nT (~16-40 times less than Earth’s). In the northern lowlands, deep impact basins, and the Tharsis volcanic province, the field strength is very low. But in the ancient southern crust, which is undisturbed by giant impacts and volcanism, the field strength is higher.
This would seem to indicate that Mars had a magnetosphere in the past, and explanations vary as to how it lost it. Some suggest that it was blown off, along with the majority of Mars’ atmosphere, by a large impact during the Late Heavy Bombardment. This impact, it is reasoned, would have also upset the heat flow in Mars’ iron core, arresting the dynamo effect that would have produced the magnetic field.
Another theory, based on NASA’s MAVEN mission to study the Martian atmosphere, has it that Mars’ lost its magnetosphere when the smaller planet cooled, causing its dynamo effect to cease some 4.2 billion years ago. During the next several hundred million years, the Sun’s powerful solar wind stripped particles away from the unprotected Martian atmosphere at a rate 100 to 1,000 times greater than that of today. This in turn is what caused Mars to lose the liquid water that existed on its surface, as the environment to become increasing cold, desiccated, and inhospitable.
Satellites:
Earth and Mars are also similar in that both have satellites that orbit them. In Earth’s case, this is none other than The Moon, our only natural satellite and the source of the Earth’s tides. It’s existence has been known of since prehistoric times, and it has played a major role in the mythological and astronomical traditions of all human cultures. In addition, its size, mass and other characteristics are used as a reference point when assessing other satellites.
The Moon is one of the largest natural satellites in the Solar System and is the second-densest satellite of those whose moons who’s densities are known (after Jupiter’s satellite Io). Its diameter, at 3,474.8 km, is one-fourth the diameter of Earth; and at 7.3477 × 10²² kg, its mass is 1.2% of the Earth’s mass. It’s mean density is 3.3464 g/cm3 , which is equivalent to roughly 0.6 that of Earth. All of this results in our Moon possessing gravity that is about 16.54% the strength of Earth’s (aka. 1.62 m/s2).
The Moon varies in orbit around Earth, going from 362,600 km at perigee to 405,400 km at apogee. And like most known satellites within our Solar System, the Moon’s sidereal rotation period (27.32 days) is the same as its orbital period. This means that the Moon is tidally locked with Earth, with one side is constantly facing towards us while the other is facing away.
Thanks to examinations of Moon rocks that were brought back to Earth, the predominant theory states that the Moon was created roughly 4.5 billion years ago from a collision between Earth and a Mars-sized object (known as Theia). This collision created a massive cloud of debris that began circling our planet, which eventually coalesced to form the Moon we see today.
Mars has two small satellites, Phobos and Deimos. These moons were discovered in 1877 by the astronomer Asaph Hall and were named after mythological characters. In keeping with the tradition of deriving names from classical mythology, Phobos and Deimos are the sons of Ares – the Greek god of war that inspired the Roman god Mars. Phobos represents fear while Deimos stands for terror or dread.
Phobos measures about 22 km (14 mi) in diameter, and orbits Mars at a distance of 9,234.42 km when it is at periapsis (closest to Mars) and 9,517.58 km when it is at apoapsis (farthest). At this distance, Phobos is below synchronous altitude, which means that it takes only 7 hours to orbit Mars and is gradually getting closer to the planet. Scientists estimate that in 10 to 50 million years, Phobos could crash into Mars’ surface or break up into a ring structure around the planet.
Meanwhile, Deimos measures about 12 km (7.5 mi) and orbits the planet at a distance of 23,455.5 km (periapsis) and 23,470.9 km (apoapsis). It has a longer orbital period, taking 1.26 days to complete a full rotation around the planet. Mars may have additional moons that are smaller than 50- 100 meters (160 to 330 ft) in diameter, and a dust ring is predicted between Phobos and Deimos.
Scientists believe that these two satellites were once asteroids that were captured by the planet’s gravity. The low albedo and the carboncaceous chondrite composition of both moons – which is similar to asteroids – supports this theory, and Phobos’ unstable orbit would seem to suggest a recent capture. However, both moons have circular orbits near the equator, which is unusual for captured bodies.
So while Earth has a single satellite that is quite large and dense, Mars has two satellites that are small and orbit it at a comparatively close distance. And whereas the Moon was formed from Earth’s own debris after a rather severe collision, Mars’ satellites were likely captured asteroids.
Conclusion:
Okay, let’s review. Earth and Mars have their share of similarities, but also some rather stark differences.
Mean Radius: 6,371 km 3,396 km
Mass: 59.7×10²³ kg 6.42 x 10²³ kg
Volume: 10.8 x 10¹¹ km3 1.63 x 10¹¹ km³
Semi-Major Axis: 0.983 – 1.015 AU 1.3814 – 1.666 AU
Air Pressure: 101.325 kPa 0.4 – 0.87 kPa
Gravity: 9.8 m/s² 3.711 m/s²
Avg. Temperature: 14°C (57.2 °F) -46 °C (-51 °F)
Temp. Variations: ±160 °C (278°F) ±178 °C (320°F)
Axial Tilt: 23° 25.19°
Length of Day: 24 hours 24h 40m
Length of Year: 365.25 days 686.971 days
Water: Plentiful Intermittent (mostly frozen)
Polar Ice Caps: Yep Yep
In short, compared to Earth, Mars is a pretty small, dry, cold, and dusty planet. It has comparatively low gravity, very little atmosphere and no breathable air. And the years are also mighty long, almost twice that of Earth, in fact. However, the planet does have its fair share of water (albeit mostly in ice form), has seasonal cycles similar to Earth, temperature variations that are similar, and a day that is almost as long.
All of these factors will have to be addressed if ever human beings want to live there. And whereas some can be worked with, others will have to be overcome or adapted to. And for that, we will have to lean pretty heavily on our technology (i.e. terraforming and geoengineering). Best of luck to those who would like to venture there someday, and who do not plan on coming home!
The Earth's layers, showing the Inner and Outer Core, the Mantle, and Crust. Credit: discovermagazine.com
There is more to the Earth than what we can see on the surface. In fact, if you were able to hold the Earth in your hand and slice it in half, you’d see that it has multiple layers. But of course, the interior of our world continues to hold some mysteries for us. Even as we intrepidly explore other worlds and deploy satellites into orbit, the inner recesses of our planet remains off limit from us.
However, advances in seismology have allowed us to learn a great deal about the Earth and the many layers that make it up. Each layer has its own properties, composition, and characteristics that affects many of the key processes of our planet. They are, in order from the exterior to the interior – the crust, the mantle, the outer core, and the inner core. Let’s take a look at them and see what they have going on.
Modern Theory:
Like all terrestrial planets, the Earth’s interior is differentiated. This means that its internal structure consists of layers, arranged like the skin of an onion. Peel back one, and you find another, distinguished from the last by its chemical and geological properties, as well as vast differences in temperature and pressure.
Our modern, scientific understanding of the Earth’s interior structure is based on inferences made with the help of seismic monitoring. In essence, this involves measuring sound waves generated by earthquakes, and examining how passing through the different layers of the Earth causes them to slow down. The changes in seismic velocity cause refraction which is calculated (in accordance with Snell’s Law) to determine differences in density.
Model of a flat Earth, with the continents modeled in a disk-shape and Antarctica as an ice wall. Credit: Wikipedia Commons
These are used, along with measurements of the gravitational and magnetic fields of the Earth and experiments with crystalline solids that simulate pressures and temperatures in the Earth’s deep interior, to determine what Earth’s layers looks like. In addition, it is understood that the differences in temperature and pressure are due to leftover heat from the planet’s initial formation, the decay of radioactive elements, and the freezing of the inner core due to intense pressure.
History of Study:
Since ancient times, human beings have sought to understand the formation and composition of the Earth. The earliest known cases were unscientific in nature – taking the form of creation myths or religious fables involving the gods. However, between classical antiquity and the medieval period, several theories emerged about the origin of the Earth and its proper makeup.
Most of the ancient theories about Earth tended towards the “Flat-Earth” view of our planet’s physical form. This was the view in Mesopotamian culture, where the world was portrayed as a flat disk afloat in an ocean. To the Mayans, the world was flat, and at it corners, four jaguars (known as bacabs) held up the sky. The ancient Persians speculated that the Earth was a seven-layered ziggurat (or cosmic mountain), while the Chinese viewed it as a four-side cube.
By the 6th century BCE, Greek philosophers began to speculate that the Earth was in fact round, and by the 3rd century BCE, the idea of a spherical Earth began to become articulated as a scientific matter. During the same period, the development of a geological view of the Earth also began to emerge, with philosophers understanding that it consisted of minerals, metals, and that it was subject to a very slow process of change.
Illustration of Edmond Halley’s model of a Hallow Earth, one that was made up of concentric spheres. Credit: Wikipedia Commons/Rick Manning
However, it was not until the 16th and 17th centuries that a scientific understanding of planet Earth and its structure truly began to advance. In 1692, Edmond Halley (discoverer of Halley’s Comet) proposed what is now known as the “Hollow-Earth” theory. In a paper submitted to Philosophical Transactions of Royal Society of London, he put forth the idea of Earth consisting of a hollow shell about 800 km thick (~500 miles).
Between this and an inner sphere, he reasoned there was an air gap of the same distance. To avoid collision, he claimed that the inner sphere was held in place by the force of gravity. The model included two inner concentric shells around an innermost core, corresponding to the diameters of the planets Mercury, Venus, and Mars respectively.
Halley’s construct was a method of accounting for the values of the relative density of Earth and the Moon that had been given by Sir Isaac Newton, in his Philosophiæ Naturalis Principia Mathematica (1687) – which were later shown to be inaccurate. However, his work was instrumental to the development of geography and theories about the interior of the Earth during the 17th and 18th centuries.
Another important factor was the debate during the 17th and 18th centuries about the authenticity of the Bible and the Deluge myth. This propelled scientists and theologians to debate the true age of the Earth, and compelled the search for evidence that the Great Flood had in fact happened. Combined with fossil evidence, which was found within the layers of the Earth, a systematic basis for identifying and dating the Earth’s strata began to emerge.
The growing importance of mining in the 17th and 18th centuries, particularly for precious metals, led to further developments in geology and Earth sciences. Credit: minerals.usgs.gov
The development of modern mining techniques and growing attention to the importance of minerals and their natural distribution also helped to spur the development of modern geology. In 1774, German geologist Abraham Gottlob Werner published Von den äusserlichen Kennzeichen der Fossilien (On the External Characters of Minerals) which presented a detailed system for identifying specific minerals based on external characteristics.
In 1741, the National Museum of Natural History in France created the first teaching position designated specifically for geology. This was an important step in further promoting knowledge of geology as a science and in recognizing the value of widely disseminating such knowledge. And by 1751, with the publication of the Encyclopédieby Denis Diderot, the term “geology” became an accepted term.
By the 1770s, chemistry was starting to play a pivotal role in the theoretical foundation of geology, and theories began to emerge about how the Earth’s layers were formed. One popular idea had it that liquid inundation, like the Biblical Deluge, was responsible for creating all the geological strata. Those who accepted this theory became known popularly as the Diluvianists or Neptunists.
Another thesis slowly gained currency from the 1780s forward, which stated that instead of water, strata had been formed through heat (or fire). Those who followed this theory during the early 19th century referred to this view as Plutonism, which held that the Earth formed gradually through the solidification of molten masses at a slow rate. These theories together led to the conclusion that the Earth was immeasurably older than suggested by the Bible.
HMS Beagle in the Galapagos Islands, painted by John Chancellor. Credit: hmsbeagleproject.otg
In the early 19th century, the mining industry and Industrial Revolution stimulated the rapid development of the concept of the stratigraphic column – that rock formations were arranged according to their order of formation in time. Concurrently, geologists and natural scientists began to understand that the age of fossils could be determined geologically (i.e. that the deeper the layer they were found in was from the surface, the older they were).
During the imperial period of the 19th century, European scientists also had the opportunity to conduct research in distant lands. One such individual was Charles Darwin, who had been recruited by Captain FitzRoy of the HMS Beagle to study the coastal land of South America and give geological advice.
Darwin’s discovery of giant fossils during the voyage helped to establish his reputation as a geologist, and his theorizing about the causes of their extinction led to his theory of evolution by natural selection, published in On the Origin of Species in 1859.
During the 19th century, the governments of several countries including Canada, Australia, Great Britain and the United States began funding geological surveys that would produce geological maps of vast areas of the countries. Thought largely motivated by territorial ambitions and resource exploitation, they did benefit the study of geology.
The Earth’s Tectonic Plates. Credit: msnucleus.org
By this time, the scientific consensus established the age of the Earth in terms of millions of years, and the increase in funding and the development of improved methods and technology helped geology to move farther away from dogmatic notions of the Earth’s age and structure.
By the early 20th century, the development of radiometric dating (which is used to determine the age of minerals and rocks), provided the necessary the data to begin getting a sense of the Earth’s true age. By the turn of the century, geologists now believed the Earth to be 2 billion years old, which opened doors for theories of continental movement during this vast amount of time.
In 1912, Alfred Wegener proposed the theory of Continental Drift, which suggested that the continents were joined together at a certain time in the past and formed a single landmass known as Pangaea. In accordance with this theory, the shapes of continents and matching coastline geology between some continents indicated they were once attached together.
The super-continent Pangea during the Permian period (300 – 250 million years ago). Credit: NAU Geology/Ron Blakey
Research into the ocean floor also led directly to the theory of Plate Tectonics, which provided the mechanism for Continental Drift. Geophysical evidence suggested lateral motion of continents and that oceanic crust is younger than continental crust. This geophysical evidence also spurred the hypothesis of paleomagnetism, the record of the orientation of the Earth’s magnetic field recorded in magnetic minerals.
Then there was the development of seismology, the study of earthquakes and the propagation of elastic waves through the Earth or through other planet-like bodies, in the early 20th century. By measuring the time of travel of refracted and reflected seismic waves, scientists were able to gradually infer how the Earth was layered and what lay deeper at its core.
For example, in 1910, Harry Fielding Ried put forward the “elastic rebound theory”, based on his studies of the 1906 San Fransisco earthquake. This theory, which stated that earthquakes occur when accumulated energy is released along a fault line, was the first scientific explanation for why earthquakes happen, and remains the foundation for modern tectonic studies.
Earth viewed from the Moon by the Apollo 11 spacecraft. Credit: NASA
Then in 1926, English scientist Harold Jeffreys claimed that below the crust, the core of the Earth is liquid, based on his study of earthquake waves. And then in 1937, Danish seismologist Inge Lehmann went a step further and determined that within the earth’s liquid outer core, there is a solid inner core.
By the latter half of the 20th century, scientists developed a comprehensive theory of the Earth’s structure and dynamics had formed. As the century played out, perspectives shifted to a more integrative approach, where geology and Earth sciences began to include the study of the Earth’s internal structure, atmosphere, biosphere and hydrosphere into one.
This was assisted by the development of space flight, which allowed for Earth’s atmosphere to be studied in detail, as well as photographs taken of Earth from space. In 1972, the Landsat Program, a series of satellite missions jointly managed by NASA and the U.S. Geological Survey, began supplying satellite images that provided geologically detailed maps, and have been used to predict natural disasters and plate shifts.
Earth’s Layers:
The Earth can be divided into one of two ways – mechanically or chemically. Mechanically – or rheologically, meaning the study of liquid states – it can be divided into the lithosphere, asthenosphere, mesospheric mantle, outer core, and the inner core. But chemically, which is the more popular of the two, it can be divided into the crust, the mantle (which can be subdivided into the upper and lower mantle), and the core – which can also be subdivided into the outer core, and inner core.
The inner core is solid, the outer core is liquid, and the mantle is solid/plastic. This is due to the relative melting points of the different layers (nickel–iron core, silicate crust and mantle) and the increase in temperature and pressure as depth increases. At the surface, the nickel-iron alloys and silicates are cool enough to be solid. In the upper mantle, the silicates are generally solid but localized regions of melt exist, leading to limited viscosity.
In contrast, the lower mantle is under tremendous pressure and therefore has a lower viscosity than the upper mantle. The metallic nickel–iron outer core is liquid because of the high temperature. However, the intense pressure, which increases towards the inner core, dramatically changes the melting point of the nickel–iron, making it solid.
The differentiation between these layers is due to processes that took place during the early stages of Earth’s formation (ca. 4.5 billion years ago). At this time, melting would have caused denser substances to sink toward the center while less-dense materials would have migrated to the crust. The core is thus believed to largely be composed of iron, along with nickel and some lighter elements, whereas less dense elements migrated to the surface along with silicate rock.
Earth’s Crust:
The crust is the outermost layer of the planet, the cooled and hardened part of the Earth that ranges in depth from approximately 5-70 km (~3-44 miles). This layer makes up only 1% of the entire volume of the Earth, though it makes up the entire surface (the continents and the ocean floor).
The Earth’s layers (strata) shown to scale. Credit: pubs.usgs.gov
The thinner parts are the oceanic crust, which underlies the ocean basins at a depth of 5-10 km (~3-6 miles), while the thicker crust is the continental crust. Whereas the oceanic crust is composed of dense material such as iron magnesium silicate igneous rocks (like basalt), the continental crust is less dense and composed of sodium potassium aluminum silicate rocks, like granite.
The uppermost section of the mantle (see below), together with the crust, constitutes the lithosphere – an irregular layer with a maximum thickness of perhaps 200 km (120 mi). Many rocks now making up Earth’s crust formed less than 100 million (1×10⁸) years ago. However, the oldest known mineral grains are 4.4 billion (4.4×10⁹) years old, indicating that Earth has had a solid crust for at least that long.
Upper Mantle:
The mantle, which makes up about 84% of Earth’s volume, is predominantly solid, but behaves as a very viscous fluid in geological time. The upper mantle, which starts at the “Mohorovicic Discontinuity” (aka. the “Moho” – the base of the crust) extends from a depth of 7 to 35 km (4.3 to 21.7 mi) downwards to a depth of 410 km (250 mi). The uppermost mantle and the overlying crust form the lithosphere, which is relatively rigid at the top but becomes noticeably more plastic beneath.
Compared to other strata, much is known about the upper mantle, thanks to seismic studies and direct investigations using mineralogical and geological surveys. Movement in the mantle (i.e. convection) is expressed at the surface through the motions of tectonic plates. Driven by heat from deeper in the interior, this process is responsible for Continental Drift, earthquakes, the formation of mountain chains, and a number of other geological processes.
Computer simulation of the Earth’s field in a period of normal polarity between reversals. Credit: science.nasa.govThe mantle is also chemically distinct from the crust, in addition to being different in terms of rock types and seismic characteristics. This is due in large part to the fact that the crust is made up of solidified products derived from the mantle, where the mantle material is partially melted and viscous. This causes incompatible elements to separate from the mantle, with less dense material floating upward and solidifying at the surface.
The crystallized melt products near the surface, upon which we live, are typically known to have a lower magnesium to iron ratio and a higher proportion of silicon and aluminum. These changes in mineralogy may influence mantle convection, as they result in density changes and as they may absorb or release latent heat as well.
In the upper mantle, temperatures range between 500 to 900 °C (932 to 1,652 °F). Between the upper and lower mantle, there is also what is known as the transition zone, which ranges in depth from 410-660 km (250-410 miles).
Lower Mantle:
The lower mantle lies between 660-2,891 km (410-1,796 miles) in depth. Temperatures in this region of the planet can reach over 4,000 °C (7,230 °F) at the boundary with the core, vastly exceeding the melting points of mantle rocks. However, due to the enormous pressure exerted on the mantle, viscosity and melting are very limited compared to the upper mantle. Very little is known about the lower mantle apart from that it appears to be relatively seismically homogeneous.
The internal structure of Earth. Credit: Wikipedia Commons/Kelvinsong
Outer Core:
The outer core, which has been confirmed to be liquid (based on seismic investigations), is 2300 km thick, extending to a radius of ~3,400 km. In this region, the density is estimated to be much higher than the mantle or crust, ranging between 9,900 and 12,200 kg/m3. The outer core is believed to be composed of 80% iron, along with nickel and some other lighter elements.
Denser elements, like lead and uranium, are either too rare to be significant or tend to bind to lighter elements and thus remain in the crust. The outer core is not under enough pressure to be solid, so it is liquid even though it has a composition similar to that of the inner core. The temperature of the outer core ranges from 4,300 K (4,030 °C; 7,280 °F) in the outer regions to 6,000 K (5,730 °C; 10,340 °F) closest to the inner core.
Because of its high temperature, the outer core exists in a low viscosity fluid-state that undergoes turbulent convection and rotates faster than the rest of the planet. This causes eddy currents to form in the fluid core, which in turn creates a dynamo effect that is believed to influence Earth’s magnetic field. The average magnetic field strength in Earth’s outer core is estimated to be 25 Gauss (2.5 mT), which is 50 times the strength of the magnetic field measured on Earth’s surface.
Inner Core:
Like the outer core, the inner core is composed primarily of iron and nickel and has a radius of ~1,220 km. Density in the core ranges between 12,600-13,000 kg/m³, which suggests that there must also be a great deal of heavy elements there as well – such as gold, platinum, palladium, silver and tungsten.
Artist’s illustration of Earth’s core, inner core, and inner-inner core. Credit: Huff Post Science
The temperature of the inner core is estimated to be about 5,700 K (~5,400 °C; 9,800 °F). The only reason why iron and other heavy metals can be solid at such high temperatures is because their melting temperatures dramatically increase at the pressures present there, which ranges from about 330 to 360 gigapascals.
Because the inner core is not rigidly connected to the Earth’s solid mantle, the possibility that it rotates slightly faster or slower than the rest of Earth has long been considered. By observing changes in seismic waves as they passed through the core over the course of many decades, scientists estimate that the inner core rotates at a rate of one degree faster than the surface. More recent geophysical estimates place the rate of rotation between 0.3 to 0.5 degrees per year relative to the surface.
Recent discoveries also suggest that the solid inner core itself is composed of layers, separated by a transition zone about 250 to 400 km thick. This new view of the inner core, which contains an inner-inner core, posits that the innermost layer of the core measures 1,180 km (733 miles) in diameter, making it less than half the size of the inner core. It has been further speculated that while the core is composed of iron, it may be in a different crystalline structure that the rest of the inner core.
What’s more, recent studies have led geologists to conjecture that the dynamics of deep interior is driving the Earth’s inner core to expand at the rate of about 1 millimeter a year. This occurs mostly because the inner core cannot dissolve the same amount of light elements as the outer core.
The freezing of liquid iron into crystalline form at the inner core boundary produces residual liquid that contains more light elements than the overlying liquid. This in turn is believed to cause the liquid elements to become buoyant, helping to drive convection in the outer core. This growth is therefore likely to play an important role in the generation of Earth’s magnetic field by dynamo action in the liquid outer core. It also means that the Earth’s inner core, and the processes that drive it, are far more complex than previously thought!
Yes indeed, the Earth is a strange and mysteries place, titanic in scale as well as the amount of heat and energy that went into making it many billions of years ago. And like all bodies in our universe, the Earth is not a finished product, but a dynamic entity that is subject to constant change. And what we know about our world is still subject to theory and guesswork, given that we can’t examine its interior up close.
As the Earth’s tectonic plates continue to drift and collide, its interior continues to undergo convection, and its core continues to grow, who knows what it will look like eons from now? After all, the Earth was here long before we were, and will likely continue to be long after we are gone.
This Galielo image shows Jupiter's moon Ganymede in enhanced colour. The JWST aimed its instruments at our Solar System's largest moon to study its surface. Credit: NASA
In 1610, Galileo Galilei looked up at the night sky through a telescope of his own design. Spotting Jupiter, he noted the presence of several “luminous objects” surrounding it, which he initially took for stars. In time, he would notice that these “stars” were orbiting the planet, and realized that they were in fact Jupiter’s moons – which would come to be named Io, Europa, Ganymede and Callisto.
Of these, Ganymede is the largest, and boasts many fascinating characteristics. In addition to being the largest moon in the Solar System, it is also larger than even the planet Mercury. It is the only satellite in the Solar System known to possess a magnetosphere, has a thin oxygen atmosphere, and (much like its fellow-moons, Europa and Callisto) is believed to have an interior ocean.
A radar view of Venus taken by the Magellan spacecraft, with some gaps filled in by the Pioneer Venus orbiter. Credit: NASA/JPL
As the morning star, the evening star, and the brightest natural object in the sky (after the Moon), human beings have been aware of Venus since time immemorial. Even though it would be many thousands of years before it was recognized as being a planet, its has been a part of human culture since the beginning of recorded history.
Because of this, the planet has played a vital role in the mythology and astrological systems of countless peoples. With the dawn of the modern age, interest in Venus has grown, and observations made about its position in the sky, changes in appearance, and similar characteristics to Earth have taught us much about our Solar System.
Size, Mass, and Orbit:
Because of its similar size, mass, proximity to the Sun, and composition, Venus is often referred to as Earth’s “sister planet”. With a mass of 4.8676×1024 kg, a surface area of 4.60 x 10⁸ km², and a volume of 9.28×10¹¹ km3, Venus is 81.5% as massive as Earth, and has 90% of its surface area and 86.6% of its volume.
Venus orbits the Sun at an average distance of about 0.72 AU (108,000,000 km/67,000,000 mi) with almost no eccentricity. In fact, with its farthest orbit (aphelion) of 0.728 AU (108,939,000 km) and closest orbit (perihelion) of 0.718 AU (107,477,000 km), it has the most circular orbit of any planet in the Solar System.
Size comparison of Venus and Earth. Credit: NASA/JPL/Magellan
When Venus lies between Earth and the Sun, a position known as inferior conjunction, it makes the closest approach to Earth of any planet, at an average distance of 41 million km (making it the closest planet to Earth). This takes place, on average, once every 584 days. The planet completes an orbit around the Sun every 224.65 days, meaning that a year on Venus is 61.5% as long as a year on Earth.
Unlike most other planets in the Solar System, which rotate on their axes in an counter-clockwise direction, Venus rotates clockwise (called “retrograde” rotation). It also rotates very slowly, taking 243 Earth days to complete a single rotation. This is not only the slowest rotation period of any planet, it also means that a sidereal day on Venus lasts longer than a Venusian year.
Composition and Surface Features:
Little direct information is available on the internal structure of Venus. However, based on its similarities in mass and density to Earth, scientists believe that they share a similar internal structure – a core, mantle, and crust. Like that of Earth, the Venusian core is believed to be at least be partially liquid because the two planets have been cooling at about the same rate.
One difference between the two planets is the lack of evidence for plate tectonics, which could be due to its crust being too strong to subduct without water to make it less viscous. This results in reduced heat loss from the planet, preventing it from cooling and the possibility that internal heat is lost in periodic major resurfacing events. This is also suggested as a possible reason for why Venus has no internally generated magnetic field.
The internal structure of Venus – the crust (outer layer), the mantle (middle layer) and the core (yellow inner layer). Credit: Wikipedia Commons
Venus’ surface appears to have been shaped by extensive volcanic activity. Venus also has several times as many volcanoes as Earth, and has 167 large volcanoes that are over 100 km across. The presence of these volcanoes is due to the lack of plate tectonics, which results in an older, more preserved crust. Whereas Earth’s oceanic crust is subject to subduction at its plate boundaries, and is on average ~100 million years old, the Venusian surface is estimated to be 300-600 million years of age.
There are indications that volcanic activity may be ongoing on Venus. Missions performed by the Soviet space program in 1970s and more recently by the European Space Agency have detected lightning storms in Venus’ atmosphere. Since Venus does not experience rainfall (except in the form of sulfuric acid), it has been theorized that the lightning is being caused by a volcanic eruption.
Other evidence is the periodic rise and fall of sulfur dioxide concentrations in the atmosphere, which could be the result of periodic, large volcanic eruptions. And finally, localized infrared hot spots (likely to be in the range of 800 – 1100 K) have appeared on the surface, which could represent lava freshly released by volcanic eruptions.
The preservation of Venus’ surface is also responsible for its impact craters, which are impeccably preserved. Almost a thousand craters exist, which are evenly distributed across the surface and range from 3 km to 280 km in diameter. No craters smaller than 3 km exist because of the effect the dense atmosphere has on incoming objects.
3-D perspective of the Venusian volcano, Maat Mons generated from radar data from NASA’s Magellan mission.
Essentially, objects with less than a certain amount of kinetic energy are slowed down so much by the atmosphere that they do not create an impact crater. And incoming projectiles less than 50 meters in diameter will fragment and burn up in the atmosphere before reaching the ground.
Atmosphere and Climate:
Surface observations of Venus have been difficult in the past, due to its extremely dense atmosphere, which is composed primarily of carbon dioxide with a small amount of nitrogen. At 92 bar (9.2 MPa), the atmospheric mass is 93 times that of Earth’s atmosphere and the pressure at the planet’s surface is about 92 times that at Earth’s surface.
Venus is also the hottest planet in our Solar System, with a mean surface temperature of 735 K (462 °C/863.6 °F). This is due to the CO²-rich atmosphere which, along with thick clouds of sulfur dioxide, generates the strongest greenhouse effect in the Solar System. Above the dense CO² layer, thick clouds consisting mainly of sulfur dioxide and sulfuric acid droplets scatter about 90% of the sunlight back into space.
The surface of Venus is effectively isothermal, which means that their is virtually no variation in Venus’ surface temperature between day and night, or the equator and the poles. The planet’s minute axial tilt – less than 3° compared to Earth’s 23° – also minimizes seasonal temperature variation. The only appreciable variation in temperature occurs with altitude.
The highest point on Venus, Maxwell Montes, is therefore the coolest point on the planet, with a temperature of about 655 K (380 °C) and an atmospheric pressure of about 4.5 MPa (45 bar).
Another common phenomena is Venus’ strong winds, which reach speeds of up to 85 m/s (300 km/h; 186.4 mph) at the cloud tops and circle the planet every four to five Earth days. At this speed, these winds move up to 60 times the speed of the planet’s rotation, whereas Earth’s fastest winds are only 10-20% of the planet’s rotational speed.
Venus flybys have also indicated that its dense clouds are capable of producing lightning, much like the clouds on Earth. Their intermittent appearance indicates a pattern associated with weather activity, and the lightning rate is at least half of that on Earth.
Historical Observations:
Although ancients peoples knew about Venus, some of the cultures thought it was two separate celestial objects – the evening star and the morning star. Although the Babylonians realized that these two “stars” were in fact the same object – as indicated in the Venus tablet of Ammisaduqa, dated 1581 BCE – it was not until the 6th century BCE that this became a common scientific understanding.
Many cultures have identified the planet with their respective goddess of love and beauty. Venus is the Roman name for the goddess of love, while the Babylonians named it Ishtar and the Greeks called it Aphrodite. The Romans also designated the morning aspect of Venus Lucifer (literally “Light-Bringer”) and the evening aspect as Vesper (“evening”, “supper”, “west”), both of which were literal translations of the respective Greek names (Phosphorus and Hesperus).
Venus approaches the Sun in a 2012 transit visible from Earth. Credit: NASA
The transit of Venus in front of the Sun was first observed in 1032 by the Persian astronomer Avicenna, who concluded that Venus is closer to Earth than the Sun. In the 12th century, the Andalusian astronomer Ibn Bajjah observed two black spots in front of the sun, which were later identified as the transits of Venus and Mercury by Iranian astronomer Qotb al-Din Shirazi in the 13th century.
Modern Observations:
By the early 17th century, the transit of Venus was observed by English astronomer Jeremiah Horrocks on December 4th, 1639, from his home. William Crabtree, a fellow English astronomer and friend of Horrocks’, observed the transit at the same time, also from his home.
When the Galileo Galilei first observed the planet in the early 17th century, he found it showed phases like the Moon, varying from crescent to gibbous to full, and vice versa. This behavior, which could only be possible if Venus’ orbited the Sun, became part of Galileo’s challenge to the Ptolemaic geocentric model and his advocacy of the Copernican heliocentric model.
The atmosphere of Venus was discovered in 1761 by Russian polymath Mikhail Lomonosov, and then observed in 1790 by German astronomer Johann Schröter. Schröter found when the planet was a thin crescent, the cusps extended through more than 180°. He correctly surmised this was due to the scattering of sunlight in a dense atmosphere.
Artist’s impression of the surface of Venus Credit: ESA/AOES
In December 1866, American astronomer Chester Smith Lyman made observations of Venus from the Yale Observatory, where he was on the board of managers. While observing the planet, he spotted a complete ring of light around the dark side of the planet when it was at inferior conjunction, providing further evidence for an atmosphere.
Little else was discovered about Venus until the 20th century, when the development of spectroscopic, radar, and ultraviolet observations made it possible to scan the surface. The first UV observations were carried out in the 1920s, when Frank E. Ross found that UV photographs revealed considerable detail, which appeared to be the result of a dense, yellow lower atmosphere with high cirrus clouds above it.
Spectroscopic observations in the early 20th century also gave the first clues about the Venusian rotation. Vesto Slipher tried to measure the Doppler shift of light from Venus. After finding that he could not detect any rotation, he surmised the planet must have a very long rotation period. Later work in the 1950s showed the rotation was retrograde.
Radar observations of Venus were first carried out in the 1960s, and provided the first measurements of the rotation period, which were close to the modern value. Radar observations in the 1970s, using the radio telescope at the Arecibo Observatory in Puerto Rico revealed details of the Venusian surface for the first time – such as the presence of the Maxwell Montes mountains.
Exploration of Venus:
The first attempts to explore Venus were mounted by the Soviets in the 1960s through the Venera Program. The first spacecraft, Venera-1 (also known in the west as Sputnik-8) was launched on February 12th, 1961. However, contact was lost seven days into the mission when the probe was about 2 million km from Earth. By mid-may, it was estimated that the probe had passed within 100,000 km (62,000 miles) of Venus.
The Mariner 1 and 2 spacecrafts made their way to Venus. Mariner 2 was the first successful Venus Flyby on . Credit: NASA/JPL
The United States launched the Mariner 1 probe on July 22nd, 1962, with the intent of conducting a Venus flyby; but here too, contact was lost during launch. The Mariner 2 mission, which launched on December 14th, 1962, became the first successful interplanetary mission and passed within 34,833 km (21,644 mi) of Venus’ surface.
Its observations confirmed earlier ground-based observations which indicated that though the cloud tops were cool, the surface was extremely hot – at least 425 °C (797 °F). This put an end all speculation that the planet might harbor life. Mariner 2 also obtained improved estimates of Venus’s mass, but was unable to detect either a magnetic field or radiation belts.
The Venera-3 spacecraft was the Soviets second attempt to reach Venus, and their first attempted to place a lander on the planet’s surface. The spacecraft cash-landed on Venus on March 1st, 1966, and was the first man-made object to enter the atmosphere and strike the surface of another planet. Unfortunately, its communication system failed before it was able to return any planetary data.
On October 18th, 1967, the Soviets tried again with the Venera-4 spacecraft. After reaching the planet, the probe successfully entered the atmosphere and began studying the atmosphere. In addition to noting the prevalence of carbon dioxide (90-95%), it measured temperatures in excess of what Mariner 2 observed, reaching almost 500 °C. Due to the thickness of Venus’ atmosphere, the probe descended slower than anticipated, and its batteries ran out after 93 minutes when the probe was still 24.96 km from the surface.
The Mariner 10 spacecraft. Credit: NASA/JPL
One day later, on October 19th, 1967, Mariner 5 conducted a fly-by at a distance of less than 4000 km above the cloud tops. Originally built as a backup for the Mars-bound Mariner 4, the probe was refitted for a Venus mission after Venera-4‘s success. The probe managed to collect information on the composition, pressure and density of the Venusian atmosphere, which was then analyzed alongside the Venera-4 data by a Soviet-American science team during a series of symposiums.
Venera-5 and Venera-6 were launched in January of 1969, and reached Venus on 16th and 17th of May. Taking into account the extreme density and pressure of Venus’ atmosphere, these probes were able to achieve a faster descent and reached an altitude of 20 km before being crushed – but not before returning over 50 minutes of atmospheric data.
The Venera-7 was built with the intent of returning data from the planet’s surface, and was construed with a reinforced descent module capable of withstanding intense pressure. While entering the atmosphere on December 15th, 1970, the probe crashed on the surface, apparently due to a ripped parachute. Luckily, it managed to return 23 minutes of temperature data and the first telemetry from the another planet’s surface before going offline.
The Soviets launched three more Venera probes between 1972 and 1975. The first landed on Venus on July 22nd, 1972, and managed to transmit data for 50 minutes. Venera-9 and 10 – which entered Venus’ atmosphere on October 22nd and October 25th, 1975, respectively – both managed to send back images of Venus’ surface, the first images ever taken of another planet’s landscape.
Images of Venusian surface taken by the Venera 10 lander on October 25th, 1977. Credit: Russian Space Web/Donald Mitchell
On November 3rd, 1973, the United States had sent the Mariner 10probe on a gravitational slingshot trajectory past Venus on its way to Mercury. By February 5th, 1974, the probe passed within 5790 km of Venus, returning over 4000 photographs. The images, which were the best to date, showed the planet to be almost featureless in visible light; but revealed never-before-seen details about the clouds in ultraviolet light.
By the late seventies, NASA commenced the Pioneer Venus Project, which consisted of two separate missions. The first was the Pioneer Venus Orbiter, which inserted into an elliptical orbit around Venus on December 4th, 1978, where it studied its atmosphere and mapped the surface for a period of 13 days. The second, the Pioneer Venus Multiprobe, released a total of four probes which entered the atmosphere on December 9th, 1978, returning data on its composition, winds and heat fluxes.
Four more Venera lander missions took place between the late 70s and early 80s. Venera 11 and Venera 12 detected Venusian electrical storms; and Venera 13 andVenera 14 landed on the planet on March 1st and 5th, 1982, returning the first color photographs of the surface. The Venera program came to a close in October 1983, when Venera 15 and Venera 16 were placed in orbit to conduct mapping of the Venusian terrain with synthetic aperture radar.
In 1985, the Soviets participated in a collaborative venture with several European states to launch the Vega Program. This two-spacecraft initiative was intended to take advantage of the appearance of Halley’s Comet in the inner Solar System, and combine a mission to it with a flyby of Venus. While en route to Halley on June 11th and 15th, the two Vega spacecraft dropped Venera-style probes supported by balloons into the upper atmosphere – which discovered that it was more turbulent than previously estimated, and subject to high winds and powerful convection cells.
The first color pictures taken of the surface of Venus by the Venera-13 space probe. Credit: NASA
NASA’s Magellan spacecraft was launched on May 4th, 1989, with a mission to map the surface of Venus with radar. In the course of its four and a half year mission, Magellan provided the most high-resolution images to date of the planet and was able to map 98% of the surface and 95% of its gravity field. In 1994, at the end of its mission, Magellan was sent to its destruction into the atmosphere of Venus to quantify its density.
Venus was observed by the Galileo and Cassini spacecraft during flybys on their respective missions to the outer planets, but Magellan was the last dedicated mission to Venus for over a decade. It was not until October of 2006 and June of 2007 that the MESSENGER probe would conduct a flyby of Venus (and collect data) in order to slow its trajectory for an eventual orbital insertion of Mercury.
The Venus Express, a probe designed and built by the European Space Agency, successfully assumed polar orbit around Venus on April 11th, 2006. This probe conducted a detailed study of the Venusian atmosphere and clouds, and discovered an ozone layer and a swirling double-vortex at the south pole before concluding its mission in December of 2014.
Future Missions:
The Japan Aerospace Exploration Agency (JAXA) devised a Venus orbiter – Akatsuki (formerly “Planet-C”) – to conduct surface imaging with an infrared camera, studies on Venus’ lightning, and to determine the existence of current volcanism. The craft was launched on May 20th, 2010, but the craft failed to enter orbit in December 2010. Its main engine is still offline, but its controllers will attempt to use its small attitude control thrusters to make another orbital insertion attempt on December 7th, 2015.
Artist’s concept of the Venus in Situ explorer mission, which could be deployed to Venus by 2022. Credit: NASA
In late 2013, NASA launched the Venus Spectral Rocket Experiment, a sub-orbital space telescope. This experimented is intended to conduct ultraviolet light studies of Venus’s atmosphere, for the purpose of learning more about the history of water on Venus.
The European Space Agency’s (ESA) BepiColombo mission, which will launch in January 2017, will perform two flybys of Venus before it reaches Mercury orbit in 2020. NASA will launch the Solar Probe Plusin 2018, which will perform seven Venus flybys during its six-year mission to study the Sun.
Under its New Frontiers Program, NASA has proposed mounting a lander mission to Venus called the Venus In-Situ Explorer by 2022. The purpose will be to study Venus’ surface conditions and investigate the elemental and mineralogical features of the regolith. The probe would be equipped with a core sampler to drill into the surface and study pristine rock samples not weathered by the harsh surface conditions.
The Venera-D spacecraft is a proposed Russian space probe to Venus, which is scheduled to be launched around 2024. This mission will conduct remote-sensing observations around the planet and deploy a lander, based on the Venera design, capable of surviving for a long duration on the surface.
Because of its proximity to Earth, and its similarity in size, mass and composition, Venus was once believed to hold life. In fact, the idea of Venus being a tropical world persisted well into the 20th century, until the Venera and Mariner programs demonstrated the absolute hellish conditions that actually exist on the planet.
Nevertheless, it is believed that Venus may once have been much like Earth, with a similar atmosphere and warm, flowing water on its surface. This notion is supported by the fact that Venus sits within the inner edge of the Sun’s habitable zone and has an ozone layer. However, owing to the runaway greenhouse effect and the lack of a magnetic field, this water disappeared many billions of years ago.
Still, there are those who believed that Venus could one day support human colonies. Currently, the atmospheric pressure near to the ground is far too extreme for settlements to be built on the surface. But 50 km above the surface, both the temperature and air pressure are similar to Earth’s, and both nitrogen and oxygen are believed to exist. This has led to proposals for “floating cities” to be built in the Venusian atmosphere and the exploration of the atmosphere using Airships.
In addition, proposals have been made suggesting the Venus should be terraformed. These have ranged from installing a huge space-shade to combat the greenhouse effect, to crashing comets into the surface to blow the atmosphere off. Other ideas involve converting the atmosphere using calcium and magnesium to sequester the carbon away.
Much like proposals to terraform Mars, these ideas are all in their infancy and are hard-pressed to address the long-term challenges associated with changing the planet’s climate. However, they do show that humanity’s fascination with Venus has not diminished over time. From being a central to our mythology and the first star we saw in the morning (and the last one we saw at night), Venus has since gone on to become a subject of fascination for astronomers and a possible prospect for off-world real estate.
But until such time as technology improves, Venus will remain Earth’s hostile and inhospitable “sister planet”, with intense pressure, sulfuric acid rains, and a toxic atmosphere.
Our Sun regularly pelts the Earth with all kinds of radiation and charged particles. Just how bad can these solar storms get?
In today’s episode, we’re going to remind you how looking outside of the snow globe can inspire your next existential crisis.
You guys remember the Sun right? Look how happy that little fella is. The Sun is our friend! Life started because of the Sun! Oooh, look, the Sun has a baby face! It’s a beautiful, ball of warmth and goodness, lighting up our skies and bringing happiness into our hearts.
It’s a round yellow circle in crayon. Very stable and firmly edged. Occasionally drawn with a orange lion’s mane for coronal effects. Nothing to be afraid, right?
Wake up sheeple. It’s time to pull back the curtain of the marketing world, big crayon fridge art and the children’s television conspiracy of our brightly glowing neighborhood monstrosity. That thing is more dangerous than you can ever imagine.
You know the Sun is a nuclear reaction right next door. Like it’s right there. RIGHT THERE! It’s a mass of incandescent gas, with a boiling bubbling surface of super-heated hydrogen. It’s filled with a deep yellow rage, expressed every few days by lashing out millions of kilometers into space with fiery death tendrils and blasts of super radiation.
The magnetic field lines on the Sun snap and reconnect, releasing a massive amount of radiation and creating solar flares. Solar plasma constrained in the magnetic loop is instantly released, smashed together and potentially generating x-ray radiation.
“Big deal. I get x-rayed all the time.” you might think. We the mighty humans have mastered the X-ray spectrum! Not so fast puny mortal. Just a single x-ray class flare can blast out more juice than 100 billion nuclear explosions.
In this image, the Solar Dynamics Observatory (SDO) captured an X1.2 class solar flare, peaking on May 15, 2013. Credit: NASA/SDO
Then it’s just a quick 8 minute trip to your house, where the radiation hits us with no warning. Solar flares can lead to coronal mass ejections, and they can happen other times too, where huge bubbles of gas are ejected from the Sun and blasted into space. This cosmic goo can take a few hours to get to us, and are also excellent set-ups for nocturnal emission and dutch oven jokes.
Astronomers measure the impact of a solar storm on the Earth using a parameter called DST, or “disturbance storm time”. We measure the amount that the Earth’s protective magnetosphere flexes during a solar storm event. The bigger the negative number, the worse it is.
If we can see an aurora, a geomagnetic storms in the high altitudes, it measures about -50 nanoteslas. The worst storm in the modern era, the one that overloaded our power grid in 1989, measured about -600 nanoteslas.
The most potent solar storm we have on record was so powerful that people saw the Northern Lights as far south as Cuba. Telegraph lines sparked with electricity and telegraph towers caught on fire. This was in 1859 and was clearly named by Syfy’s steampunk division. This was known as the Carrington Event, and estimated in the -800 to -1750 nanotesla range.
A spectacular green and red aurora photographed early this morning March 17, 2015, from Donnelly Creek, Alaska. Credit: Sebastian Saarloos
So, how powerful do these things need to be to cook out our meat parts? The good news is contrary to my earlier fear mongering, the most powerful flare our Sun can generate is harmless to life on Earth.
Don’t let your guard down, the Sun is still horribly dangerous. It’ll bake us alive faster than you can say “Hansel und Gretel”. Assuming you can drag that phrase out over a billion years. As far as flares go, and so long as we stay right here, we’ll be fine. We might even see a nice aurora in the sky.
For those of you who use technology on a regular basis, you might not be so lucky. Powerful solar storms can overload power grids and fry satellites. If the Carrington Event happened now, we’d have a lot of power go out, and a small orbital scrapyard of dead satellites.
Astronauts outside the Earth, perhaps bouncing around on the Moon, or traveling to Mars would be in a universe of trouble without a good method of shielding.
The solar flares that the Sun can produce is minuscule compared to other stars out there. In 2014, NASA’s Swift satellite witnessed a flare that generated more than 10,000 times more energy than the most powerful solar flare ever seen.
Solar flare on the surface of the Sun. Image credit: NASA
For a brief moment, the surface of the red dwarf star DG Canum Venaticorum lit up hotter than 200 million degrees Celsius. That’s 12 times hotter than the center of the Sun. A blast that powerful would have scoured all life from the face of the Earth. Except the future colony of tardigrade descendants. Remember, the water bears are always watching.
Young red dwarf stars are renowned for these powerful flares, and this is one of the reasons astronomers think they’re not great candidates for life. It would be hard to survive blast after blast of radiation from these unruly stars. Alternately, planets around these stars are could be living terrariums inspired by the Gamma World RPG.
Breathe easy and don’t worry. Perhaps the Sun is our friend, and it truly does have our best interests at heart.
It’s not a big fan of our technology, though, and it’s ready to battle alongside us when the robot revolution begins. Oh, also, wear sunscreen, as the Sun’s brand of love isn’t all that different from Doctor Manhattan.
Have you ever seen an aurora display? Tell us a cool story in the comments below.
A United Launch Alliance Atlas V rocket with NASA’s Magnetospheric Multiscale (MMS) spacecraft onboard launches from the Cape Canaveral Air Force Station Space Launch Complex 41, Thursday, March 12, 2015, Florida. Credit: Ken Kremer- kenkremer.com
KENNEDY SPACE CENTER, FL – NASA’s constellation of state-of-the-art magnetospheric science satellites successfully rocketed to orbit late Thursday night, March 12, during a spectacular nighttime launch on a mission to unravel the mysteries of the process known as magnetic reconnection.
The $1.1 Billion Magnetospheric Multiscale (MMS) mission is comprised of four formation flying satellites blasted to Earth orbit atop a United Launch Alliance Atlas V rocket from Cape Canaveral Air Force Station, Florida, precisely on time at 10:44 p.m. EDT.
Magnetic reconnection is a little understood natural process whereby magnetic fields around Earth connect and disconnect while explosively releasing vast amounts of energy. It occurs throughout the universe.
NASA’s fleet of four MMS spacecraft will soon start the first mission devoted to studying the phenomenon called magnetic reconnection. Scientists believe that it is the catalyst for some of the most powerful explosions in our solar system.
The night launch of the venerable Atlas V booster turned night into day as the 195 foot tall rocket roared to life on the fiery fury of about a million and a half pounds of thrust, thrilling spectators all around the Florida space coast and far beyond.
A United Launch Alliance Atlas V rocket with NASA’s Magnetospheric Multiscale (MMS) spacecraft onboard launches from the Cape Canaveral Air Force Station Space Launch Complex 41, Thursday, March 12, 2015, Florida. Credit: Ken Kremer- kenkremer.com
NASA’s four Magnetospheric Multiscale (MMS) spacecraft were stacked like pancakes on top of one another and encapsulated inside the rocket extended nose cone atop the Atlas V.
The venerable rocket continues to enjoy a 100% success rate. It launched in the Atlas V 421 configuration with a 4-meter diameter Extra Extended Payload Fairing along with two Aerojet Rocketdyne solid rocket motors attached to the Atlas booster first stage.
The two stage Atlas V delivered the MMS satellites to a highly elliptical orbit. They were then deployed from the rocket’s Centaur upper stage sequentially, in five-minute intervals beginning at 12:16 a.m. Friday, March 13. The last separation occurred at 12:31 a.m.
About 10 minutes later at 12:40 a.m., NASA scientists and engineers confirmed the health of all four spacecraft.
“I am speaking for the entire MMS team when I say we’re thrilled to see all four of our spacecraft have deployed and data indicates we have a healthy fleet,” said Craig Tooley, project manager at NASA’s Goddard Space Flight Center in Greenbelt, Maryland.
Artist’s concept of the MMS observatory fleet with rainbow magnetic lines. Image Credit: NASA
This marked ULA’s 3rd launch in 2015, the 53nd Atlas V mission and the fourth Atlas V 421 launch in the programs life.
Each of the identically instrumented spacecraft are about four feet tall and eleven feet wide.
The deployment and activation of all four spacecraft is absolutely essential to the success of the mission, said Jim Burch, principal investigator of the MMS instrument suite science team at Southwest Research Institute (SwRI) in San Antonio, Texas.
They will fly in a pyramid formation to conduct their science mission, spaced about 10 miles apart. That separation distance will vary over time during the two year primary mission.
NASA scientists and engineers will begin deploying multiple booms and antennas on the spacecraft in a few days, MMS mission scientist Glyn Collinson of NASA Goddard told Universe Today.
The deployment and calibration process will last about six months, Collinson explained. Science observations are expected to begin in September 2015.
Technicians work on NASA’s 20-foot-tall Magnetospheric Multiscale (MMS) mated quartet of stacked observatories in the cleanroom at NASA’s Goddard Space Flight Center in Greenbelt, Md., on May 12, 2014. Credit: Ken Kremer- kenkremer.com
“After a decade of planning and engineering, the science team is ready to go to work,” said Burch.
“We’ve never had this type of opportunity to study this fundamental process in such detail.”
The spacecraft will fly in a tight formation through regions of reconnection activity.
The instruments will conduct their science observations at rates100 times faster than any previous mission.
“MMS is a crucial next step in advancing the science of magnetic reconnection – and no mission has ever observed this fundamental process with such detail,” said Jeff Newmark, interim director for NASA’s Heliophysics Division at the agency’s Headquarters in Washington.
“The depth and detail of our knowledge is going to grow by leaps and bounds, in ways that no one can yet predict.”
MMS measurements should lead to significant improvements in models for yielding better predictions of space weather and thereby the resulting impacts for life here on Earth as well as for humans aboard the ISS and robotic satellite explorers in orbit and the heavens beyond.
The best place to study magnetic reconnection is ‘in situ’ in Earth’s magnetosphere. This will lead to better predictions of space weather phenomena.
Magnetic reconnection is also believed to help trigger the spectacular aurora known as the Northern or Southern lights.
NASA MMS spacecraft fly in a pyramid pattern to capture the 3-D structure of the reconnection sites encountered. Credit: NASA
MMS is a Solar Terrestrial Probes Program, or STP, mission within NASA’s Heliophysics Division. The probes were built, integrated and tested at NASA Goddard which is responsible for overall mission management and operations.
Watch for Ken’s ongoing MMS coverage. He was onsite at the Kennedy Space Center in the days leading up to the launch and for the liftoff on March 12.
Stay tuned here for Ken’s continuing MMS, Earth and planetary science and human spaceflight news.

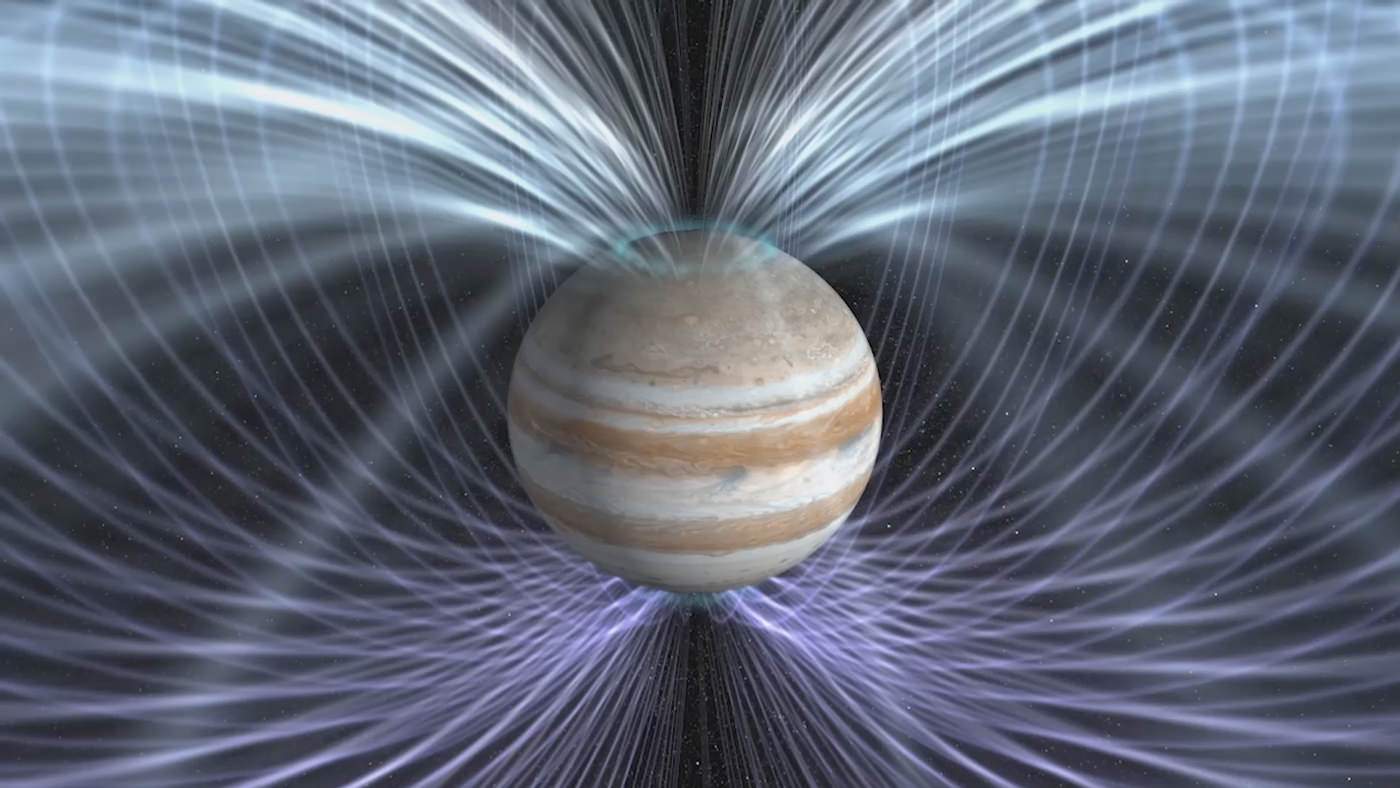
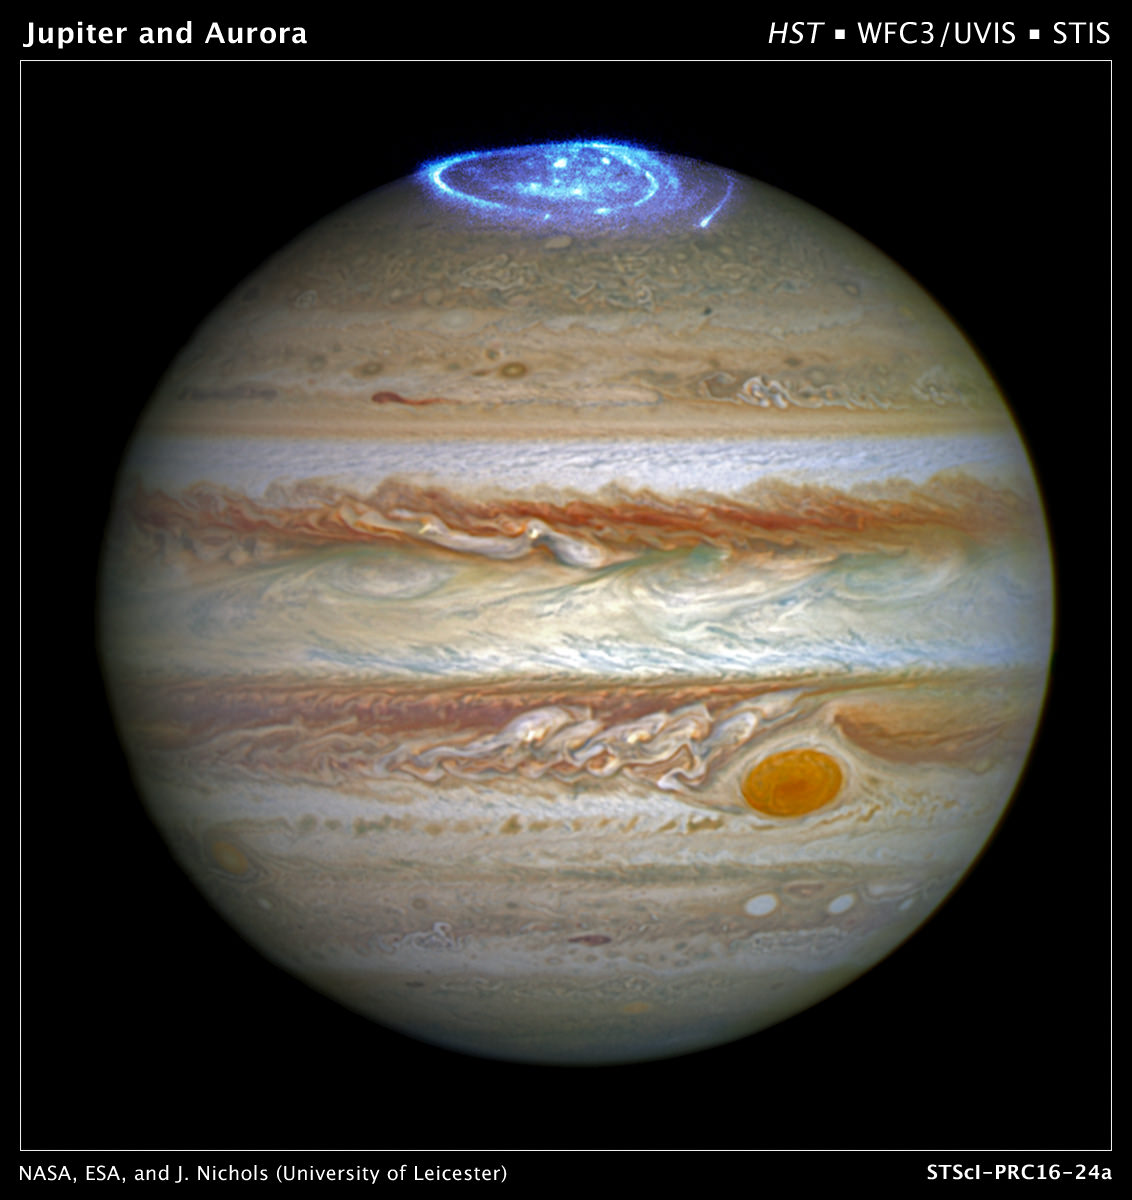
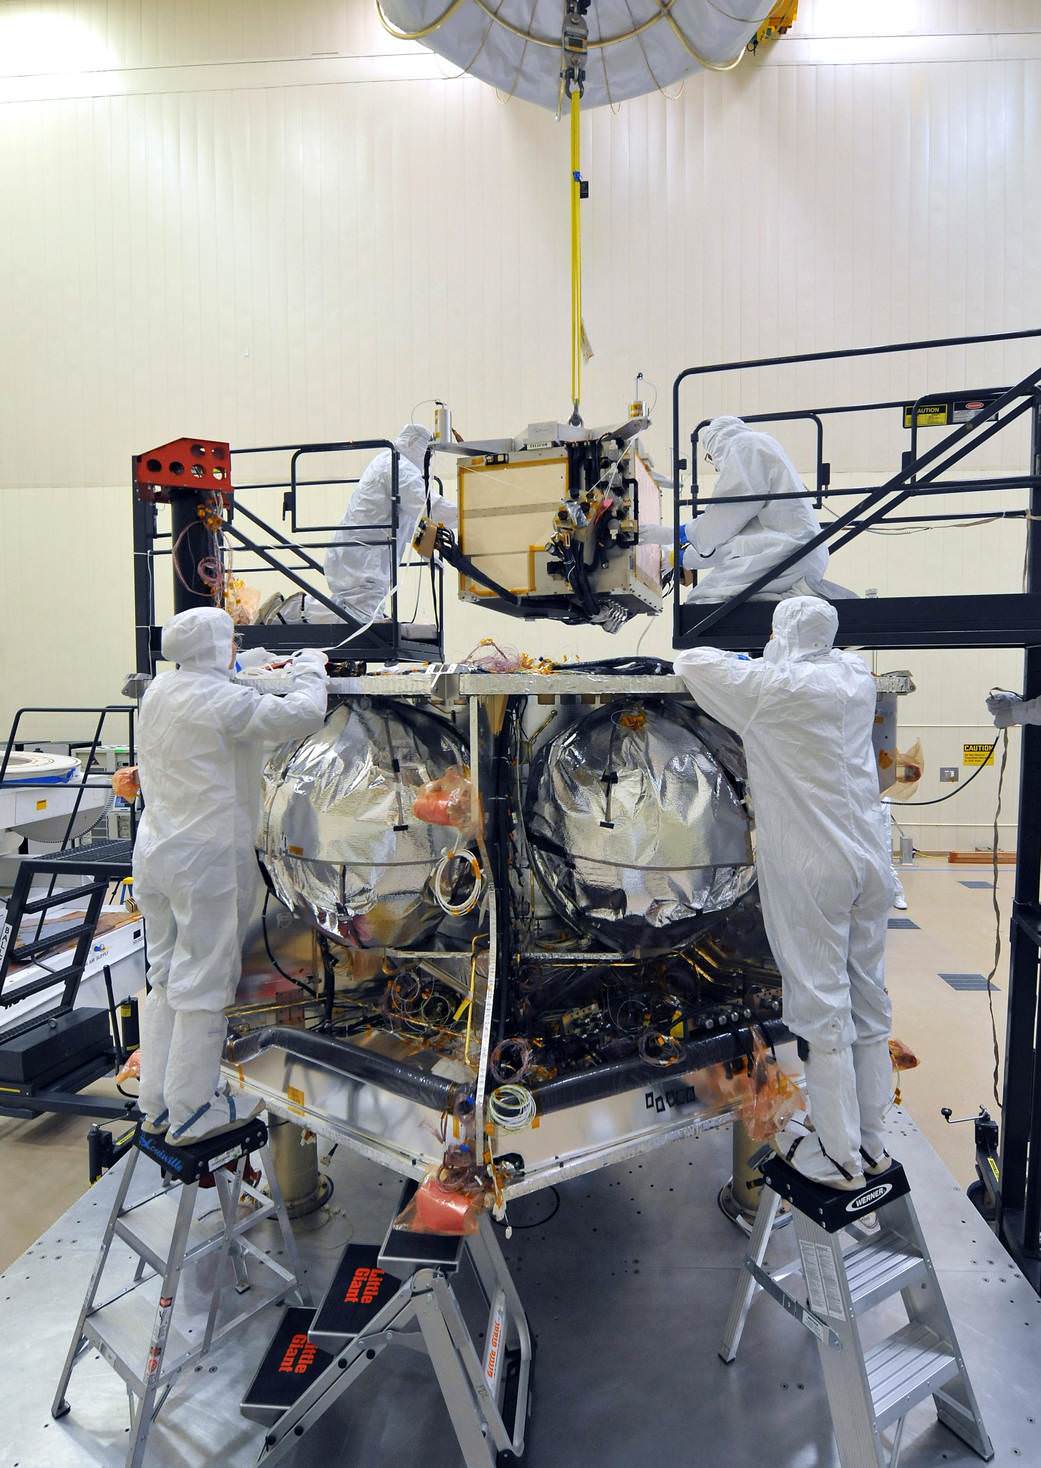
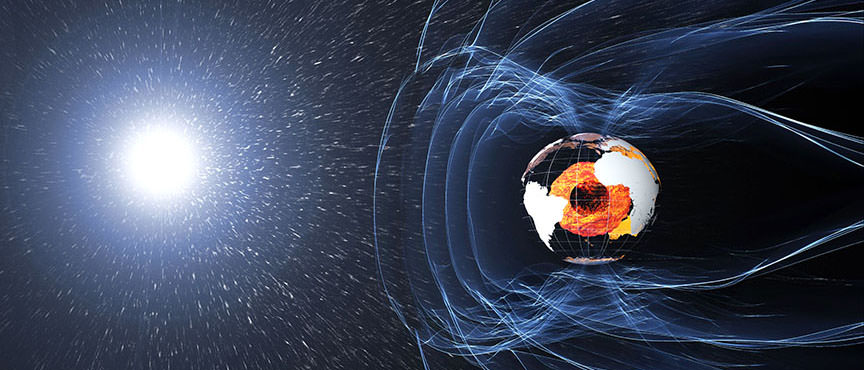

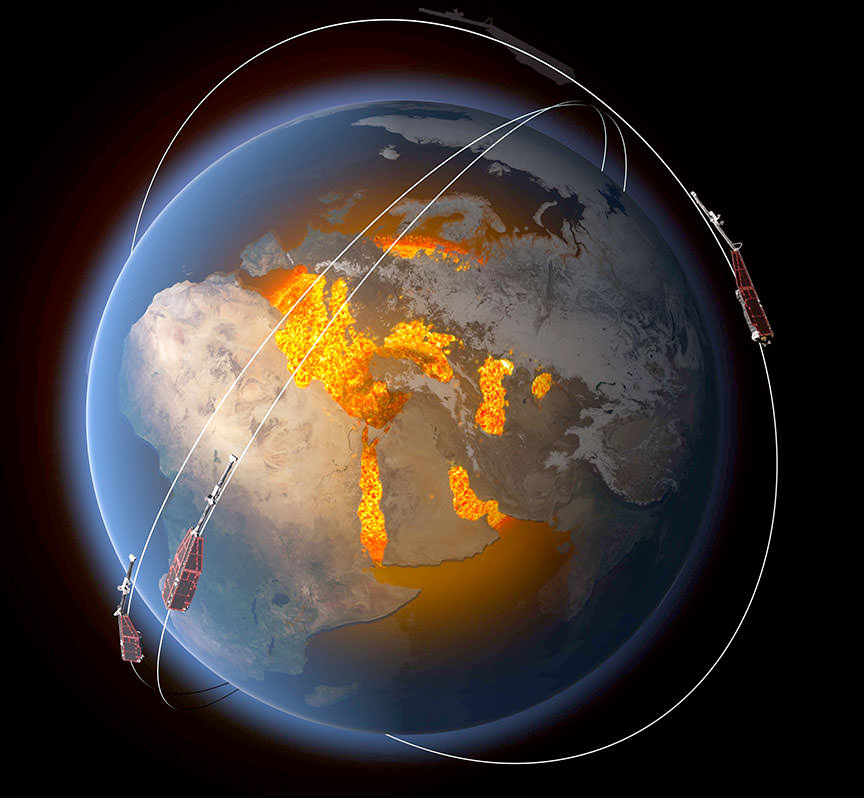
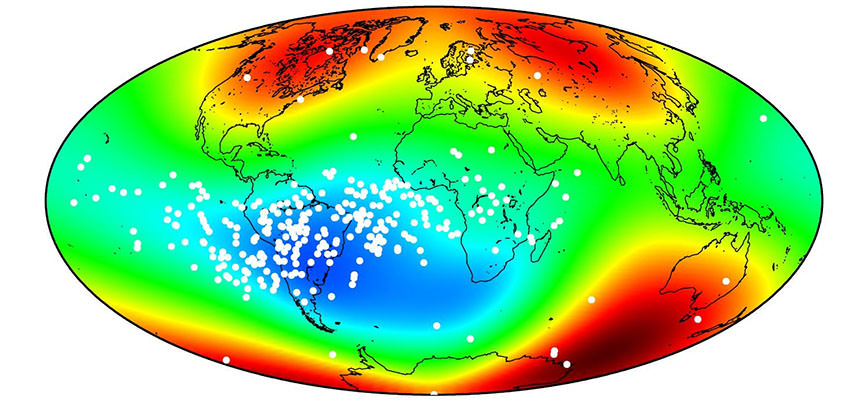
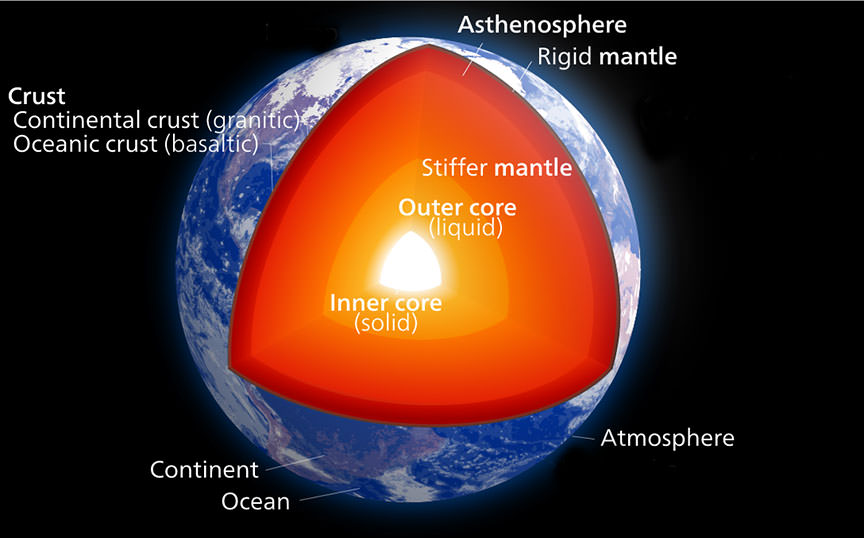
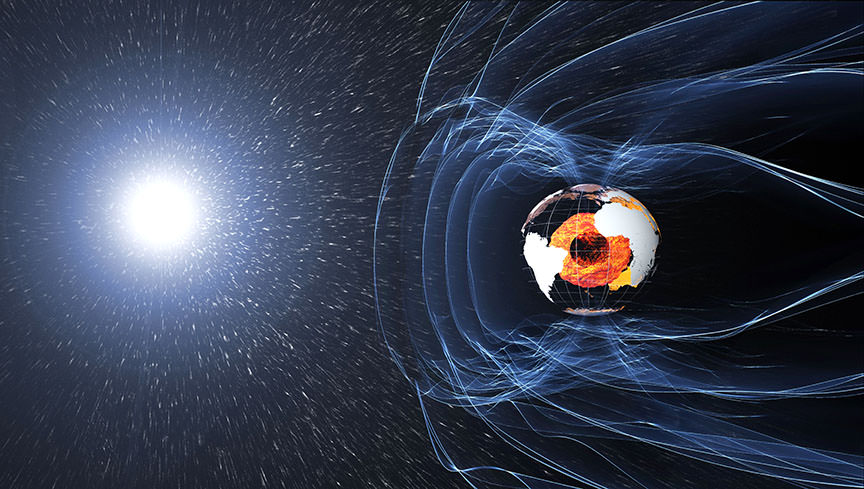


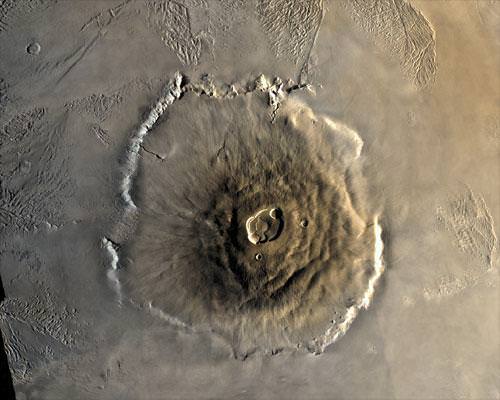
![Space Shuttle Endeavour sillouetted against the atmosphere. The orange layer is the troposphere, the white layer is the stratosphere and the blue layer the mesosphere.[1] (The shuttle is actually orbiting at an altitude of more than 320 km (200 mi), far above all three layers.) Credit: NASA](https://www.universetoday.com/wp-content/uploads/2012/03/Endeavour_silhouette_STS-130.jpg)
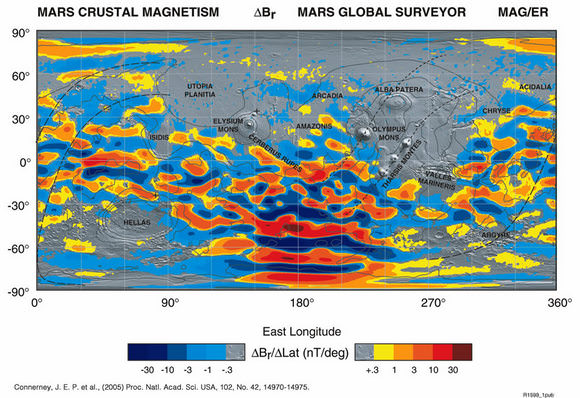


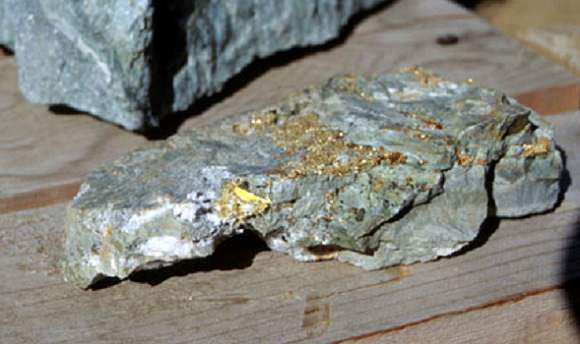


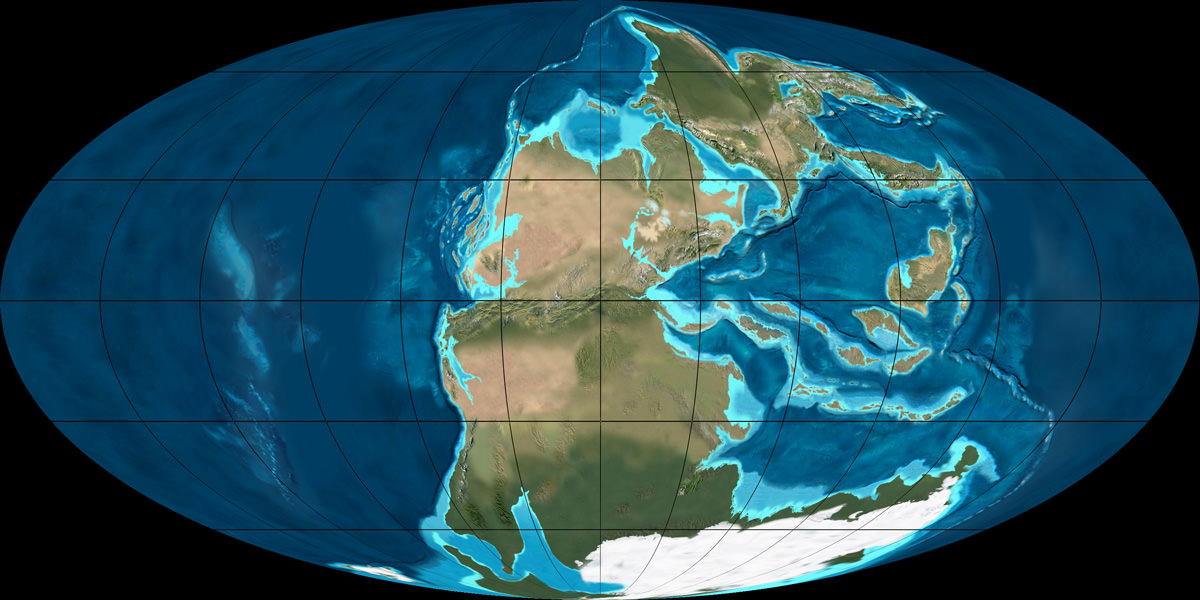
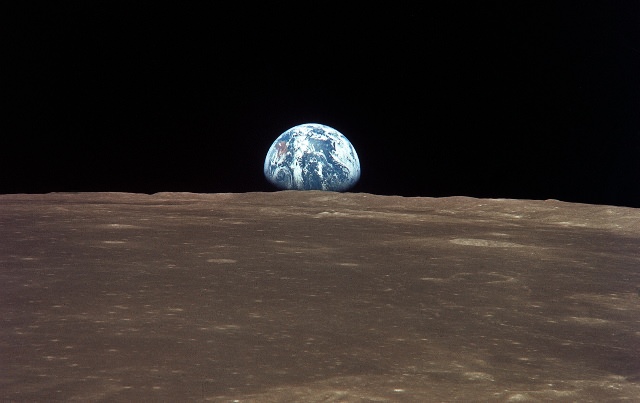

![Computer simulation of the Earth's field in a period of normal polarity between reversals.[1] The lines represent magnetic field lines, blue when the field points towards the center and yellow when away. The rotation axis of the Earth is centered and vertical. The dense clusters of lines are within the Earth's core](https://www.universetoday.com/wp-content/uploads/2010/03/Geodynamo_Between_Reversals-e1449100829326.gif)

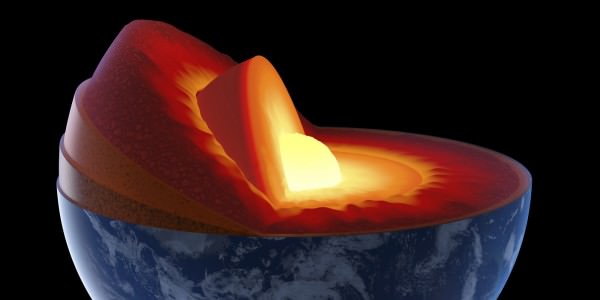


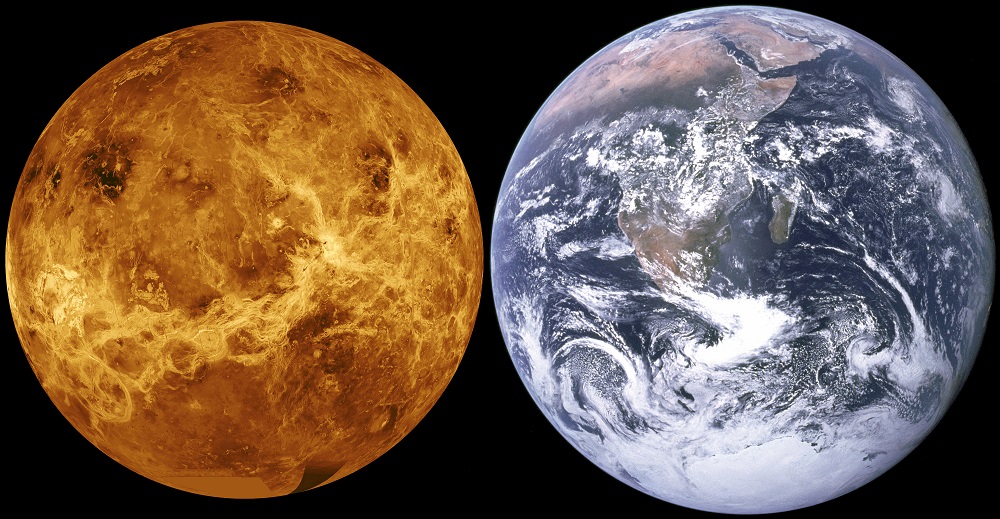


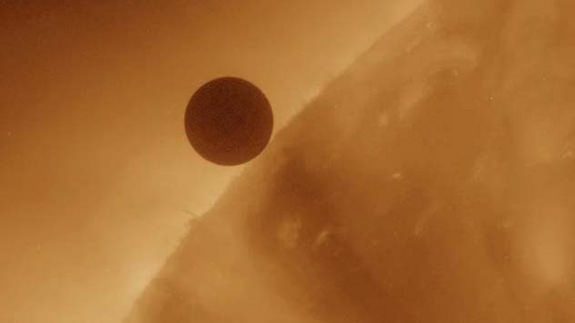

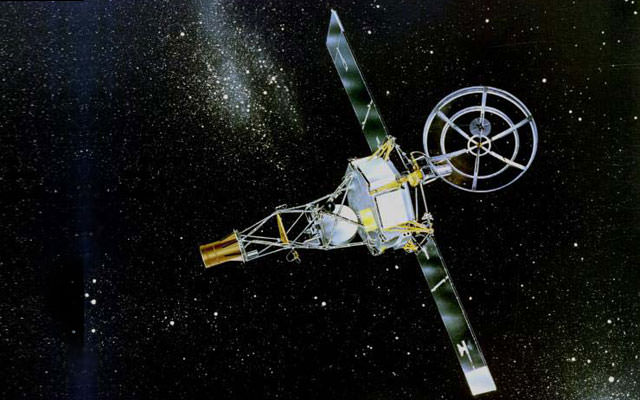

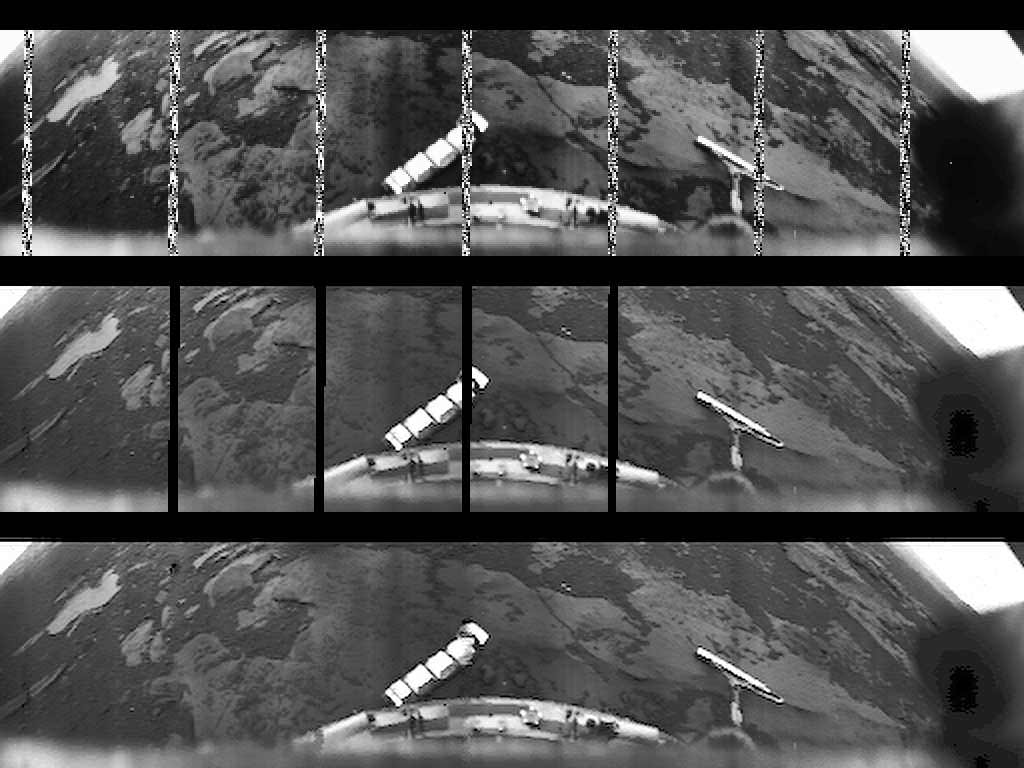

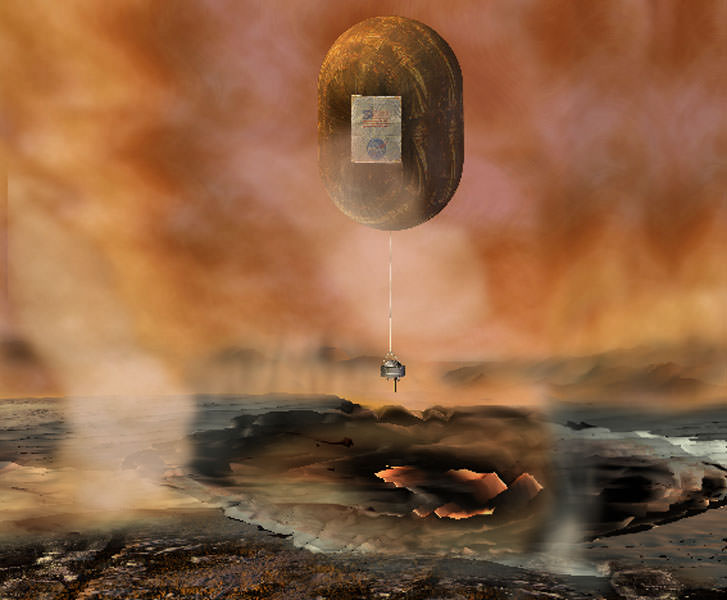

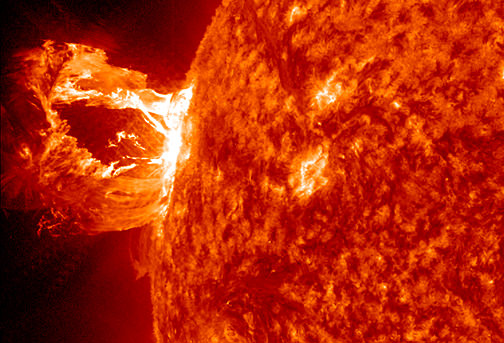
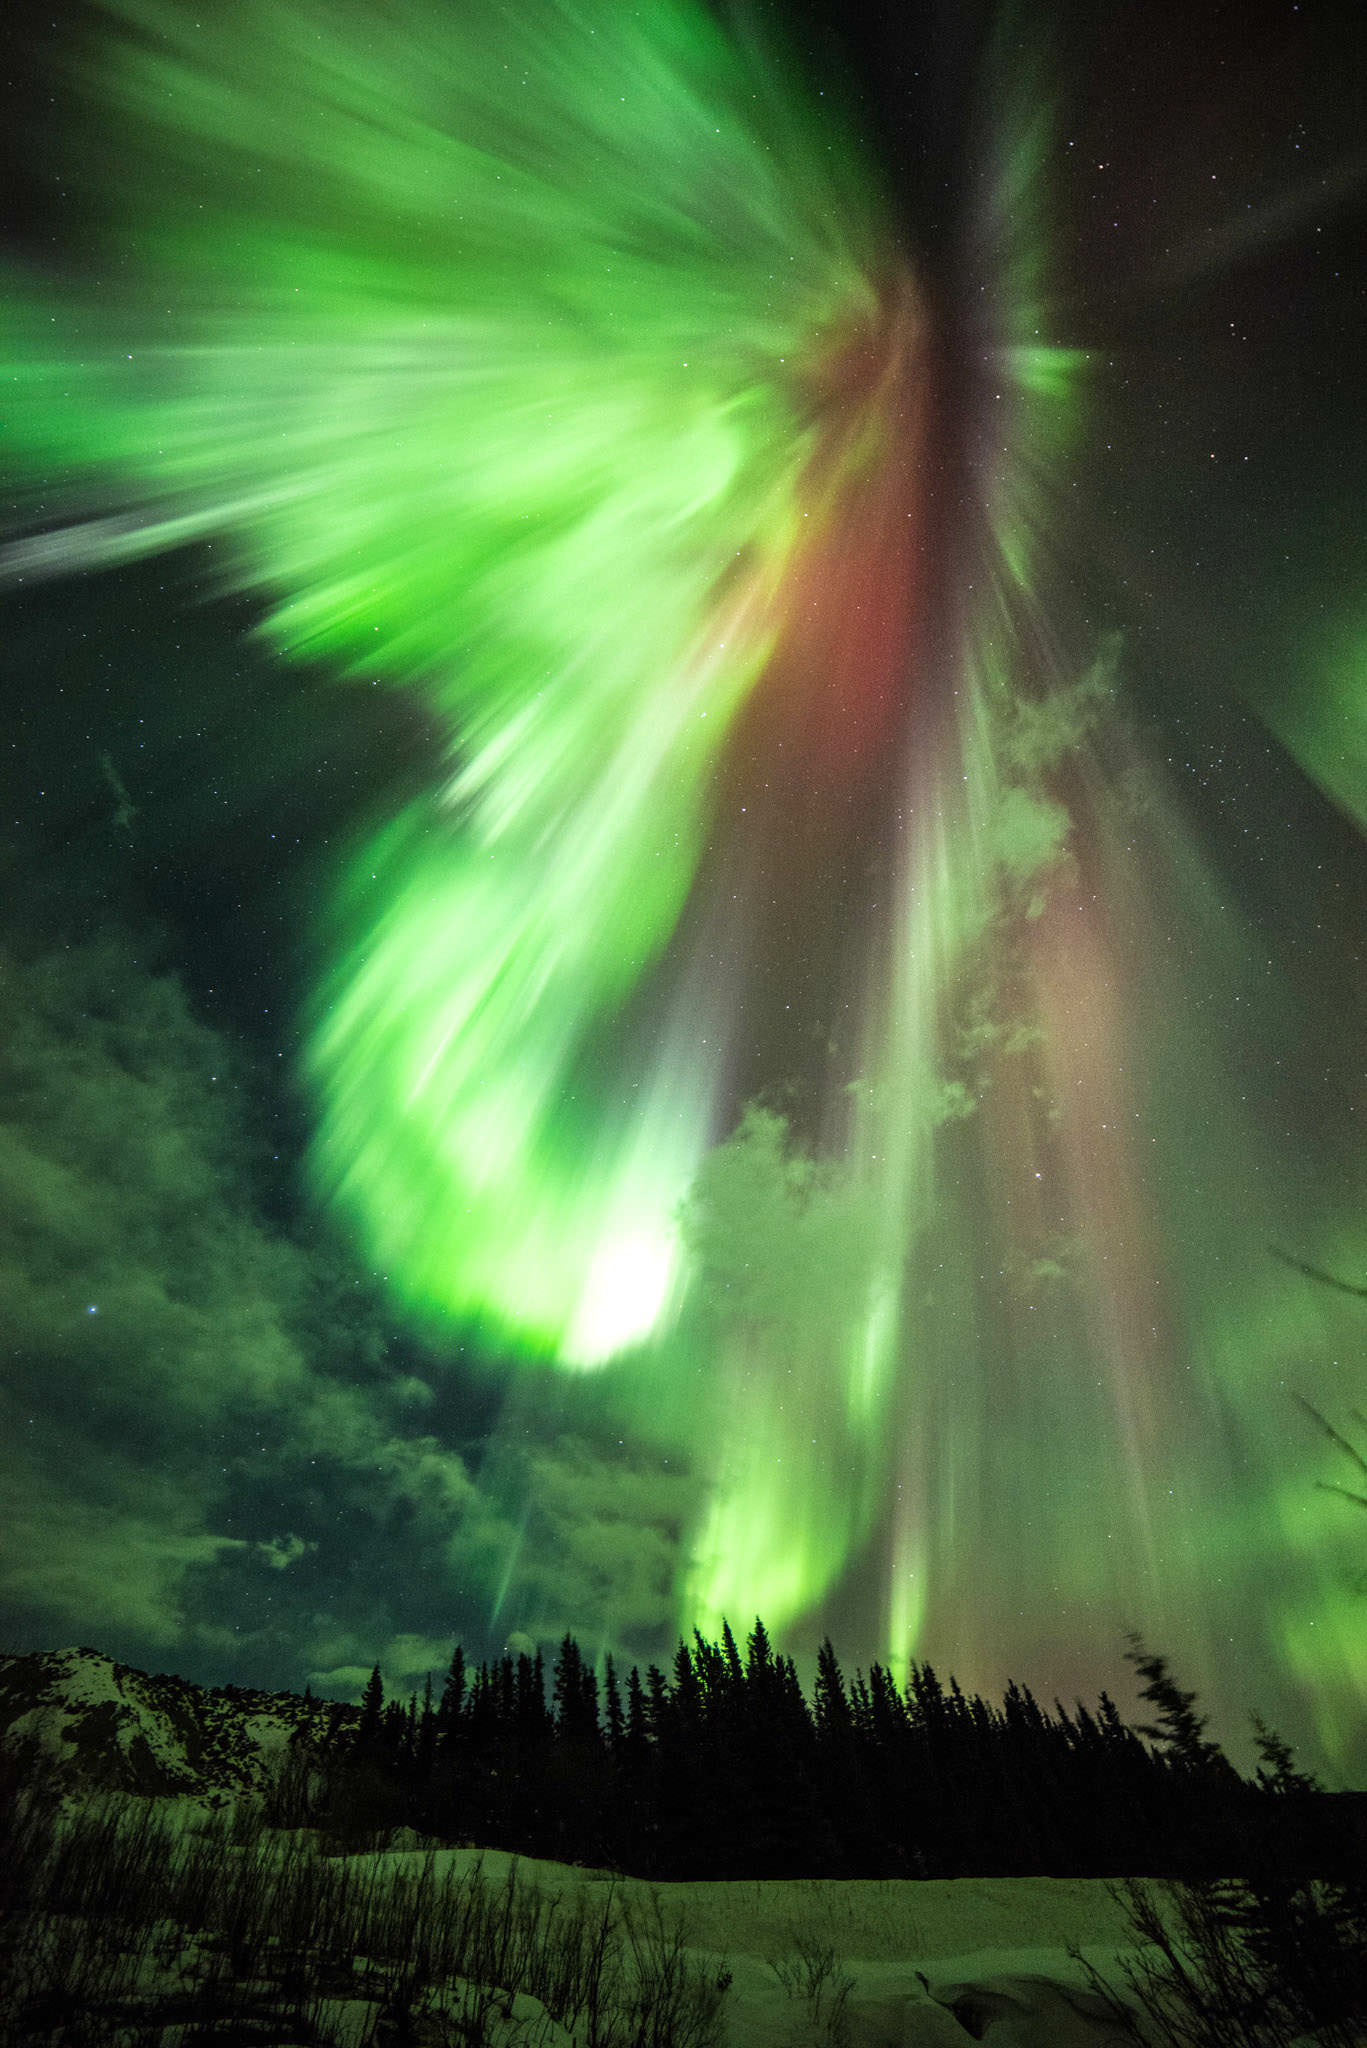
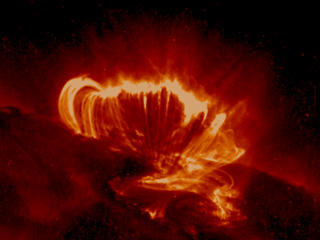
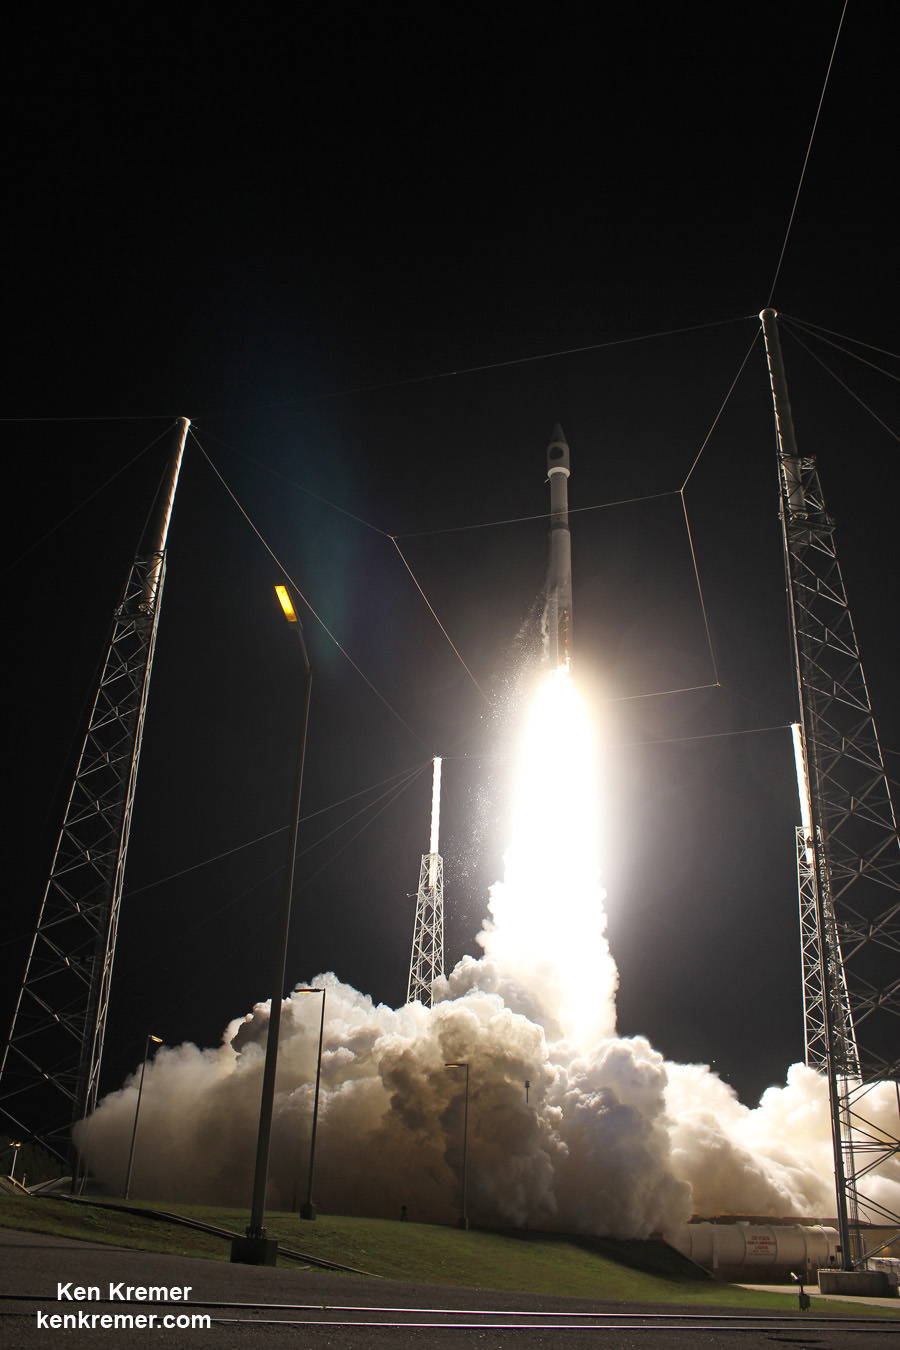

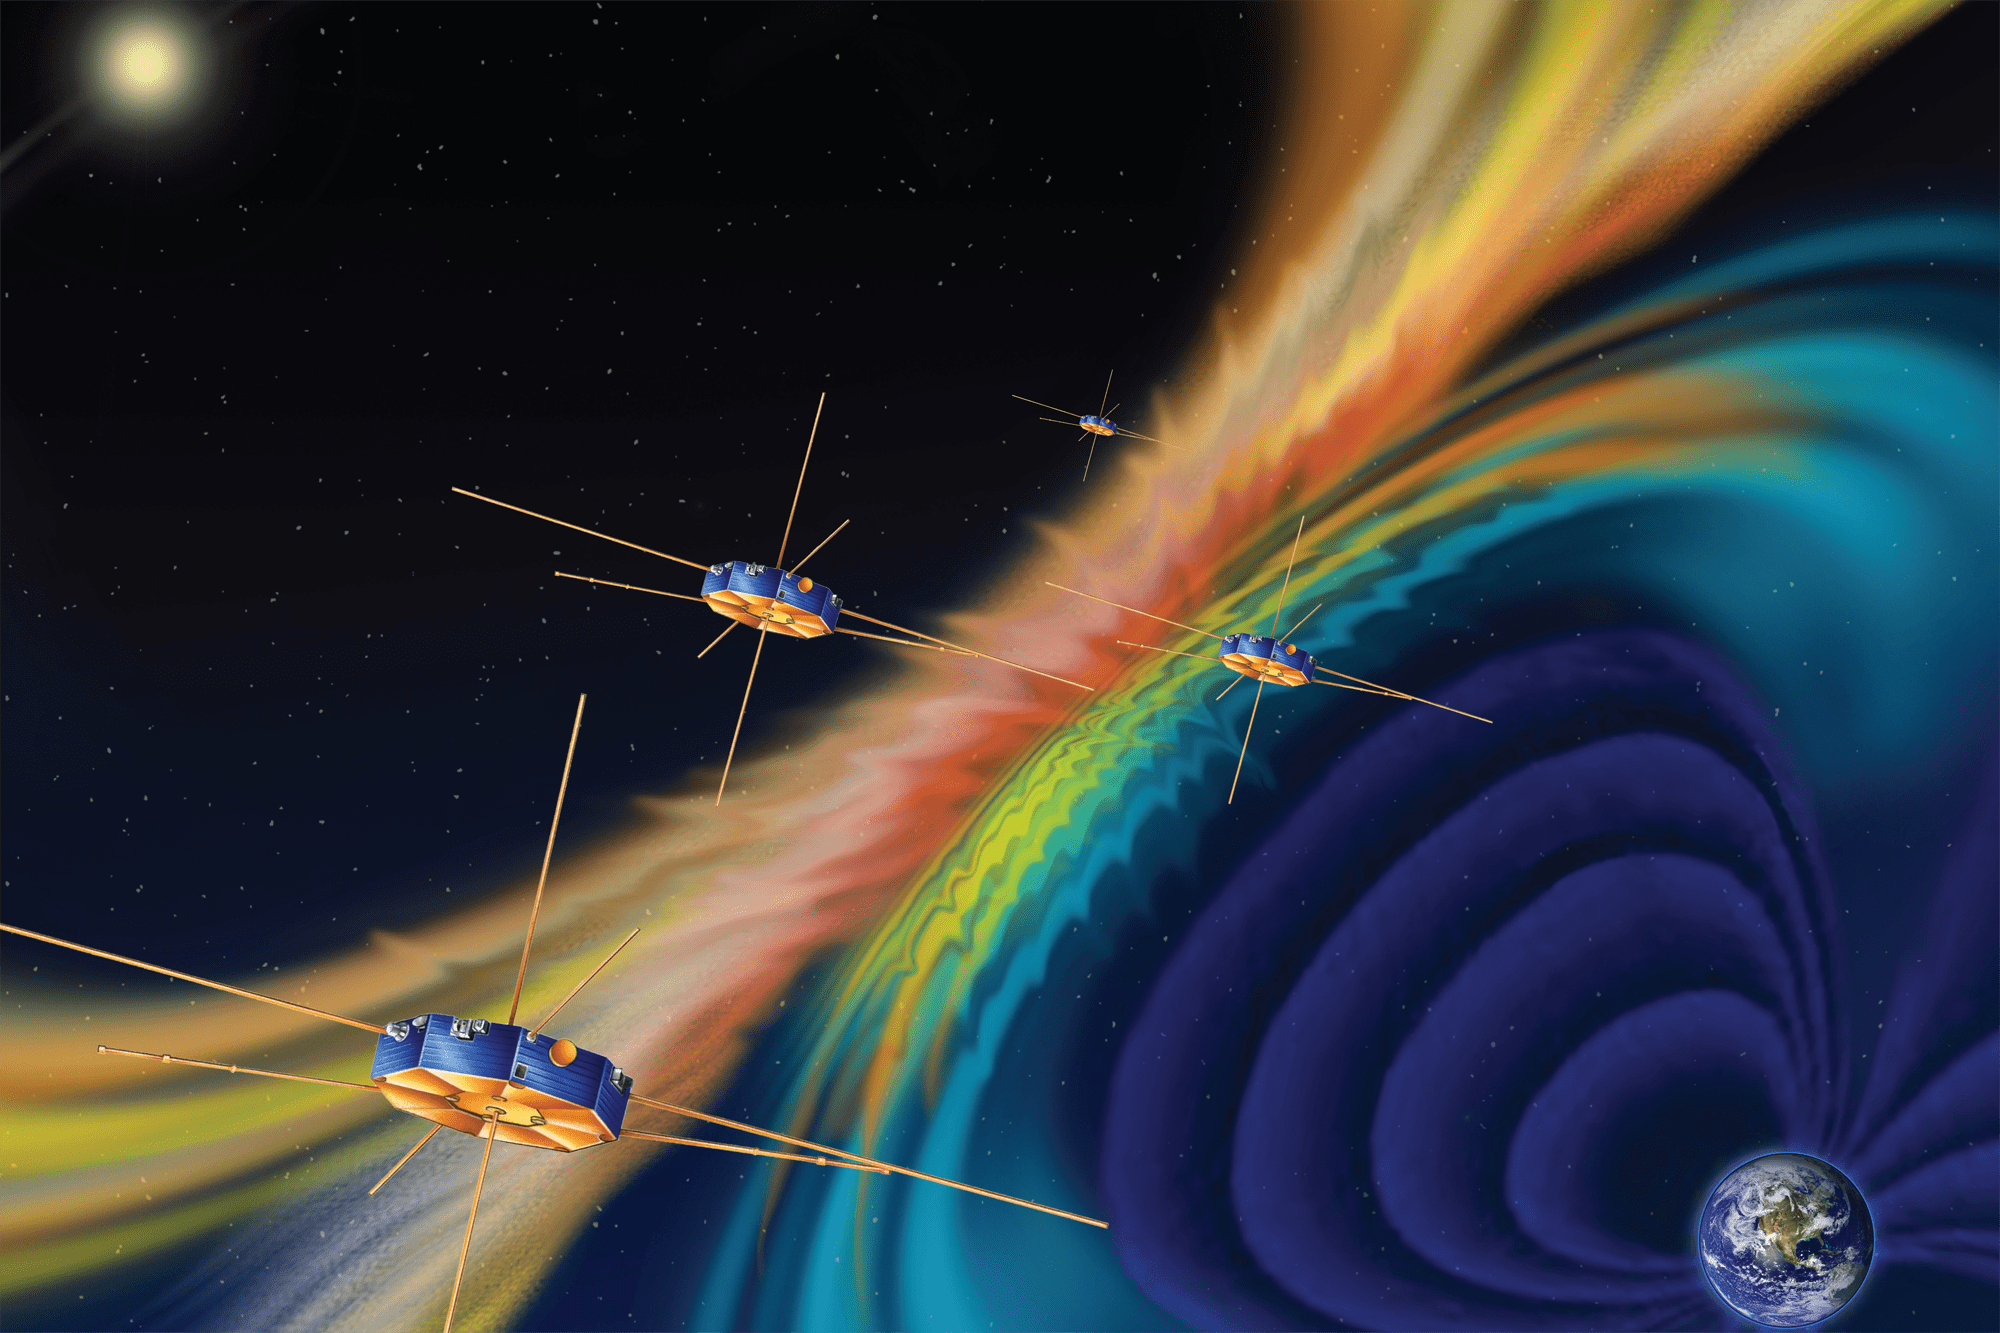
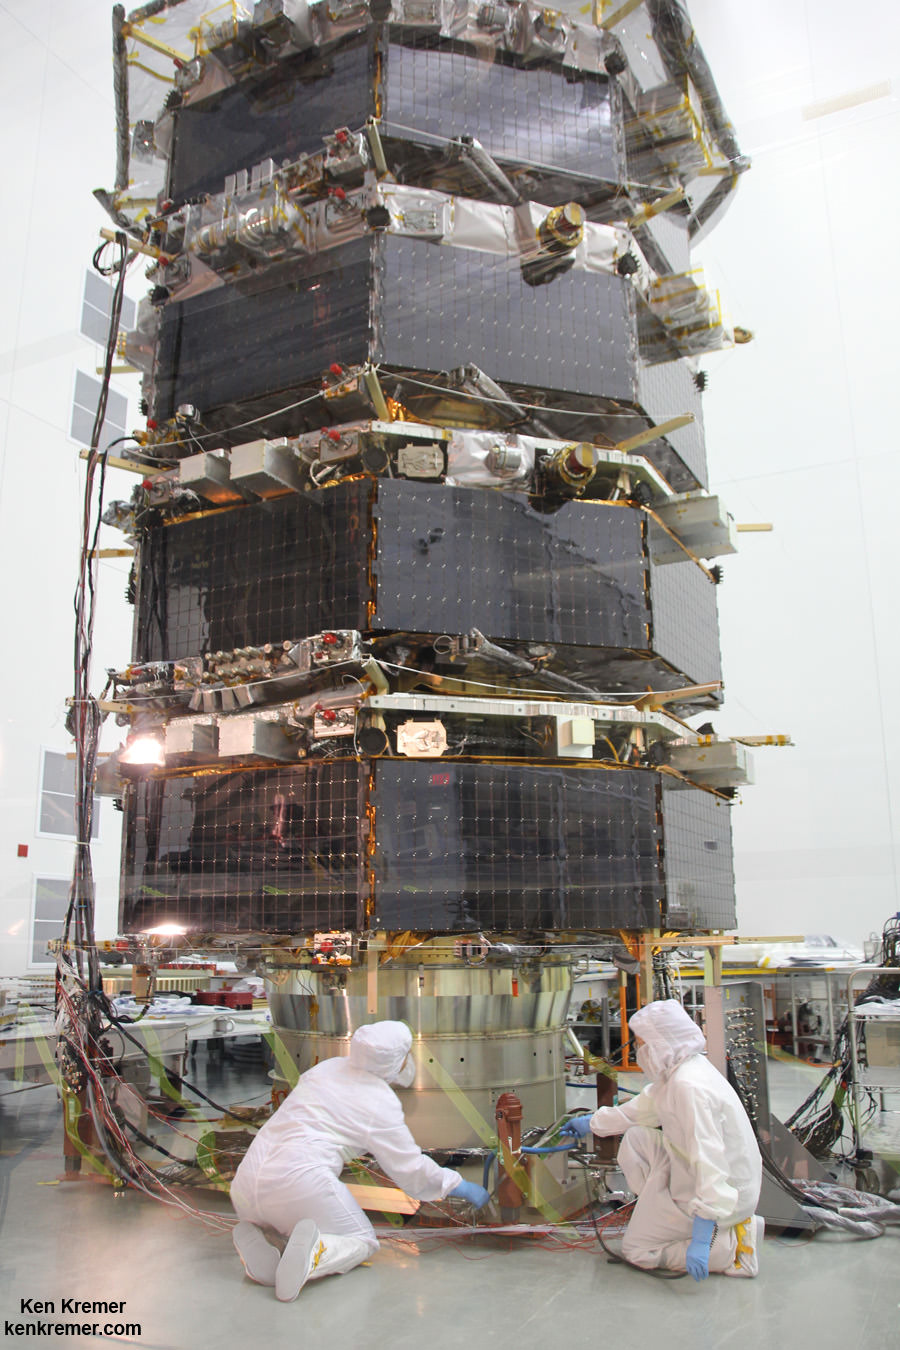

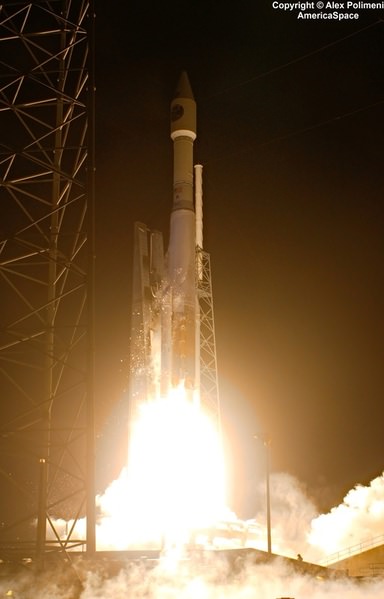
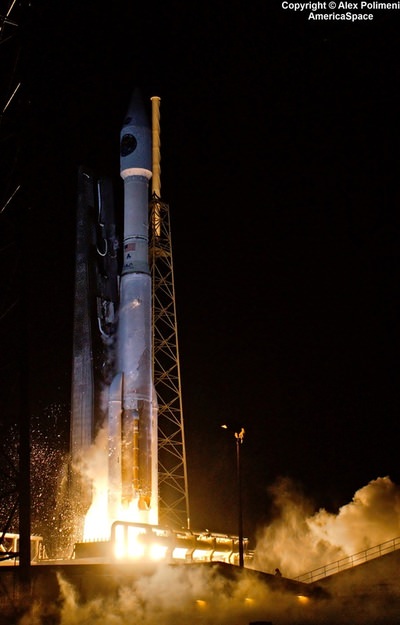
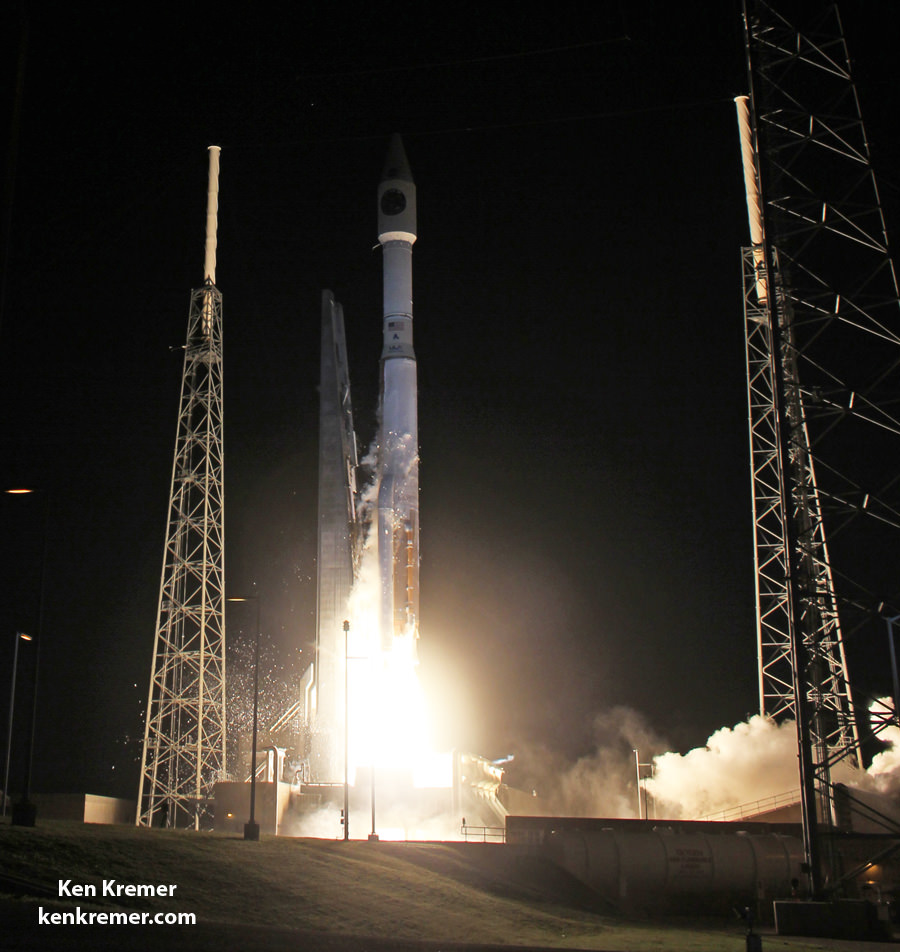
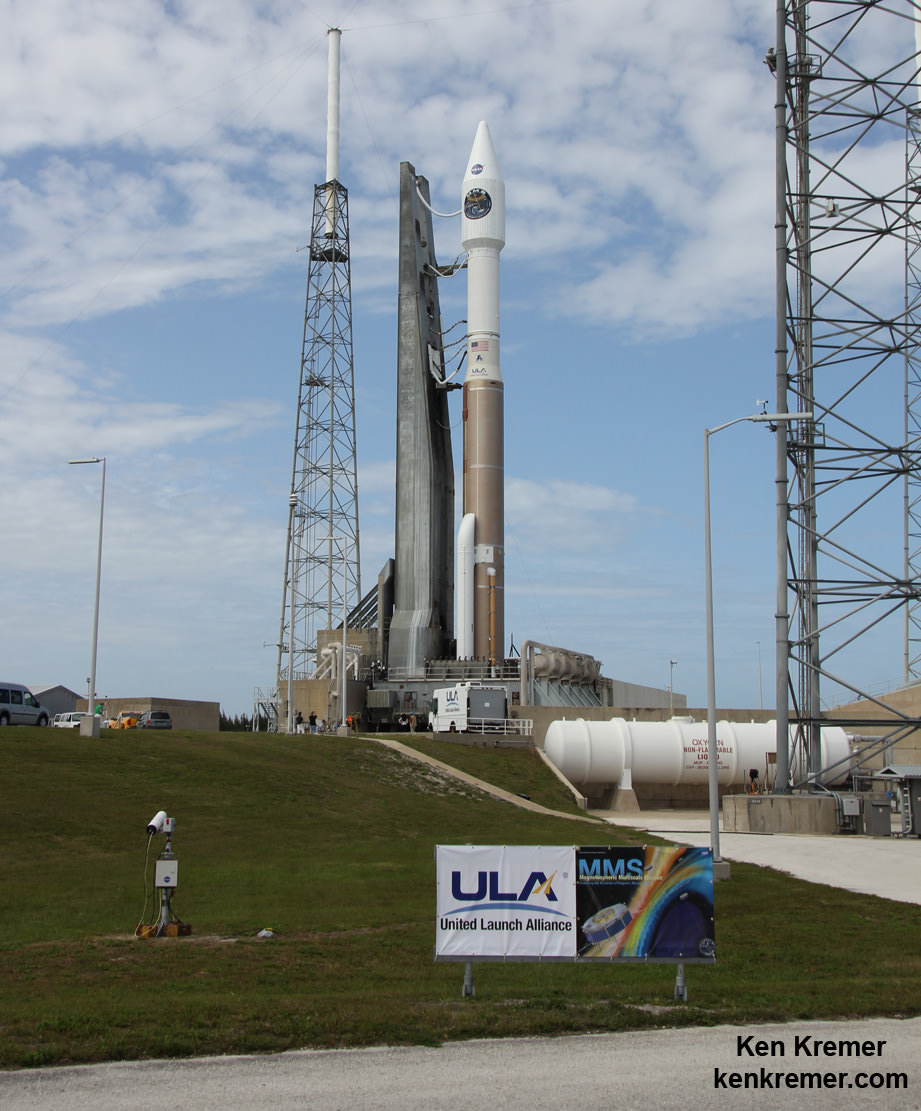

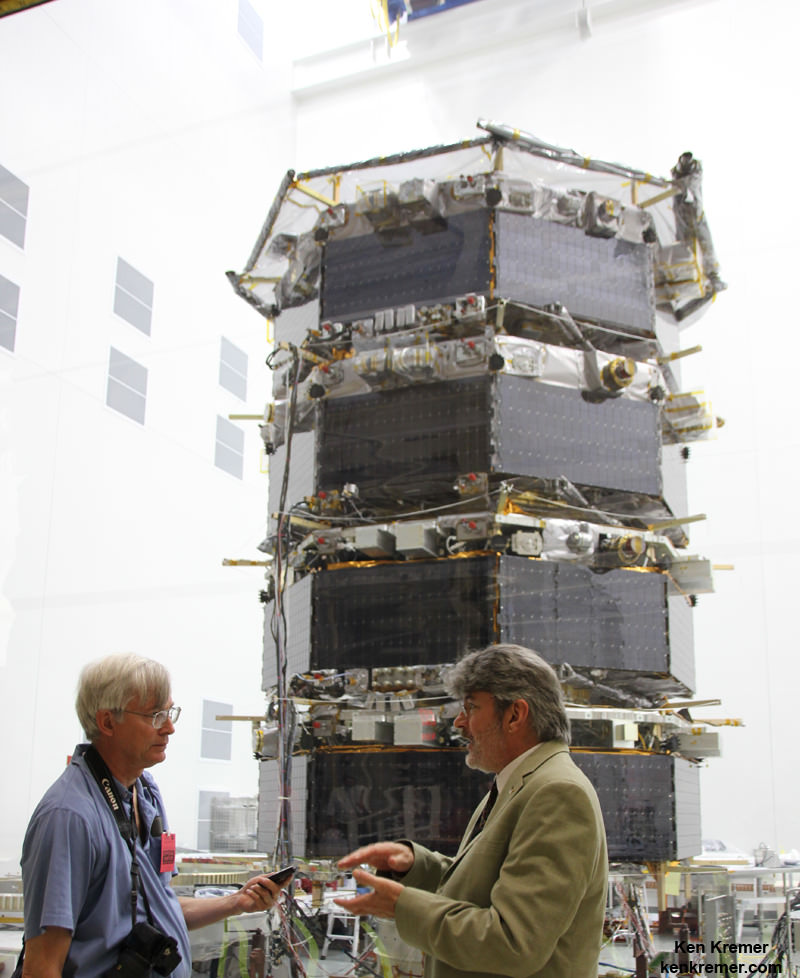