New Research Finds Venus’ Winds, They Are A-Changin’

Image of Venus in ultraviolet light by ESA's Venus Express.


[/caption]

Venus, Earth’s hotheaded neighbor, may have more variability in its weather patterns than previously believed. Using infrared data obtained by ground-based telescopes in Hawaii and Arizona researchers have found that Venus’ mesosphere and thermosphere are less consistent in temperature than layers closer to its surface.

But first let’s talk about Venus itself.

Possibly the most inhospitable of planets in our solar system, Venus is the victim of a runaway greenhouse effect. Our neighboring world is a virtual oven… with a rocky surface baked by 800ºF temperatures and crushed beneath the weight of its own incredibly dense atmosphere, standing “sea level” on Venus would be like being 3,300 feet underwater, just in terms of pressure per square inch. And as if the heat and pressure weren’t enough, Venus’ skies are full of clouds made of corrosive sulphuric acid, lit by bolts of lightning and and whipped along by hurricane-force planetwide winds. All Earth-based probes that have ever landed there only lasted moments on the surface before succumbing to Venus’ destructive environment.

Venus is, quite literally, hellish.

Venus' south polar vortex imaged in infrared. A darker region corresponds to higher temperature and thus lower altitude. Credit: ESA/VIRTIS/INAF-IASF/Obs. de Paris-LESIA.

Unlike Earth, Venus does not have much of an axial tilt. This means there’s little, if any, seasonal variation on Venus. (Actually it does have a tilt… Venus is rotated almost completely upside-down relative to its poles, and so in effect still has very little axial tilt.) And since its cloud cover is so dense and it lacks a hydrologic cycle to move heat energy around, it pretty much stays at a constant level of “extreme broil” all across Venus’ surface.

Surface weather on Venus, although unpleasant, is consistent.

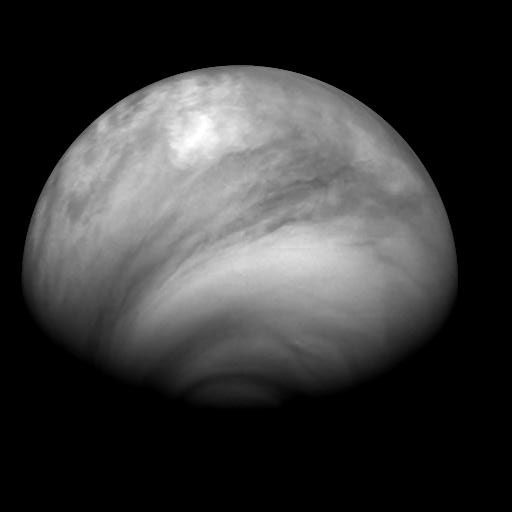
Yet based on an international team’s new research this is not the case higher up in Venus’ atmosphere. A new look at old data has uncovered changing weather patterns visible in infrared light at about 68 miles (110 kilometers) above the planet’s surface in the cold, clear air above the acid clouds.

“Any variability in the weather on Venus is noteworthy, because the planet has so many features to keep atmospheric conditions the same,” said Dr. Tim Livengood, a researcher with the National Center for Earth and Space Science Education and the University of Maryland, now stationed at NASA’s Goddard Space Flight Center in Greenbelt.

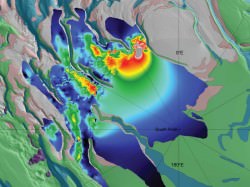
Dr. Theodor Kostiuk of NASA Goddard explains further: “Although the air over the polar regions in these upper atmospheric layers on Venus was colder than the air over the equator in most measurements, occasionally it appeared to be warmer. In Earth’s atmosphere, a circulation pattern called a ‘Hadley cell’ occurs when warm air rises over the equator and flows toward the poles, where it cools and sinks. Since the atmosphere is denser closer to the surface, the descending air gets compressed and warms the upper atmosphere over Earth’s poles. We saw the opposite on Venus.”

Many factors could be contributing to Venus’ upper-atmospheric variabilities, such as interactions between opposing winds blowing around the planet at over 200 mph, giant vortexes that churn around its poles, and possibly even solar activity, like solar storms and coronal mass ejections which may create turbulence in Venus’ upper atmosphere.

“The mesosphere and thermosphere of Venus are dynamically active. Wind patterns resulting from solar heating and east to west zonal winds compete, possibly resulting in altered local temperatures and their variability over time.”

– Lead author Dr. Guido Sonnabend, University of Cologne, Germany

Artist concept of Venus' surface. (NASA)

The team also found that the temperatures of Venus’ atmosphere change over time, spanning weeks, months, years… even decades. Temperatures measured in 1990-91 are warmer than in 2009, and equatorial temperatures were even warmer in 2007.

“In addition to all these changes, we saw warmer temperatures than those predicted for this altitude by the leading accepted model,” said Kostiuk. “This tells us that we have lots of work to do updating our upper atmospheric circulation model for Venus.”

Even though Venus is compositionally similar to Earth and has a similar size as well, at some point in its history it lost all of its water to space and became the cloud-covered oven it is today. Studying Venus will help scientists learn how this may have happened and – hopefully! –  learn how to prevent the same fate from ever befalling Earth.

The paper, led by Dr. Guido Sonnabend of the University of Cologne, Germany and co-authored by Drs. Livengood and Kostiuk, appeared July 23 in the online edition of the journal Icarus.

Read more on the NASA feature article here.

Mars’ Underground Atmosphere

Pitted "swiss cheese" terrain at Mars' south pole hints at sublimation of underground CO2

[/caption]

Scientists have spotted an underground reservoir near Mars’ south pole the size of Lake Superior… except that this lake is filled with frozen carbon dioxide – a.k.a. “dry ice”!

A recent report by scientists at the Southwest Research Institute in Boulder, CO reveals variations in Mars’ axial tilt can change how much carbon dioxide gets released into the atmosphere, affecting factors from the stability of water on its surface to the power and frequency of dust storms.

Thickness Map of Buried CO2 Ice Deposit

The Mars Reconnaissance Orbiter’s ground-penetrating Shallow Radar identified a subsurface deposit of frozen material, confirmed as carbon dioxide ice by its radar signature and visual correlation to the surface pitting seen above. As the polar surface warms during the Martian spring, underground CO2 deposits evaporate (or “sublime”) leaving behind round depressions in the frozen ground. (This has been aptly dubbed “swiss cheese terrain” by researchers on the HiRISE imaging team.)

While scientists were aware of seasonal CO2 ice layers atop the water ice this new discovery brings to light nearly 30 times more frozen CO2 than was previously believed to exist. In fact this particular deposit alone contains 80% the amount of CO2 currently present in the planet’s entire atmosphere.

The importance of this finding is how the carbon dioxide ultimately affects the global Martian climate as it freezes and thaws. When the CO2 is frozen and locked away in subsurface deposits like this, it’s not free to enter the atmosphere and do what CO2 does best: warm the planet… as well as increase atmospheric pressure. This means that liquid water cannot last as readily on the surface since it will either freeze or boil away. Also with less air pressure the strength of wind is decreased, so dust storms are less frequent and less severe.

When factored in with the axial tilt difference – and thus variations in the amount of sunlight hitting the poles – researchers’ models show that Mars’ average atmospheric pressure may at times be 75% higher than it is today.

These shifts in the orientation of the Red Planet’s axis occur on 100,000-year intervals… long by human standards but geologically very frequent. Mars may have had liquid water existing on its surface fairly recently!

Mars' south polar ice cap, seen in April 2000 by Mars Odyssey. NASA/JPL/MSSS

Although this may sound that Mars has had its own share of global warming due to CO2 emissions in its history, it must be remembered that Mars and Earth have very different atmospheric compositions. Earth’s atmosphere is much thicker and denser than Mars’, so even when doubling its CO2 content Mars’ atmosphere is still too thin and dry to create a strong greenhouse effect… especially considering that the polar caps on Mars increase cooling more than additional CO2 in the atmosphere raises global temperature. Without oceans and atmosphere to collect and distribute heat, the effect of any warming quickly radiates out into space…and eventually the planet swings back into a freeze-dried state.

“Unlike Earth, which has a thick, moist atmosphere that produces a strong greenhouse effect, Mars’ atmosphere is too thin and dry to produce as strong a greenhouse effect as Earth’s, even when you double its carbon-dioxide content.”

– Robert Haberle, planetary scientist at NASA’s Ames Research Center

Read the full news release on the NASA Missions site.

Image credit: NASA / JPL / University of Arizona


What is an Enhanced Greenhouse Effect?

Enhanced Greenhouse Effect
Greenhouse Effect vs. Enhanced Greenhouse Effect. Image Credit: environment.act.gov.au

Every day, solar radiation reaches the surface of our planet from the sun. It is then converted into thermal radiation which is then absorbed by atmospheric greenhouse gases (such as carbon dioxide) and is re-radiated in all directions. Known as the Greenhouse Effect, this process is essential to life as we know it. Without it, Earth’s surface temperature would be significantly lower and many life forms would cease to exist. However, where human agency is involved, this effect has been shown to have a downside. Indeed, when excess amounts of greenhouse gases are put into the atmosphere, this natural warming effect is boosted to the point where it can have damaging, even disastrous consequences for life here on Earth. This process is known as the Enhanced Greenhouse Effect, where the natural process of warming caused by solar radiation and greenhouse gases is heightened by anthropogenic (i.e. human) factors.

The effect of CO2 and other greenhouse gases on the global climate was first publicized in 1896 by Swedish scientist Svante Arrhenius. It was he that first developed a theory to explain the ice ages, as well as the first scientist to speculate that changes in the levels of carbon dioxide in the atmosphere could substantially alter the surface temperature of the Earth. This was expanded upon in the mid-20th century by Guy Stewart Callendar, an English steam engineer and inventor who was also interested in the link between increased CO2 levels in the atmosphere and rising global temperatures. Thanks to his research in the field, the link between the two came to be known for a time as the “Callendar effect”.
As the 20th century rolled on, a scientific consensus emerged that recognized this phenomenon as a reality and increasingly urgent problem. Relying on ice core data, atmospheric surveys performed by NASA, the Mauna Loa observatory and countless other research institutes all over the planet, scientists now believe there is a direct link between human agency and the rise in global mean temperatures over the fifty and even two-hundred years. This is due largely to increased production of CO2 through fossil fuel burning and other activities such as cement production and tropical deforestation. In addition, methane production has also been successfully linked to an increase in global temperatures, which is the result of growing consumption of meat and the need to clear large areas of tropical rainforests in order to make room for pasture land.

According to the latest Assessment Report from the Intergovernmental Panel on Climate Change which was released in 2007, “most of the observed increase in globally averaged temperatures since the mid-20th century is very likely due to the observed increase in anthropogenic greenhouse gas concentrations”. If left unchecked, it is unclear what the exact consequences would be, but most scenarios predict a steep drop in worldwide food production, widespread drought, glacial depletion, the near to total depletion of the polar ice cap, and the possibility that the process could become irreversible.
Getting toasty in here!

We have written many articles about enhanced greenhouse effect for Universe Today. Here’s an article about greenhouse effect, and here’s an article about atmospheric gases.

If you’d like more info on Enhanced Greenhouse Effect, check out these articles from USA Today and Earth Observatory.

We’ve also recorded an episode of Astronomy Cast all about planet Earth. Listen here, Episode 51: Earth.

Sources:
http://en.wikipedia.org/wiki/Greenhouse_effect
http://www.science.org.au/nova/016/016key.htm
http://en.wikipedia.org/wiki/Radiative_forcing
http://en.wikipedia.org/wiki/Svante_Arrhenius
http://en.wikipedia.org/wiki/Callendar_effect
http://en.wikipedia.org/wiki/History_of_climate_change_science