Could Space Travelers Melt As They Accelerate Through Deep Space?

Artist Mark Rademaker's concept for the IXS Enterprise, a theoretical interstellar spacecraft. Credit: Mark Rademaker/flickr.com

Forty years ago, Canadian physicist Bill Unruh made a surprising prediction regarding quantum field theory. Known as the Unruh effect, his theory predicted that an accelerating observer would be bathed in blackbody radiation, whereas an inertial observer would be exposed to none. What better way to mark the 40th anniversary of this theory than to consider how it could affect human beings attempting relativistic space travel?

Such was the intent behind a new study by a team of researchers from Sao Paulo, Brazil. In essence, they consider how the Unruh effect could be confirmed using a simple experiment that relies on existing technology. Not only would this experiment prove once and for all if the Unruh effect is real, it could also help us plan for the day when interstellar travel becomes a reality.

To put it in layman’s terms, Einstein’s Theory of Relativity states that time and space are dependent upon the inertial reference frame of the observer. Consistent with this is the theory that if an observer is traveling at a constant speed through empty vacuum, they will find that the temperature of said vacuum is absolute zero. But if they were to begin to accelerate, the temperature of the empty space would become hotter.

According to the theory of the Unruh effect, accelerating particles are subject to increased radiation. Credit: NASA/Sonoma State University/Aurore Simonnet

This is what William Unruh – a theorist from the University of British Columbia (UBC), Vancouver – asserted in 1976. According to his theory, an observer accelerating through space would be subject to a “thermal bath” – i.e. photons and other particles – which would intensify the more they accelerated. Unfortunately, no one has ever been able to measure this effect, since no spacecraft exists that can achieve the kind of speeds necessary.

For the sake of their study – which was recently published in the journal Physical Review Letters under the title “Virtual observation of the Unruh effect” – the research team proposed a simple experiment to test for the Unruh effect. Led by Gabriel Cozzella of the Institute of Theoretical Physics (IFT) at Sao Paulo State University, they claim that this experiment would settle the issue by measuring an already-understood electromagnetic phenomenon.

Essentially, they argue that it would be possible to detect the Unruh effect by measuring what is known as Larmor radiation. This refers to the electromagnetic energy that is radiated away from charged particles (such as electrons, protons or ions) when they accelerate. As they state in their study:

“A more promising strategy consists of seeking for fingerprints of the Unruh effect in the radiation emitted by accelerated charges. Accelerated charges should back react due to radiation emission, quivering accordingly. Such a quivering would be naturally interpreted by Rindler observers as a consequence of the charge interaction with the photons of the Unruh thermal bath.”

Diagram of the experiment to test the Unruh effect, where electrons are injected into a magnetic field and subjected to lateral and vertical pulls. Credit: Cozzella, Gabriel (et al.)

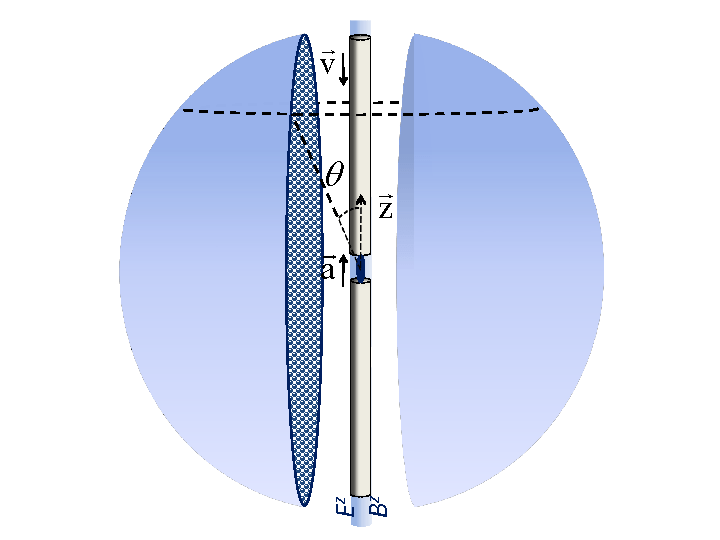
As they describe in their paper, this would consist of monitoring the light emitted by electrons within two separate reference frames. In the first, known as the “accelerating frame”, electrons are fired laterally across a magnetic field, which would cause the electrons to move in a circular pattern. In the second, the “laboratory frame”, a vertical field is applied to accelerate the electrons upwards, causing them to follow a corkscrew-like path.

In the accelerating frame, Cozzella and his colleagues assume that the electrons would encounter the “fog of photons”, where they both radiate and emit them. In the laboratory frame, the electrons would heat up once vertical acceleration was applied, causing them to show an excess of long-wavelength photons. However, this would be dependent on the “fog” existing in the accelerated frame to begin with.

In short, this experiment offers a simple test which could determine whether or not the Unruh effect exists, which is something that has been in dispute ever since it was proposed. One of the beauties of the proposed experiment is that it could be conducted using particle accelerators and electromagnets that are currently available.

On the other side of the debate are those who claim that the Unruh effect is due to a mathematical error made by Unruh and his colleagues. For those individuals, this experiment is useful because it would effectively debunk this theory. Regardless, Cozzella and his team are confident their proposed experiment will yield positive results.

Project Starshot, an initiative sponsored by the Breakthrough Foundation, is intended to be humanity’s first interstellar voyage. Credit: breakthroughinitiatives.org

“We have proposed a simple experiment where the presence of the Unruh thermal bath is codified in the Larmor radiation emitted from an accelerated charge,” they state. “Then, we carried out a straightforward classical-electrodynamics calculation (checked by a quantum-field-theory one) to confirm it by ourselves. Unless one challenges classical electrodynamics, our results must be virtually considered as an observation of the Unruh effect.”

If the experiments should prove successful, and the Unruh effect is proven to exist, it would certainly have consequences for any future deep-space missions that rely on advanced propulsion systems. Between Project Starshot, and any proposed mission that would involve sending a crew to another star system, the added effects of a “fog of photons” and a “thermal bath” will need to be factored in.

Further Reading: arXiv, ScienceMag

What is the Mid-Atlantic Ridge?

The age of the oceanic crust - red is most recent, and blue is the oldest - which corresponds to the location of mid-ocean ridges. Credit: NCEI/NOAA

If you took geology in high school, then chances are you remember learning something about how the Earth’s crust – the outermost layer of Earth – is arranged into a series of tectonic plates. These plates float on top of the Earth’s mantle, the semi-viscous layer that surrounds the core, and are in constant motion because of convection in the mantle. Where two plates meet, you have what it is known as a boundary.

These can be “divergent” or “convergent”, depending on whether the plates are moving apart or coming together. Where they diverge, hot magma can rise from below, creating features like long ridges or mountain chains. Interestingly enough, this is how one of the world’s largest geological features was formed. It called the Mid-Atlantic Ridge, which run from north to south along the ocean floor in the Atlantic.

Description:

The Mid-Atlantic Ridge (MAR) is known as a mid-ocean ridge, an underwater mountain system formed by plate tectonics. It is the result of a divergent plate boundary that runs from 87° N – about 333 km (207 mi) south of the North Pole – to 54 °S, just north of the coast of Antarctica.

Transform Plate Boundary
The different types of Tectonic Plate Boundaries, ranging from convergent and transform to divergent. Credit: USGS/Jose F. Vigil

Like other ocean ridge systems, the MAR developed as a consequence of the divergent motion between the Eurasian and North American, and African and South American Plates. In the North Atlantic, it separates the Eurasian and North American Plates; whereas in the South Atlantic, it separates the African and South American Plates.

The MAR is approximately 16,000 km (10,000 mi) long and between 1,000 and is 1,500 km (620 and 932 mi) wide. The peaks of the ridge stand about 3 km (1.86 mi) in height above the ocean floor, and sometimes reach above sea level, forming islands and island groups. The MAR is also part of the longest mountain chain in the world, extending continuously across the oceans floors for a total distance of 40,389 km (25,097 mi).

The MAR also has a deep rift valley at is crest which marks the location where the two plates are moving apart. This rift valley runs along the axis of the ridge for nearly its entire length, measuring some 80 to 120 km (50 to 75 miles) wide. The rift marks the actual boundary between adjacent tectonic plates, and is where magma from the mantle reaches the seafloor.

Where this magma is able to reach the surface, the result is basaltic volcanoes and islands. Where it is still submerged, it produces “pillow lava”. As the plates move further apart, new ocean lithosphere is formed at the ridge and the ocean basin gets wider. This process, known as “sea floor spreading”, is happening at an average rate of about 2.5 cm per year (1 inch).

The Earth’s Tectonic Plates, with convergent and divergent boundaries indicated with red arrows. Credit: msnucleus.org

In other words, North America and Europe are moving away from each other at a very slow rate. This process also means that the basaltic rock that makes up the ridge is younger than the surrounding crust.

Notable Features:

As noted, the ridge (while mainly underwater) does have islands and island groups that were created by volcanic activity. In the Northern Hemisphere, these include Jan Mayen Island and Iceland (Norway), and the Azores (Portugal). In the Southern Hemisphere, MAR features include Ascension Island, St. Helena, Tristan da Cunha, Gough Island (all UK territories) and Bouvet Island (Norway).

Near the equator, the Romanche Trench divides the North Atlantic Ridge from the South Atlantic Ridge. This narrow submarine trench has a maximum depth of 7,758 m (25,453 ft), one of the deepest locations of the Atlantic Ocean. This trench, however, is not regarded an official boundary between any of the tectonic plates.

History of Exploration:

The ridge was initially discovered in 1872 during the expedition of the HMS Challenger. In the course of investigating the Atlantic for the sake of laying the transatlantic telegraph cable, the crew discovered a large rise in the middle of the ocean floor. By 1925, its existence was confirmed thanks to the invention of sonar.

The super-continent Pangaea during the Permian period (300 – 250 million years ago). Credit: NAU Geology/Ron Blakey

By the 1960s, scientists were able to map the Earth’s ocean floors, which revealed a seismically-active central valley, as well as a network of valleys and ridges. They also discovered that the ridge was part of a continuous system of mid-ocean ridges that extended across the entire ocean floor, connecting all the divergent boundaries around the planet.

This discovery also led to new theories in terms of geology and planetary evolution. For instance, the theory of “seafloor spreading” was attributed to the discovery of the MAR, as was the acceptance of continental drift and plate tectonics. In addition, it also led to the theory that all the continents were once part of subcontinent known as “Pangaea”, which broke apart roughly 180 million years ago.

Much like the “Pacific Ring of Fire“, the discovery of the Mid-Atlantic Ridge has helped inform our modern understanding of the world. Similar to convergent boundaries, subduction zones and other geological forces, the process that created it is also responsible for the world as we know it today.

Basically, it is responsible for the fact that the Americas have been drifting away from Africa and Eurasia for millions of years, the formation of Australia, and the collision between the India Subcontinent and Asia. Someday – millions of years from now – the process of seafloor spreading will cause the Americas and Asia to collide, thus forming a new super continent – “Amasia”.

We have written many interesting articles about Earth here at Universe Today. Here’s 10 Interesting Facts About Earth, What are Plate Boundaries?, What are Divergent Boundaries?, Mountains: How are they Formed?, What is a Subduction Zone?, What is an Earthquake?, What is the Pacific Ring of Fire?, and How Many Continents are There?

For more information, check out the Geological Society’s page on the Mid-Atlantic Ridge.

Astronomy Cast also has episodes that are relevant to the subject. Here’s Episode 51: Earth and Episode 293: Earthquakes.

Sources:

Who Discovered Uranus?

Uranus as seen by NASA's Voyager 2. Credit: NASA/JPL

If you’ve got really good eyesight and can find a place where the light pollution is non-existent, you might be able to see Uranus without a telescope. It’s only possible with the right conditions, and if you know exactly where to look. And for thousands of years, scholars and astronomers were doing just that. But given that it was just a tiny pinprick of light, they believed Uranus was a star.

It was not until the late 18th century that the first recorded observation that recognized Uranus as being a planet took place. This occurred on March 13th, 1781, when British astronomer Sir William Herschel observed the planet using a telescope of his own creation. From this point onwards, Uranus would be recognized as the seventh planet and the third gas giant of the Solar System.

Observations pre-18th Century:

The first recorded instance of Uranus being spotted in the night sky is believed to date back to Classical Antiquity.  During the 2nd century BCE, Hipparchos – the Greek astronomer, mathematician and founder of trigonometry – apparently recorded the planet as a star in his star catalogue (completed in 129 BCE).

William Herschel’s telescope, through which the planet Uranus was first observed. Credit: Wikipedia Commons

This catalog was later incorporated into Ptolemy’s Almagest, which became the definitive source for Islamic astronomers and for scholars in Medieval Europe for over one-thousand years. During the 17th and 18th centuries, multiple recorded sightings were made by astronomers who also catalogued it as being a star.

This included English astronomer John Flamsteed, who in 1690 observed the star on six occasions and catalogued it as a star in the Taurus constellation (34 Tauri). During the mid-18th century, French astronomer Pierre Lemonnier made twelve recorded sightings, and also recorded it as being a star. It was not until March 13th, 1781, when William Herschel observed it from his garden house in Bath, that Uranus’ true nature began to be revealed.

Hershel’s Discovery:

On the evening in question –  March 13th, 1781 – William Herschel was surveying the sky with his telescope, looking for binary stars. His first report on the object was recorded on April 26th, 1781. Initially, he described it as being a “Nebulous star or perhaps a comet”, but later settled on it being a comet since it appeared to have changed its position in the sky.

Portrait of Sir William Herschel, by Lewis Francis Abbot (1784). Credit: Wikipedia Commons/National Portrait Gallery

When he presented his discovery to the Royal Society, he maintained this theory, but also likened it to a planet. As was recorded in the Journal of the Royal Society and Royal Astronomical Society on the occasion of his presentation:

“The power I had on when I first saw the comet was 227. From experience I know that the diameters of the fixed stars are not proportionally magnified with higher powers, as planets are; therefore I now put the powers at 460 and 932, and found that the diameter of the comet increased in proportion to the power, as it ought to be, on the supposition of its not being a fixed star, while the diameters of the stars to which I compared it were not increased in the same ratio. Moreover, the comet being magnified much beyond what its light would admit of, appeared hazy and ill-defined with these great powers, while the stars preserved that lustre and distinctness which from many thousand observations I knew they would retain. The sequel has shown that my surmises were well-founded, this proving to be the Comet we have lately observed.”

While Herschel would continue to maintain that what he observed was a comet, his “discovery” stimulated debate in the astronomical community about what Uranus was. In time, astronomers like Johann Elert Bode would conclude that it was a planet, based on its nearly-circular orbit. By 1783, Herschel himself acknowledged that it was a planet to the Royal Society.

Naming:

As he lived in England, Herschel originally wanted to name Uranus after his patron, King George III. Specifically, he wanted to call it Georgium Sidus (Latin for “George’s Star”), or the Georgian Planet. Although this was a popular name in Britain, the international astronomy community didn’t think much of it, and wanted to follow the historical precedent of naming the planets after ancient Greek and Roman gods.

Large floor mosaic from a Roman villa in Sassoferrato, Italy (ca. 200–250 CE). Aion (Uranus), the god of eternity, stands above Tellus (Gaia) and her four children (the seasons). Credit: Wikipedia Commons/Bibi Saint-Poi

Consistent with this, Bode proposed the name Uranus in a 1782 treatise. The Latin form of Ouranos, Uranus was the grandfather of Zeus (Jupiter in the Roman pantheon), the father of Cronos (Saturn), and the king of the Titans in Greek mythology. As it was discovered beyond the orbits of Jupiter and Saturn, the name seemed highly appropriate.

In the following century, Neptune would be discovered, the last of the eight official planets that are currently recognized by the IAU. And by the 20th century, astronomers would discovery Pluto and other minor planets within the Kuiper Belt. The process of discovery has been ongoing, and will likely continue for some time to come.

We have written many articles about planetary discovery here at Universe Today. Here’s Who Discovered Mercury?, Who Discovered Venus?, Who Discovered Earth?, Who Discovered Mars?, Who Discovered Jupiter?, Who Discovered Saturn?, Who Discovered Neptune?, and Who Discovered Pluto?

Here’s an article from the Hubble educational site about the discovery of Uranus, and here’s the NASA Solar System Exploration page on Uranus.

We have recorded an episode of Astronomy Cast just about Uranus. You can access it here: Episode 62: Uranus.

Sources:

SS John Glenn to Debut as World’s 1st Live 360 Degree Video of Rocket Launch April 18

Fiery blastoff of a United Launch Alliance (ULA) Atlas V rocket carrying the EchoStar XIX satellite from Space Launch Complex-41 on Cape Canaveral Air Force Station, Fl., at 2:13 p.m. EST on Dec. 18, 2016. Credit: Ken Kremer/kenkremer.com

KENNEDY SPACE CENTER, FL – Imagine watching a real rocket launch in a 360 degree live video broadcast. Well NASA is about to make it happen for the first time in a big way and on a significant mission.

On Tuesday April 18, NASA will broadcast the launch of the ‘S.S. John Glenn’ space station cargo freighter in a feat marking the world’s first live 360-degree stream of a rocket launch – namely the United Launch Alliance (ULA) Atlas V rocket.

The ‘S.S. John Glenn’ is named in honor of legendary NASA astronaut John Glenn – the first American to orbit Earth back in February 1962.

The late morning daytime launch offers the perfect opportunity to debut this technology with the rocket magnificently visible atop a climbing plume of smoke and ash – and with a “pads-eye” view!

The ‘S.S. John Glenn’ is actually a Cygnus resupply spacecraft built by NASA commercial cargo provider Orbital ATK for a cargo mission heading to the International Space Station (ISS) – jam packed with nearly 4 tons or research experiments and gear for the stations Expedition 51 crew of astronauts and cosmonauts.

“NASA, in coordination with United Launch Alliance (ULA) and Orbital ATK, will broadcast the world’s first live 360-degree stream of a rocket launch,” the agency announced in a statement.

“The live 360 stream enables viewers to get a pads-eye view.”

The Cygnus spaceship will launch on a ULA Atlas V rocket from Space Launch Complex 41 at Cape Canaveral Air Force Station in Florida.

Liftoff of the S.S. John Glenn on Orbital ATK’s seventh commercial resupply services mission to the ISS – dubbed OA-7 or CRS-7 – is slated for 11:11 a.m. EDT Tuesday, April 18.

The launch window lasts 30 minutes and runs from 11;11-11:41 a.m. EDT.

You can watch the live 360 stream of the Atlas V/OA-7 cargo resupply mission liftoff to the ISS on the NASA Television YouTube channel starting 10 minutes prior to lift off at:

http://youtube.com/nasatelevision

The sunshine state’s weather outlook is currently very promising with a forecast of an 80% chance of favorable ‘GO’ conditions at launch time Tuesday morning.

John Glenn was selected as one of NASA’s original seven Mercury astronauts chosen at the dawn of the space age in 1959. He recently passed away on December 8, 2016 at age 95.

The Orbital ATK Cygnus spacecraft named for Sen. John Glenn, one of NASA’s original seven astronauts, stands inside the Payload Hazardous Servicing Facility at NASA’s Kennedy Space Center in Florida behind a sign commemorating Glenn on March 9, 2017. Launch slated for March 21 on a ULA Atlas V. Credit: Ken Kremer/Kenkremer.com

The S.S. John Glenn will carrying more than 7,600 pounds of science research, crew supplies and hardware to the orbiting outpost.

How can you watch the streaming 360 video? Read NASA’s description:

“To view in 360, use a mouse or move a personal device to look up and down, back and forth, for a 360-degree view around Space Launch Complex-41 at Cape Canaveral Air Force Station, Florida. Note: not all browsers support viewing 360 videos. YouTube supports playback of 360-degree videos on computers using Chrome, Firefox, Internet Explorer and Opera browsers. Viewers may use the YouTube app to view the launch on a smart phone. Those who own virtual reality headsets will be able to look around and experience the view as if they were actually standing on the launch pad.”

“While virtual reality and 360 technology have been increasing in popularity, live 360 technology is a brand new capability that has recently emerged. Recognizing the exciting possibilities opened by applying this new technology to spaceflight, NASA, ULA, and Orbital ATK seized this opportunity to virtually place the public at the base of the rocket during launch. Minimum viewing distance is typically miles away from the launch pad, but the live 360 stream enables viewers to get a pads-eye view.”

A ULA Atlas V rocket carrying the EchoStar 19 high speed internet satellite is poised for blastoff from Space Launch Complex-41 at Cape Canaveral Air Force Station in Florida on Dec. 18, 2016. Credit: Ken Kremer/kenkremer.com

The naming announcement for the ‘S.S. John Glenn’ was made by spacecraft builder Orbital ATK during a ceremony held inside the Kennedy Space Center (KSC) clean room facility when the cargo freighter was in the final stages of flight processing – and attended by media including Universe Today on March 9.

“It is my humble duty and our great honor to name this spacecraft the S.S. John Glenn,” said Frank DeMauro, vice president and general manager of Orbital ATK’s Advanced Programs division, during the clean room ceremony inside the Payload Hazardous Servicing Facility (PHFS) high bay at NASA’s Kennedy Space Center in Florida.

Stay tuned here for Ken’s continuing Earth and Planetary science and human spaceflight news.

Ken Kremer

………….

Learn more about the SS John Glenn/ULA Atlas V launch to ISS, NASA missions and more at Ken’s upcoming outreach events at Kennedy Space Center Quality Inn, Titusville, FL:

Apr 17-19: “SS John Glenn/ULA Atlas V launch to ISS, SpaceX SES-10, EchoStar 23, CRS-10 launch to ISS, ULA Atlas SBIRS GEO 3 launch, GOES-R weather satellite launch, OSIRIS-Rex, SpaceX and Orbital ATK missions to the ISS, Juno at Jupiter, ULA Delta 4 Heavy spy satellite, SLS, Orion, Commercial crew, Curiosity explores Mars, Pluto and more,” Kennedy Space Center Quality Inn, Titusville, FL, evenings

In this Oct. 23, 2016 image, the International Space Station’s Canadarm2 robotic arm captures Orbital ATK’s Cygnus cargo spacecraft on its sixth mission to the station. The company’s seventh cargo resupply mission is targeted for launch April 18 from NASA’s Kennedy Space Center. Credits: NASA

Dynamo At Moon’s Heart Once Powered Magnetic Field Equal To Earth’s

The #MemoriesInDNA project intends to create an archive of human knowledge which will be sent to the Moon. Credit and copyright: John Brimacombe.

When the Apollo astronauts returned to Earth, they came bearing 380.96 kilograms (839.87 lb) of Moon rocks. From the study of these samples, scientists learned a great deal about the Moon’s composition, as well as its history of formation and evolution. For example, the fact that some of these rocks were magnetized revealed that roughly 3 billion years ago, the Moon had a magnetic field.

Much like Earth, this field would have been the result of a dynamo effect in the Moon’s core. But until recently, scientists have been unable to explain how the Moon could maintain such a dynamo effect for so long. But thanks to a new study by a team of scientists from the Astromaterials Research and Exploration Science (ARES) Division at NASA’s Johnson Space Center, we might finally have a answer.

To recap, the Earth’s magnetic core is an integral part of what keeps our planet habitable. Believed to be the result of a liquid outer core that rotates in the opposite direction as the planet, this field protects the surface from much of the Sun’s radiation. It also ensures that our atmosphere is not slowly stripped away by solar wind, which is what happened with Mars.

The Moon rocks returned by the Apollo 11 astronauts. Credit: NASA

For the sake of their study, which was recently published in the journal Earth and Planetary Science Letters, the ARES team sought to determine how a molten, churning core could generate a magnetic field on the Moon. While scientists have understood how the Moon’s core could have powered such a field in the past, they have been unclear as to how it could have been maintained it for such a long time.

Towards this end, the ARES team considered multiple lines of geochemical and geophysical evidence to put constraints on the core’s composition. As Kevin Righter, the lead of the JSC’s high pressure experimental petrology lab and the lead author of the study, explained in a NASA press release:

“Our work ties together physical and chemical constraints and helps us understand how the moon acquired and maintained its magnetic field – a difficult problem to tackle for any inner solar system body. We created several synthetic core compositions based on the latest geochemical data from the moon, and equilibrated them at the pressures and temperatures of the lunar interior.”

Specifically, the ARES scientists conducted simulations of how the core would have evolved over time, based on varying levels of nickel, sulfur and carbon content. This consisted of preparing powders or iron, nickel, sulfur and carbon and mixing them in the proper proportions – based on recent analyses of Apollo rock samples.

Artist concept illustration of the internal structure of the moon. Credit: NOAJ

Once these mixtures were prepared, they subjected them to heat and pressure conditions consistent with what exists at the Moon’s core. They also varied these temperatures and pressures based on the possibility that the Moon underwent changes in temperature during its early and later history – i.e. hotter during its early history and cooler later on.

What they found was that a lunar core composed of iron/nickel that had a small amount of sulfur and carbon – specifically 0.5% sulfur and 0.375% carbon by weight – fit the bill. Such a core would have a high melting point and would have likely started crystallizing early in the Moon’s history, thus providing the necessary heat to drive the dynamo and power a lunar magnetic field.

This field would have eventually died out after heat flow led the core to cool, thus arresting the dynamo effect. Not only do these results provide an explanation for all the paleomagnetic and seismic data we currently have on the Moon, it is also consistent with everything we know about the Moon’s geochemical and geophysical makeup.

Prior to this, core models tended to place the Moon’s sulfur content much higher. This would mean that it had a much lower melting point, and would have meant crystallization could not have occurred until much more recently in its history. Other theories have been proposed, ranging from sheer forces to impacts providing the necessary heat to power a dynamo.

Cutaway of the Moon, showing its differentiated interior. Credit: NASA/SSERVI

However, the ARES team’s study provides a much simpler explanation, and one which happens to fit with all that we know about the Moon. Naturally, additional studies will be needed before there is any certainty on the issue. No doubt, this will first require that human beings establish a permanent outpost on the Moon to conduct research.

But it appears that for the time being, one of the deeper mysteries of the Earth-Moon system might be resolved at last.

Further Reading: NASA, Earth and Planetary Science Letters

NASA Releases Spellbinding Images Of Earth At Night

Composite image of continental U.S. at night, 2016. Credits: NASA Earth Observatory images by Joshua Stevens, using Suomi NPP VIIRS data from Miguel Román, NASA's Goddard Space Flight Center

NASA strives to explore space and to expand our understanding of our Solar System and beyond. But they also turn their keen eyes on Earth in an effort to understand how our planet is doing. Now, they’re releasing a new composite image of Earth at night, the first one since 2012.

We’ve grown accustomed to seeing these types of images in our social media feeds, especially night-time views of Earth from the International Space Station. But this new image is much more than that. It’s part of a whole project that will allow scientists—and the rest of us—to study Earth at night in unprecedented detail.

Night-time views of Earth have been around for 25 years or so, usually produced several years apart. Comparing those images shows clearly how humans are changing the face of the planet. Scientists have been refining the imaging over the years, producing better and more detailed images.

The team behind this is led by Miguel Román of NASA’s Goddard Space Flight Center. They’ve been analyzing data and working on new software and algorithms to improve the quality, clarity, and availability of the images.

This new work stems from a collaboration between the National Oceanic and Atmospheric Administration (NOAA) and NASA. In 2011, NASA and NOAA launched a satellite called the Suomi National Polar-orbiting Partnership (NPP) satellite. The key instrument on that satellite is the Visible Infrared Imaging Radiometer Suite (VIIRS), a 275 kg piece of equipment that is a big step forward in Earth observation.

VIIRS detects photons of light in 22 different wavelengths. It’s the first satellite instrument to make quantitative measurements of light emissions and reflections, which allows researchers to distinguish the intensity, types and the sources of night lights over several years.

Composite image of Mid-Atlantic and Northeastern U.S. at night, 2016. Credits: NASA Earth Observatory images by Joshua Stevens, using Suomi NPP VIIRS data from Miguel Román, NASA's Goddard Space Flight Center
Composite image of Mid-Atlantic and Northeastern U.S. at night, 2016.
Credits: NASA Earth Observatory images by Joshua Stevens, using Suomi NPP VIIRS data from Miguel Román, NASA’s Goddard Space Flight Center

Producing these types of maps is challenging. The raw data from SUOMI NPP and its VIIRS instrument has to be skillfully manipulated to get these images. The main challenge is the Moon itself.

As the Moon goes through its different phases, the amount of light hitting Earth is constantly changing. Those changes are predictable, but they still have to be accounted for. Other factors have to be managed as well, like seasonal vegetation, clouds, aerosols, and snow and ice cover. Other changes in the atmosphere, though faint, also affect the outcome. Phenomenon like auroras change the way that light is observed in different parts of the world.

The newly released maps were made from data throughout the year, and the team developed algorithms and code that picked the clearest night views each month, ultimately combining moonlight-free and moonlight-corrected data.

A glittering night-time map of Europe. Looks like there's a Kraftwerk concert happening in Dusseldorf! NASA Earth Observatory images by Joshua Stevens, using Suomi NPP VIIRS data from Miguel Román, NASA's Goddard Space Flight Center
A glittering night-time map of Europe. Looks like there’s a Kraftwerk concert happening in Dusseldorf! NASA Earth Observatory images by Joshua Stevens, using Suomi NPP VIIRS data from Miguel Román, NASA’s Goddard Space Flight Center

The SUOMI NPP satellite is in a polar orbit, and it observes the planet in vertical swaths that are about 3,000 km wide. With its VIIRS instrument, it images almost every location on the surface of the Earth, every day. VIIRS low-light sensor has six times better spatial resolution for distinguishing night lights, and 250 times better resolution overall than previous satellites.

What do all those numbers mean? The team hopes that their new techniques, combined with the power of VIIRS, will create images with extraordinary resolution: the ability to distinguish a single highway lamp, or fishing boat, anywhere on the surface of Earth.

Composite image of Nile River and surrounding region at night, 2016. Credits: NASA Earth Observatory images by Joshua Stevens, using Suomi NPP VIIRS data from Miguel Román, NASA's Goddard Space Flight Center
Composite image of Nile River and surrounding region at night, 2016.
Credits: NASA Earth Observatory images by Joshua Stevens, using Suomi NPP VIIRS data from Miguel Román, NASA’s Goddard Space Flight Center

Beyond thought-provoking eye-candy for the rest of us, these images of night-time Earth have practical benefits to researchers and planners.

“Thanks to VIIRS, we can now monitor short-term changes caused by disturbances in power delivery, such as conflict, storms, earthquakes and brownouts,” said Román. “We can monitor cyclical changes driven by reoccurring human activities such as holiday lighting and seasonal migrations. We can also monitor gradual changes driven by urbanization, out-migration, economic changes, and electrification. The fact that we can track all these different aspects at the heart of what defines a city is simply mind-boggling.”

These three composite images provide full-hemisphere views of Earth at night. The clouds and sun glint — added here for aesthetic effect — are derived from MODIS instrument land surface and cloud cover products. Credits: NASA Earth Observatory images by Joshua Stevens, using Suomi NPP VIIRS data from Miguel Román, NASA's Goddard Space Flight Center
These three composite images provide full-hemisphere views of Earth at night. The clouds and sun glint — added here for aesthetic effect — are derived from MODIS instrument land surface and cloud cover products.
Credits: NASA Earth Observatory images by Joshua Stevens, using Suomi NPP VIIRS data from Miguel Román, NASA’s Goddard Space Flight Center

These maps of night-time Earth are a powerful tool. But the newest development will be a game-changer: Román and his team aim to provide daily, high-definition views of Earth at night. Daily updates will allow real-time tracking of changes on Earth’s surface in a way never before possible.

Maybe the best thing about these upcoming daily night-time light maps is that they will be publicly available. The SUOMI NPP satellite is not military and its data is not classified in any way. They hope to have these daily images available later this year. Once the new daily light-maps of Earth are available, it’ll be another powerful tool in the hands of researchers and planners, and the rest of us.

These maps will join other endeavours like NASA-EOSDIS Worldview. Worldview is a fascinating, easy-to-use data tool that anyone can access. It allows users to look at satellite images of the Earth with user-selected layers for things like dust, smoke, draught, fires, and storms. It’s a powerful tool that can change how you understand the world.

Black Hole Imaged For First Time By Event Horizon Telescope

Illustration of the supermassive black hole at the center of the Milky Way. Credit: NRAO/AUI/NSF
Illustration of the supermassive black hole at the center of the Milky Way. It's huge, with over 4 times the mass of the Sun. But ultramassive black holes are even more massive and can contain billions of solar masses. Image Credit: Credit: NRAO/AUI/NSF

For decades, scientists have held that Supermassive Black Holes (SMBHs) reside at the center of larger galaxies. These reality-bending points in space exert an extremely powerful influence on all things that surround them, consuming matter and spitting out a tremendous amount of energy. But given their nature, all attempts to study them have been confined to indirect methods.

All of that changed beginning on Wednesday, April 12th, 2017, when an international team of astronomers obtained the first-ever image of a Sagittarius A*. Using a series of telescopes from around the globe – collectively known as the Event Horizon Telescope (EHT) – they were able to visualize the  mysterious region around this giant black hole from which matter and energy cannot escape – i.e. the event horizon.

Not only is this the first time that this mysterious region around a black hole has been imaged, it is also the most extreme test of Einstein’s Theory of General Relativity ever attempted. It also represents the culmination of the EHT project, which was established specifically for the purpose of studying black holes directly and improving our understanding of them.

Simulated view of a black hole. Credit: Bronzwaer/Davelaar/Moscibrodzka/Falcke/Radboud University

Since it began capturing data in 2006, the EHT has been dedicated to the study of Sagittarius A* since it is the nearest SMBH in the known Universe – located about 25,000 light years from Earth. Specifically, scientists hoped to determine if black holes are surrounded by a circular region from which matter and energy cannot escape (which is predicted by General Relativity), and how they accrete matter onto themselves.

Rather than constituting a single facility, the EHT relies on a worldwide network of radio astronomy facilities based on four continents, all of which are dedicated to studying one of the most powerful and mysterious forces in the Universe. This process, whereby widely-space radio dishes from across the globe are connected into an Earth-sized virtual telescope, is known as Very Long Baseline Interferometry (VLBI).

As Michael Bremer – an astronomer at the International Research Institute for Radio Astronomy (IRAM) and a project manager for the Event Horizon Telescope – said in an interview with AFP:

“Instead of building a telescope so big that it would probably collapse under its own weight, we combined eight observatories like the pieces of a giant mirror. This gave us a virtual telescope as big as Earth—about 10,000 kilometers (6,200 miles) is diameter.”

Sagittarius A is the super-massive black hole at the center of our Milky Way Galaxy. It is shown in x-ray (blue) and infrared (red) in this combined image from the Chandra Observatory and the Hubble Space Telescope. Image: X-ray: NASA/UMass/D.Wang et al., IR: NASA/STScI
Combined image of Sagittarius A shown in x-ray (blue) and infrared (red), provided by the Chandra Observatory and the Hubble Space Telescope. Credit: X-ray: NASA/UMass/D.Wang et al., IR: NASA/STScI

All told, the network includes instruments like the Atacama Large Millimeter/submillimeter Array (ALMA) in Chile, the Arizona Radio Observatory Submillimeter Telescope, the IRAM 30-meter Telescope in Spain, the Large Millimeter Telescope Alfonso Serrano in Mexico, the South Pole Telescope in Antarctica, and the James Clerk Maxwell Telescope and Submillimeter Array at Mauna Kea, Hawaii.

With these arrays, the EHT radio-dish network is the only one powerful enough to detect the light released when an object would disappear into Sagittarius A*. And from six nights – from Wednesday, April 5th, to Tuesday, April 11th, – all of its arrays were trained on the center of our Milky Way to do just that. By the end of the run, the international team announced that they had snapped the first-ever picture of an event horizon.

In the end, some 500 terabytes of data were collected. This data is now being transferred to the MIT Haystack Observatory in Massachusetts, where it will be processed by supercomputers and turned into an image. “For the first time in our history, we have the technological capacity to observe black holes in detail,” said Bremer. “The images will emerge as we combine all the data. But we’re going to have to wait several months for the result.”

Part of the reason for the wait is the fact that the recorded data obtained by the South Pole Telescope can only be collected when spring starts in Antarctica – which won’t happen until October 2017 at the earliest. As such, it won’t be until 2018 before the public gets to feast its eyes on the shadow region that surrounds Sagittarius A*, and it is not expected that the first image will be entirely clear.

As Heino Falcke – an astronomers from Radbound University who now chairs the Scientific Council of EHT (and was the one who proposed this experiment twenty years ago) – explained in a EHT press release prior to the observation being made:

“It is the challenge of doing something, that has never been attempted before. It is the start of an adventurous journey towards a black hole… However, I think we need more observation campaigns and eventually more telescopes in the network to make a really good image.”

Despite the wait, and the fact that repeated attempts will be needed before we can get our first clear look at a black hole, there is still plenty of reason to celebrate in the meantime. Not only was this a first that was a long time in he making, but it also represents a major leap towards understanding one of the most powerful and mysterious forces of nature.

Given time, the study of black holes may allow for us to finally resolve how gravity and the other fundamental forces of the Universe interact. At long last, we will be able to comprehend all of existence as a single, unified equation!

Further Reading: Event Horizon Telescope, NRAO

Researchers Image Dark Matter Bridge Between Galaxies

This false color, composite image shows two galaxies, white, connected by a bridge of dark matter, red. The two galaxies are about 40 light years apart. Image: S. Epps & M. Hudson / University of Waterloo

Dark matter is mysterious stuff, because we can’t really “see” it. But that hasn’t stopped scientists from researching it, and from theorizing about it. One theory says that there should be filament structures of dark matter connecting galaxies. Scientists from the University of Waterloo have now imaged one of those dark matter filaments for the first time.

The two scientists, Seth D. Epps and Michael J. Hudson, present their results in a paper at the Monthly Notices of the Royal Astronomy Society.

Theory predicts that filaments of dark matter connect galaxies together, by reaching from the dark matter halo of one galaxy to the same halo in another galaxy. Other researchers have found dark matter filaments connecting entire galaxy clusters, but this is the first time that filaments have been imaged between individual galaxies.

“This image moves us beyond predictions to something we can see and measure.” – Mike Hudson, University of Waterloo

“For decades, researchers have been predicting the existence of dark-matter filaments between galaxies that act like a web-like superstructure connecting galaxies together,” said Mike Hudson, a professor of astronomy at the University of Waterloo. “This image moves us beyond predictions to something we can see and measure.”

Dark matter makes up about 25% of the Universe. But it doesn’t shine, reflect, or interact with light in any way, so it’s difficult to study. The only way we can really study it is by observing gravity. In this study, the pair of astronomers used the weak gravitational lensing technique.

Weak gravitational lensing relies on the effect that mass has on light. Enough concentrated mass in the foreground—dark matter in this case—will warp light from distant sources in the background.

When dealing with something as large as a super-massive Black Hole, gravitational lensing is quite pronounced. But galaxy-to-galaxy filaments of dark matter are much less dense than a black hole, so their individual effect is minimal. What the astronomers needed was the combined data from multiple galaxy pairs in order to detect the weak gravitational lensing.

Key to this study is the Canada-France-Hawaii Telescope. It performed a multi-year sky survey that laid the groundwork for this study. The researchers combined lensing images of over 23,000 pairs of galaxies 4.5 billion light years away. The resulting composite image revealed the filament bridge between the two galaxies.

“By using this technique, we’re not only able to see that these dark matter filaments in the universe exist, we’re able to see the extent to which these filaments connect galaxies together.” – Seth D. Epps, University of Waterloo

We still don’t know what dark matter is, but the fact that scientists were able to predict these filaments, and then actually find them, shows that we’re making progress understanding it.

We’ve known about the large scale structure of the Universe for some time, and we know that dark matter is a big part of it. Galaxies tend to cluster together, under the influence of dark matter’s gravitational pull. Finding a dark matter bridge between galaxies is an intriguing discovery. It at least takes a little of the mystery out of dark matter.

NASA Bombshell: Key Ingredient For Life Discovered On Enceladus

Scientists recently determined that a certain strain of Earth bacteria could thrive under conditions found on Enceladus. Credit: NASA/JPL/Space Science Institute


NASA has announced the discovery of hydrogen in the plumes on Enceladus. This is huge news, and Cassini scientists have looked forward to this day. What it means is that there is a potential source of energy for microbes in the oceans of Enceladus, and that energy from the Sun is not required to support life.

We’ve known about the plumes on Enceladus for a while now, and Cassini has even flown through those plumes to determine their content. But hydrogen was never discovered until now. What it means is that there is a geochemical source for hydrogen in Enceladus’ ocean, coming from the interaction between warm water and rocks.

“This is the closest we’ve come, so far, to identifying a place with some of the ingredients needed for a habitable environment.” – Thomas Zurbuchen, NASA.

This is a capstone finding, according to NASA. As far as we know, life needs three things to exist: water, energy, and the right chemicals. We know it has the necessary chemicals, we know it has water, and we now know it has a source of energy.

On Earth, hydrothermal vents deep in the ocean floor provide the energy for a web of life reliant on those vents. Bacteria live there, forming the base of a food chain that can include tube worms, shrimp, and other life forms. This discovery points to the possibility that similar communities might exist in the sub-surface ocean of Enceladus.

“This is the closest we’ve come, so far, to identifying a place with some of the ingredients needed for a habitable environment,” said Thomas Zurbuchen, associate administrator for NASA’s Science Mission Directorate at Headquarters in Washington.

Microbes in Enceladus’ ocean could use the hydrogen in a process called methanogenesis. They obtain energy by combining hydrogen with dissolved carbon dioxide in the water. This process produces a methane by-product. Methanogenesis is a bedrock process at the root of life here on Earth.

“Confirmation that the chemical energy for life exists within the ocean of a small moon of Saturn is an important milestone in our search for habitable worlds beyond Earth,” said Linda Spilker, Cassini project scientist at NASA’s Jet Propulsion Laboratory (JPL) in Pasadena, California.

Hubble Confirms Plumes On Europa

NASA has also announced that the Hubble Space Telescope has confirmed the presence of plumes on another of our Solar System’s icy moons, Europa.

These plumes were first seen by the Hubble in 2014, but were never seen again. Since repeatability is key in science, those findings were put on the back burner. But in 2016, NASA announced today, Hubble spotted them again, in the same place. This is the same spot that the Galileo probe noticed a thermal hot spot.

We don’t know if Europa has hydrogen in its oceans, but it’s easy to see where this is going. NASA’s excitement is palpable.

What’s Next?

NASA’s Europa Clipper mission will visit Europa and determine the thickness of its ice layer, as well as the depth and salinity of its ocean. It will also analyze the atmosphere and the composition of the plumes. Europa Clipper will fill in a lot of gaps in our understanding.

Europa Clipper will be launched around 2022, but a mission to Enceladus will have to wait a little longer. One mission under consideration in NASA’s Discovery program is ELF, Enceladus Life Finder. ELF would fly through Enceladus’ plumes 8 or 10 times, taking more detailed samples of their content.

This enhanced-color Cassini view of southern latitudes on Enceladus features the bluish “tiger stripe” fractures that rip across the south polar region. These tiger stripes form over hydrothermal vents in the ocean, the source of Enceladus’ plumes. Credits: NASA/JPL-Caltech/Space Science Institute

The discovery of hydrogen in the plumes of Enceladus is huge news any way you look at it. But that discovery begs the question: Are we doing it all wrong? Are we looking for life in the wrong places?

The search for life elsewhere in the Universe, so far, has mostly revolved around exoplanets. And then refining that search to identify exoplanets that are in the habitable zones of their stars. We’re searching for other Earths, basically.

But maybe we should be changing our focus. Maybe it’s the ice worlds, including icy exomoons, that are the most likely targets for our search. This new evidence from NASA’s Cassini mission, and from the Hubble Space Telescope, suggests that in our Solar System at least, they are the best place to search.

One Final Ingredient Needed?

There’s a fourth ingredient needed for life. Once there is water, energy, and the necessary chemicals, life needs time to get going. How much time, we’re not exactly certain. But this is where Enceladus and Europa are different.

Europa is about 4 billion years old, or so we think. That’s only half a billion years younger than Earth, and we think life started on Earth about 3.5 billion years ago. This hints that, if conditions on Europa are favorable, life has had a long time to get going. Of course, that doesn’t mean it has.

On the other hand, Enceladus is probably much younger. A study of the orbits of Saturn’s moons suggests that Enceladus may only be 100 million years old. If that’s true, it’s not very much time for life to get going.

The hydrogen discovery is huge news. There are still a lot of questions, of course, and lots to be debated. But confirming a source of energy on Enceladus builds the case for the same type of hydrothermal vent life that we see on Earth.

Now all we need is a mission to Enceladus.

NEO Asteroid 2014 JO25 Set to Buzz Earth on April 19th

Artist's concept of a large asteroid passing by the Earth-Moon system. Credit: A combination of ESO/NASA images courtesy of Jason Major/Lights in the Dark.
Missed us… a concept image of a large asteroid passing by the Earth-Moon system. Credit: A combination of ESO/NASA images courtesy of Jason Major/Lights in the Dark.

It’s a shooting gallery out there. The spattered face of Earth’s Moon and large impact sites such as Meteor Crater outside of Flagstaff, Arizona remind us that we still inhabit a dangerous neck of the solar neighborhood. But despite the inevitable cries proclaiming the “End of the World of the Week” this coming weekend, humanity can breathe a collective sigh of relief next Wednesday on April 19th, when asteroid 2014 JO25 passes safely by the Earth.

To be sure, lots of smaller space rocks pass by the Earth closer than the Moon (that’s an average of 240,000 miles distant) on a monthly basis. Take for example 4-meter asteroid 2017 GM, which passed just 16,000 kilometers distant on April 4th. What makes 2014 JO25 special is its size: measurements from NASA’s NEOWISE mission suggest that 2014 JO25 is about 2,000 feet (650 meters) along its longest axis, about twice the length of a Nimitz-class aircraft carrier. 2014 JO25 is passing 1.1 million miles (1.8 million kilometers) or 4.6 times the Earth-Moon distance on Wednesday, the closest large asteroid pass since 5-km Toutatis in September, 2004. The next predicted large asteroid pass near Earth is 1999 AN10, set to pass 1 LD (lunar distance) from the Earth in 2027.

4179 Toutatis as seen from China’s Chang’e 2 spacecraft. Credit: CNSA

This is also the closest passage of 2014 JO25 near the Earth for a 900 year span.

Discovered on May 5th, 2014 by the Catalina Sky survey, asteroid 2014 JO25 orbits the Sun once every three years, taking it from a perihelion of 0.237 AU (interior to Mercury’s orbit) out to an aphelion of 3.9 distant in the asteroid belt, interior to Jupiter’s orbit.

The orbit of NEO asteroid 2014 JO25. Credit: NASA/JPL.

Finding 2014 JO25 at its Closest Approach

With an estimated albedo (surface brightness) about twice that the lunar surface, 2014 JO25 will reach magnitude +10 to +11 on closest approach on Wednesday. Currently low in the dawn sky in the Square of Pegasus asterism, asteroid 2014 JO25 passed perihelion sunward as seen from the Earth at 1.015 Astronomical Units (AU) distant on March 11th. At its closest to the Earth on April 19th at 12:24 Universal Time (UT)/6:24 AM EDT, asteroid 2014 JO25 will skim the jagged Draco-Ursa Minor border below the bowl of the Little Dipper, moving at a whopping three degrees per hour. Sitting just 25 degrees from the north celestial pole on closest approach, catching sight of 2014 JO25 at favors western North America and northeastern Asia, though the eastern half of North America and Europe have a shot at the asteroid a few hours prior to closest approach in the early morning hours of April 19th. North American viewers get another shot at catching the fleeting asteroid later the same evening 13 hours after closest approach as the asteroid sails through the galaxy-rich constellation Coma Berenices.

The 24 hour path of asteroid 2014 JO25 from midnight UT April 18th through April 19th. (note: hourly time hacks are in Eastern Daylight Saving Time EDT UT-4). Credit: Starry Night Education software.

At +11th magnitude, you’ll need a telescope of at least 6” aperture or larger and a good star chart to nab 2014 JO25 as it glides against the starry background. Fellow Universe Today contributor Bob King has some great star charts of the pass over at Sky & Telescope. The Moon will be at Last Quarter phase on the morning of the 19th, providing moderate light pollution.

Plans are also afoot for NASA to ping asteroid 2014 JO25 using Arecibo and Goldstone radar… expect stunning animations to follow next week.

Clouded out? The good folks at the Virtual Telescope Project have you covered, with a live webcast featuring the passage of NEO 2014 JO25 starting at 21:30 UT/5:30 PM EDT on April 19th.

And if you’re out hunting for asteroids on the coming mornings, there are currently two bright binocular comets in the dawn sky to keep you company: Comet C/2017 E4 Lovejoy in the constellation Andromeda and Comet C/2015 ER61 PanSTARRS in Aquarius. Both are currently performing above expectations at about magnitude +7.

A busy neighborhood: Known asteroids as of April 1st, 2016. Credit: NASA/JPL.

“What if” an asteroid the size of 2014 JO25 hit the Earth? Well, the Chelyabinsk meteor was an estimated 20 meters in size; the impactor that formed Meteor Crater in Arizona was about 50 meters in diameter. The Chicxulub event off the Yucatan peninsula 66 million years ago was an estimated 10 kilometer-sized impactor well over ten orders of magnitude bigger than 2014 JO25. While the impact of a 600 meter asteroid would be a noteworthy event and a bad day locally, it would pale in comparison to an extinction level event.

All something to consider, as you watch the faint dot of asteroid 2014 JO25 pass harmlessly by the Earth and through the news cycle for the coming week.