The Stats Are In: No Global Cooling

Global Temperature graph. Credit: National Climatic Data Center, via the Associated Press.

[/caption]
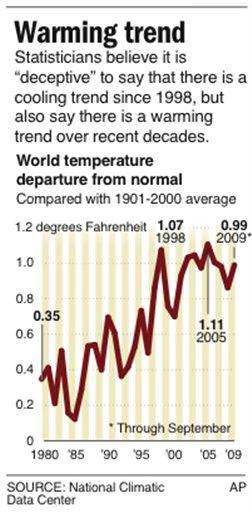
The idea that the world is now cooling has been repeated in opinion columns, talk radio, pundit television and more. After a poll was released last week indicating that only 57 percent of Americans now believe there is strong scientific evidence for global warming, which is down from 77 percent in 2006, Seth Borenstein from the Associated Press decided to check out what the statistics are really saying about global warming or cooling. In a blind test, Borenstein sent accumulated ground temperature data from the past 130 years to four independent statisticians. He disguised the sources (NASA, NOAA and British meteorological data) and didn’t tell the statisticians what the numbers represented; he asked them to just look for trends in the data. The experts found no true temperature declines over time; additionally, the last ten years comprise not only the highest data set in the record, but they also have a continued, positive trend.

It seems recent weather trends have been cool — 2008 was cooler than previous years, especially the really hot years of 1998 and 2005.

Global land and ocean temperature indexes.  Credit:  Goddard Institute for Space Studies.
Global land and ocean temperature indexes. Credit: Goddard Institute for Space Studies.

Borenstein wanted to know if this was a longer climate trend or just weather’s normal ups and downs. All four of the statisticians agreed independently the statistics overall clearly show an upward trend of warming. Also included was a data set of satellite temperature data that is often favored by skeptics of global warming. Same story there: global temps are on the rise.

The ups and downs during the last decade, which some skeptics say show a cooling rather than warming, are variations that are repeated randomly in data as far back as 1880.

One statistician said that “cherry-picking” a micro-trend within a bigger trend is not the way to look at data.

This “blind” review of the data isn’t the only review that has shown obvious warming. Borenstein said that NOAA recently re-examined its data because of the recent “chatter” about cooling, and no cooling trend was found, and earlier this year, climate scientists in two peer-reviewed publications statistically analyzed recent years’ temperatures against claims of cooling and found them not valid.

For the full story, read Borenstein’s article here.

Source: Associated Press

Satellite Map

NASA satellite map of the Earth

[/caption]
There are thousands of satellites overhead in space right now, and many of them are being used to map every single square meter of planet Earth. And many of these images are being freely distributed on the Internet so you can access them through any browser. If you’re looking for a satellite map, there are many services out there that can help you out.

Probably the easiest and best place to start is with the Google Maps service from Google. This allows you to see a satellite map of the entire Earth. You can drag around the map to browse around the planet, and you can zoom out and in right down to the highest resolution images they have in their server. In many cases this means you can see your house, your yard, and even your car parked out in the street. You can also type in a specific address location and go straight there. There are street maps you can overlay or remove, you can get driving directions, and much more. And the Google Maps API has been made available by Google to other websites, so people are developing mashups that let you track running routes and find the nearest bathroom.

An even cooler satellite mapping service is Google Earth. Unlike Google Maps, you have to download Google Earth to your local PC, Mac or Linux machine (there’s even an iPhone version). Then you get this cool spinning 3-D version of the Earth. You can zoom out and in, type in a specific location address or geocode to find any spot on Earth. They also have a big library of additional layers that you can put over top, to see additional information mapped on the Earth. It’s well worth the download.

Another good service is TerraServer; they let you buy satellite maps if you want a nice printed version for your wall. If you don’t want to use Google, there are similar mapping tools from Microsoft and Yahoo.

We have written many articles about how satellites are being used to map the Earth. Here’s an article about how scientists use satellite photos to track penguin poop from space, and how Google’s maps had a satellite view of Obama’s inauguration.

We have also recorded an episode of Astronomy Cast all about Earth. Listen here, Episode 51: Planet Earth.

What is the Most Remote Place on Earth?

Remotest Island

Have you had enough of kids, car alarms and the obnoxious laugh of your neighbor down the hall? You may find yourself wanting to get away from it all. If you aren’t lucky enough to have the magical nose of Sam Stephens to zap you into another dimension, you can visit Bouvet Island; an uninhabited, glacier clad island located between the southern tip of Africa and Antarctica. By all accounts, this is the remotest place on Earth, but if you don’t like the cold or have something against Norway, the county to which it belongs, take heart, you can always move to the comparatively burgeoning metropolis of Tristan da Cunha, a group of British, volcanic islands half way between South America and Africa. One of the islands in this group is actually called Inaccessible Island; and that’s saying something given its neighbors!

The most remote place on Earth can be defined as the landmass furthest from any other landmass and either inhabited or uninhabited. Since Tristan da Cunha is a group of islands, they can’t be defined as being furthest from another land mass, but taken as a whole, they tie with Bouvet Island as the most remote. The Tristan da Cunha group includes Ascension, Saint Helena and Tristan da Cunha itself which has a total population of 284. The islands are 2,816 km away from the nearest landmass.

What is Tristan da Cunha famous for, other than being hard to get to? Wideawake Airfield on Ascension Island was jointly owned by the US and British governments and used extensively during WWII, but then fell into disuse. In 1982, the British used Ascension Island as a staging base for the Falklands War. It’s famous also, for housing one of the 5 worldwide GPS ground antennae which you would no doubt, need to even get there!

Want more Earth extremes? Here’s an article about the hottest place on Earth, and here’s an article about the coldest place on Earth.

Here’s the guide to visiting Tristan da Cunha.

We have recorded an episode of Astronomy Cast all about Earth. Listen here, Episode 51: Earth.

Earth’s Layers For Kids

My son recently came back from a science day camp with one of the coolest things. It was a model of the Earth that he had created out of modeling clay. It showed the internal structure of the Earth, and because he built it, he was able to remember all of the layers of the Earth. Very cool. So here’s a good way to learn the Earth layers for kids.

To make your own, you need some modeling clay of different colors. You start by making a ball about 1.2 cm across. This represents the Earth’s inner core. Then you make a second ball about 3 cm across. This ball represents the Earth’s outer core. Then you make a third ball about 6 cm across. This ball represents the Earth’s mantle. And finally, you make some flattened pieces of clay that will be the Earth’s crust. To make it extra realistic, make some pieces blue and others green.

Take inner core and surround it with the outer core, and then surround that by the mantle. Cover the entire mantle with a thin layer of blue, and then put on some green continents on top of the blue.

If you’ve been really careful, you should be able to take a sharp knife and slice your Earth ball in half. You should be able to see the Earth’s layers inside, just like you’d see the real Earth’s layers. And you can see that the mantle is thicker underneath the Earth’s continents than it is under the oceans.

Here’s a link with more information from Purdue University so you can do the experiment yourself.

If you’re interested in teaching your children Earth science, here’s lots of information about volcanoes for kids.

We have also recorded a whole episode of Astronomy Cast just about Earth. Listen here, Episode 51: Earth.

How Big is Earth?

Blue marble Earth. Image credit: NASA

[/caption]
Here’s a question: how big is Earth? Let’s take a look at how big our planet is.

First, the equatorial diameter of Earth is 12,756 km. In other words, if you dug a tunnel on the equator that went straight down and went right through the center of the Earth, it would be about 12,756 km long. Just for comparison, that’s about 1.9 times the diameter of Mars. And only .09% the diameter of Jupiter.

The volume of Earth is 1.08 x 10¹² km3. Written another way, that’s 1.08 trillion cubic kilometers of rock and metal. Again, it’s about 6.6 times more volume than Mars.

The surface area of Earth is 510,072,000 square kilometers. Of that, 29.2% is covered by land and 70.8% is covered by water. Just for comparison, that’s 3.5 times as much surface area as Mars.

The mass of Earth is 5.97 x 1024 kg. Here that is written out: 5,970,000,000,000,000,000,000,000 kg. Yeah, that’s a really big number. And yet, it’s only 0.3% the mass of Jupiter (and Jupiter is mostly lightweight hydrogen).

We have written many articles about Earth for Universe Today. Here’s an article about how fast Earth rotates, and here’s an article about Earth’s magnetic field.

You can learn more about Earth from NASA’s Earth Observatory, as well as NASA’s Solar System Exploration Guide.

We have also recorded an entire episode of Astronomy Cast that’s just about Earth. Listen here, Episode 51: Earth.

Tsunami Pictures

Sri Lanka Tsunami pictures

Tsunamis are some of the most devastating natural disasters. The recent Boxing Day Tsunami was generated by an enormous earthquake off the coast of Indonesia on December 26, 2004. Coastlines in Asia were inundated with enormous tsunami surges, killing more than 200,000 people.

Here are some Tsunami pictures capture by satellite that show before and after images of the regions affected by the tsunami.

[/caption]

This photograph shows the devastation that happened in Sri Lanka on December 26th. This picture was taken by the DigitalGlobe Quickbird satellite, and shows how the whole coastline was inundated with water.

Devastation in Indonesia

Perhaps the most devastation from the tsunami occurred in Indonesia. This is an image of the town of Lhoknga, Indonesia. It was completely wiped off the map by the tsunami, except for the white mosque in the center of town.


Northern Sumatra
Northern Sumatra

This photograph, captured by NASA’s Terra satellite shows how the whole northwest coast of the island of Sumatra was hit hard by the tsunami. It looks like the vegetation was just scraped back from the edge of the island.

We have written many articles about the devastation from the 2004 tsunami. Here’s an article about how GPS could be used for a tsunami warning system.

You can get many more tsunami pictures from NASA from their Earth observation page.

Pictures of Rivers

Mississippi river delta

Here are some cool pictures of rivers taken by various spacecraft.

Here’s a picture of the Mississippi river delta. The image was captured by Advanced Spaceborne Thermal Emission and Reflection Radiometer (ASTER) aboard NASA’s Terra satellite.


Betsiboka River flooding

This is an image of flooding on the Betsiboka River in Madagascar. The flooding was created by Tropical Storm Eric, which swept through the region in early 2009. This photograph was taken by astronauts on board the International Space Station.


Colorado River Delta

People rely on the Colorado River so much that very little of it actually reaches the ocean. Instead, almost all of the water that flows through the river is used for irrigation along its route.


Ganges river delta. Image credit: NASA

This is a picture of the river delta for the Ganges. In fact, the Ganges combined with the Brahmaputra River make up the largest river delta in the world. The rivers flood from snow melt in the nearby Himalayas.


Niger River
Niger River

This is a picture of the Niger River. It was captured by the ASTER instrument on board NASA’s Terra Earth Observation satellite.

We have written many articles with pictures of rivers for Universe Today. Here’s an article about flooding in the Red River, and here’s an image of the Yangtze River from space.

We have also recorded an episode of Astronomy Cast all about the Earth. Listen to it here, Episode 51: Earth.

Abiogenesis

What are Fossils
Fossil stromatolite, Barberton Mountains South Africa (2.5 billion years old)

[/caption]
How did life on Earth arise? Scientific efforts to answer that question are called abiogenesis. More formally, abiogenesis is a theory, or set of theories, concerning how life on Earth began (but excluding panspermia).

Note that while abiogenesis and evolution are related, they are distinct (evolution says nothing about how life began; abiogenesis says nothing about how life evolves).

Intensive study of the Earth’s rocks has turned up lots and lots of evidence that some kinds of prokaryotes lived happily on Earth about 3.5 billion years ago (and there’re also pointers to the existence of life on Earth in the oldest rocks). So, if life arose on Earth, it did so from the chemicals in the water, air, and rocks of the early Earth … and in no more than a few hundred million years.

Because there are no sedimentary rocks older than about 3.7 billion years (and no metamorphic ones older than about 3.9 billion years), and because the oldest such rocks already contain evidence that there was life on Earth then, testing abiogenesis theories must be done by means other than geological.

There is a long history of attempts to create various organic molecules – such as amino acids – from simple precursors such as carbon dioxide, ammonia, and water, in conditions which simulate those of the early Earth. Those of Miller and Urey, in 1953, are the most famous (and the first).

It turns out that it’s pretty easy to form many kinds of organic molecules, in a wide range of environments … so the focus of research today is on how life could arise from any particular brew. And the hard part is how reliable self-replication get going (if you can make some sort of primitive cell in a test tube, it isn’t a form of life if it can’t reproduce itself!). So far, it seems that RNA and DNA cannot have been involved (too hard to form and stay stable), but several simpler kinds of molecules may work.

Well, that’s one hard part; another is how can a stable bag of chemicals form? (There have been some exciting recent discoveries which may help answer at least part of this question).

A different approach – than reproduction – to finding the key to how life got started involves asking how metabolism arose; how can a bag of chemicals take in ‘food’, process it (to supply energy to all the other chemical processes going on in the bag), and get rid of the waste?

The TalkOrigins website has a summary of abiogenesis, though it is now somewhat dated (much has happened in just the last three years)!

Abiogenesis in its strict sense (origin of life on Earth) is a bit off the track for Universe Today; however, conditions under which life might spontaneously arise, on other planets (etc) is not. Some Universe Today stories on this are Sub-surface Oceans In Comets Suggest Possible Origin of Life, Add Heat, Then Tectonics: Narrowing the Hunt for Life in Space, and Has Liquid Water Been Detected on Mars?

Earth’s Circumference

Blue marble Earth. Image credit: NASA

The Earth’s circumference – the distance around the equator – is 40,075 kilometers around. That’s sounded nice and simple, but the question is actually more complicated than that. The circumference changes depending on where you measure it. The Earth’s meridional circumference is 40,008 km, and its average circumference is 40,041 km.

Why are there different numbers for the Earth’s circumference? It happens because the Earth is spinning. Think about what happens when you spin around holding a ball on a string. Your rotation creates a force that holds the ball out on the end of the string. And if the string broke, the ball would fly away. Even though the Earth is a solid ball of rock and metal, its rotation causes it to flatten out slightly, bulging at the equator.

That bulge isn’t very much, but when you subtract the meridional circumference (the equator when you pass through both poles), and the equatorial circumference, you see that it’s a difference of 67 km. In other words, if you drove your car around the equator of the Earth, you would drive an extra 67 km than you would if you drove from pole to pole to pole.

And that’s why the average circumference of Earth is 40,041 km. Which answer is correct? It depends on how accurate you want to be with your calculation.

We have written many articles about the Earth for Universe Today. Here’s an article about how fast the Earth rotates, and here’s an article about how round the Earth is.

Want more resources on the Earth? Here’s a link to NASA’s Human Spaceflight page, and here’s NASA’s Visible Earth.

We have also recorded an episode of Astronomy Cast about Earth, as part of our tour through the Solar System – Episode 51: Earth.

Magnetic North Pole

The movement of Earth's north magnetic pole across the Canadian arctic, 1831--2001 (Geological Survey of Canada)

[/caption]

The Earth has a magnetic field, known as the magnetosphere, that protects our planet from the particles of the solar winds. One point of that field is known as the Magnetic North Pole. The Magnetic North Pole is not the geographic North Pole; it is actually hundreds of miles south of the geographic North Pole and north of Canada.

Hundreds of years ago, European navigators believed that the needles of compasses were attracted to some “magnetic mountain” or “island” thought to be located in the far north. Some also believed that the needles could be attracted to the Pole Star, which is part of the Ursa Minor constellation and has long been used in navigation. One English philosopher, William Gilbert, proposed that the Earth acts like a giant magnet; he also was the first person to state that the Earth’s magnetic field points vertically downward at the Magnetic North Pole. It took hundreds of years before scientists came to properly understand our planet’s magnetic field, although this is known to be correct now.

All magnets have two poles, like the “plus” and “minus” signs found on batteries. Instead of these locations being named plus and minus though, they were named the North and South Magnetic Poles. It is toward the Magnetic North Pole that your compass points not the geographic North Pole, which makes sense considering it utilizes magnets to determine direction. At the Magnetic North Pole, the magnetic fields points down vertically; in other words it has a 90° “dip” toward the Earth’s surface. The counterpart of the Magnetic North Pole is the Magnetic South Pole. Because the Earth’s magnetic field is not perfectly symmetrical, the magnetic fields are not antipodal. That means that if you draw a straight line between them, it does not pass through the Earth’s center. It is off by approximately 530 km. The North and South Magnetic Poles are also known as Magnetic Dip Poles because they “dip” at a 90° angle towards the Earth.   

The Magnetic North Pole continues to move around. According to the Geological Survey of Canada, which routinely studies the Magnetic North Pole, the pole moves as much as 40 km per year. It also moves daily. Every day, the Magnetic North Pole has an elliptical movement of approximately 80 km from the average point of its center. That means when you are using a compass, you have to be aware of the difference between magnetic north and geographic north.

Universe Today has articles on Earth’s magnetic field and modeling the Earth’s magnetic field.

For more information, check out the Magnetic North Pole and geomagnetism.

Astronomy Cast has an episode on Earth.

References:
Earth’s Inconstant Magnetic Field
Earth’s Magnetic Field and its Changes in Time