2010 Tied for Warmest Year on Record say NOAA and NASA

World map with global temperature changes from 1880 to 2010. Credit: NASA GISS

[/caption]

Newly released scientific data shows that 2010 equals 2005 as the Earths warmest year on record over the last 131 years, say researchers from NOAA and NASA. Temperature measurements from instrumented monitoring stations date back to 1880.

The past decade from 2001 to 2010 was the warmest on record and includes 9 of the 10 hottest years. A NOAA ranking of the 15 hottest years globally shows they all occurred in the last 15 years since 1995.

2010 was the 34th consecutive year with global temperatures above the 20th century average of 57.0 F (13.9°C), according to NOAA data. 1976 was the last year with a below average global temperature. Updated.

Global surface temperature anomalies for 2010. Credit: NOAA

Overall, the combined global land and ocean surface temperatures for 2010 and 2005 has risen 1.12 F (0.62 C) compared with the 20th century average, according to NOAA. The average global temperature in 2010 was 58.12 degrees compared to 57.0 F (13.9°C) as the average for all of 20th century. 2010 was also the wettest year on record.

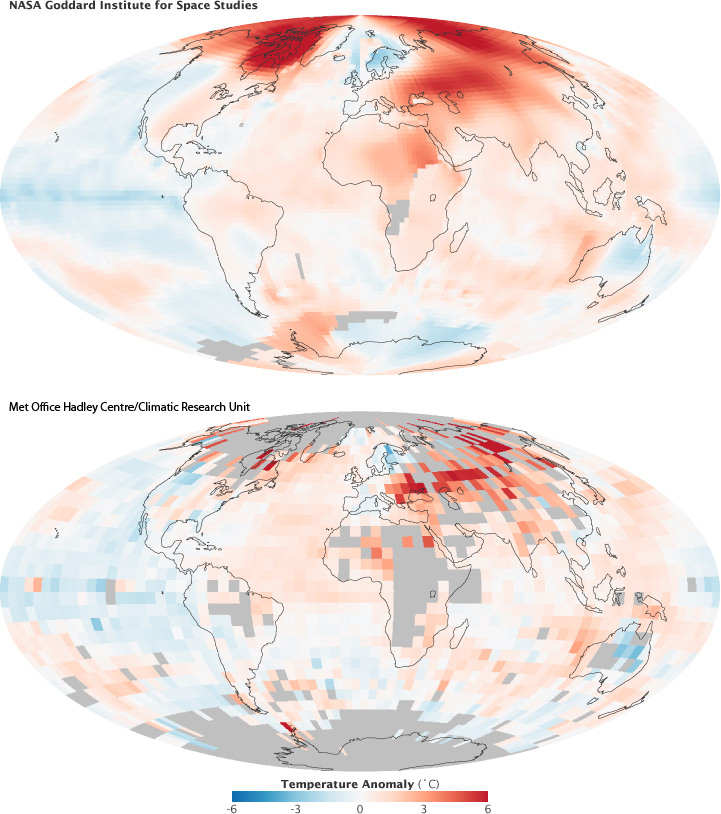
The rise in Earths’ global temperature has been accompanied by a decline in arctic sea ice. Specifically, surface air temperatures in the arctic were warmer than normal during the summer of 2010. The sea ice extent measured in September 2010, was the 3rd lowest on record since accurate monitoring began in 1979, states NOAA in the annual Arctic report card. See Video below.

Scientists from NOAA’s National Climatic Data Center (NCDC) in Asheville, N.C. and NASA’s Goddard Institute for Space Studies (GISS) in New York City announced the findings on Jan 12. The temperature data are collected by weather stations that span across the globe.

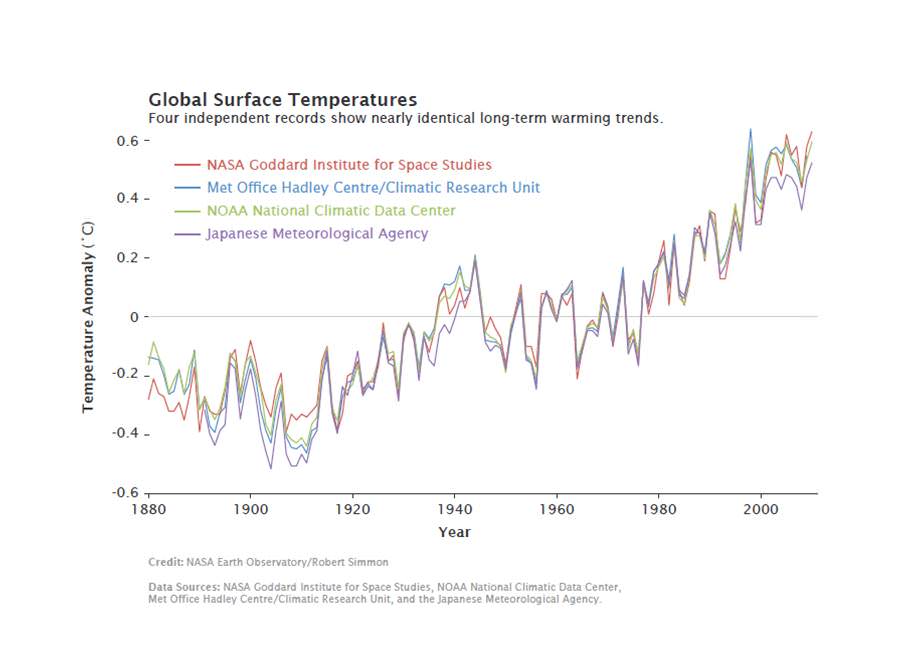
Global measurements by independent researchers in the UK at the Met Office Hadley Centre and at the Japanese Meteorological Agency closely match the trend of warming temperatures gathered by NOAA NCDC and NASA GISS.

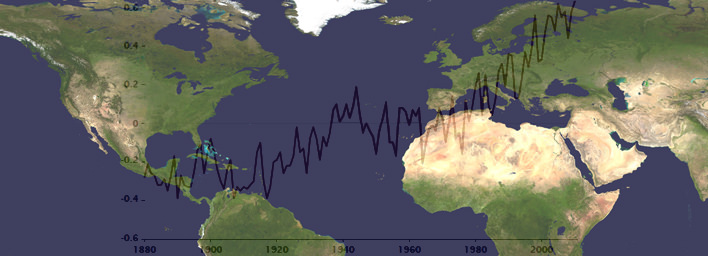
The graphic below combines the actual temperature data collected independently by the four research agencies. The temperature trend lines are remarkably consistent.

Multiple institutions monitor global surface temperatures. Despite subtle differences in the ways the scientists perform their analyses, these four widely referenced records show remarkable agreement. Credit: NASA Earth Observatory/Robert Simmon

Much of the rise in global temperatures has taken place since the late 1970’s, says NASA. The rate of increase has been about 0.36 F per decade. The NASA GISS weather data were collected using over 1000 meteorological stations around the world, satellite observations of sea surface temperature and Antarctic research station measurements.

2010 average annual temperature ranks by state in the US. Credit: NOAA

The data are fed into a computer program which then calculates temperature anomalies — the difference between surface temperature in a given month and the average temperature for the same period during 1951 to 1980. NASA GISS uses that three-decade period as the baseline for analysis against which climate change can be tracked. NOAA uses the entire 20th century.

For the contiguous United States, NOAA analysis shows that “2010 was the 14th consecutive year with an annual temperature above the long-term average. Since 1895, the temperature across the US has increased at an average rate of approximately 0.12 F per decade.”

More at these press releases from NOAA and NASA

There are large areas in the Arctic without weather stations. NASA GISS approaches the problem by filling in gaps with data from the nearest land stations. The Climatic Research Unit at the University of East Anglia, which works jointly with the Met Office Hadley Centre, leaves much of the region out of its global temperature analysis. Credit: NASA Earth Observatory/Robert Simmon
2010 Global Significant Weather and Climate Events. Credit: NOAA
Global Temperatures.
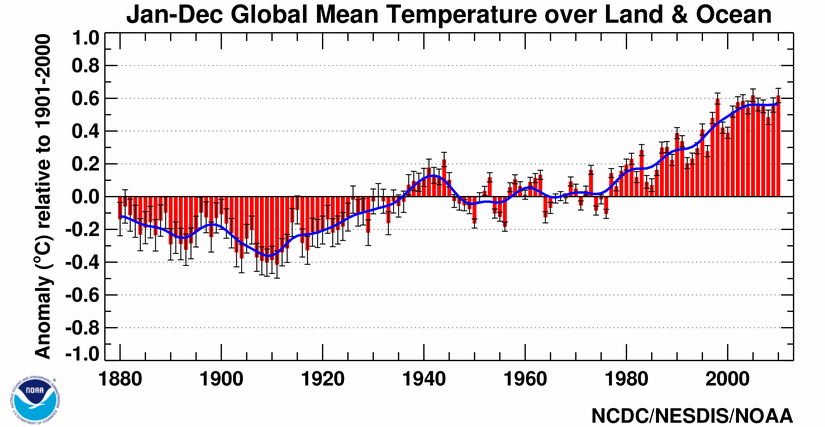
The year 2010 tied with 2005 as the warmest year since records began in 1880. The annual global combined land and ocean surface temperature was 0.62°C (1.12°F) above the 20th century average. The range associated with this value is plus or minus 0.07°C (0.13°F). The 2010 combined land and ocean surface temperature in the Northern Hemisphere was also the warmest on record, while the combined land and ocean surface temperature in the Southern Hemisphere was the sixth warmest such period on record. Credit: NOAA

NOAA Arctic Report Card 2010

“Aflockalypse” — Mass Animal Deaths Now Mapped on Google

Screenshot of the Google Maps Aflockalypse maps of mass bird deaths.

[/caption]

You have to admit, the news is a little weird: 5,000 blackbirds falling dead from the sky in Arkansas; tens of thousands of dead fish in Chesapeake Bay; 50-100 dead birds found strewn in lawns in Sweden; 40,000 dead crabs washed up on England’s shores; 530 penguins, numerous other seabirds, five dolphins, and three giant sea turtles dead in Brazil; 200 American Coots dead on a Texas bridge; hundreds of snapper fish dead in New Zealand. And the list keeps growing.

Eerie coincidence? Or just a symptom of the digital age where news travels faster than you can say “The End is Nigh?”

You can now keep track of what is being called “Aflockalypse” on Google Maps.

Google Maps links reports of animal deaths, as well as reports of birds that have succumbed to the bird flu. By clicking on the blue balloons on the map you will be given a link that will provide the original news report. You can also click the links in the left side panel of the map.

The map provides a quick look at where the mass, unexplained deaths are taking place. But some say the map could help solve the mystery, as there has been suggestions the map could be overlaid on a current global oil exploration map to test the hypothesis that the deaths could have been caused by ground penetrating tomography.

This isn’t the first time that unexplained mass animal deaths have occurred — see this article on Time for the “Top 10 Strange Mass Animal Deaths” — but it seems unprecedented to have them happen all over the world within a few days.

Or is it? Others have suggested that the internet age allows us to connect the dots where there are none to be connected. The dead birds in Arkansas on New Years Eve — seemingly the first report of mass animal deaths — have been attributed to them flying through a fireworks display, and there could be logical reasons for the others, too.

Find out more by interacting with the Google Map.

North American Plate

All About Plate Tectonics

[/caption]

Oftentimes when we think of the Earth, we tend to think of stable landmasses that are surrounded by vast oceans. It’s easy for us to forget that the Earth is still very much a work in a progress, that its foundations are mobile slabs of rock, known as plates, which are constantly on the move and shuffling back and forth. In our next of the woods, aka. North American, we inhabit what is appropriately named the North American Plate, the tectonic boundary that covers most of North America, Greenland, Cuba, Bahamas, and parts of Siberia and Iceland. It extends eastward to the Mid-Atlantic Ridge and westward to the Chersky Range in eastern Siberia. It is composed of two types of lithosphere: the upper crust (where the continental land masses reside) and the thinner oceanic crust.

As one of the Earth’s original continents, the North American Plate started forming some three billion years ago when the planet was much hotter and mantle convection much more vigorous. Roughly two billions years ago, the Earth cooled and these old floating pieces of the lithosphere, called cratons, stopped growing. Since that time, the plates have been moving back and forth across the globe, their cratons colliding to form the continents that we know and recognize today. Beginning in the Cambrian period, over five hundred million years ago, the cratons of Laurentia and Siberia broke off from the main landmass of Pangaea, which thereafter would be known as Gondwana. By the late Mezosoic era (circa two hundred million years ago) the Laurentian and Eurasian cratons combined to form the supercontinent of Laurasia. Since that time, the separation of the North American and Eurasian plates has led to the separation of the North America from Asia. As the North American plate drifted west, the landmasses of Iceland and Greenland broke off in the east while in the west, it collided with the Eurasian plate again, adding the landmass of Siberia to East Asia.

In terms of what makes the plates move across the Earth, a number of theories coexist. One theory is what is known as the “conveyor belt” principle, where the Earth’s lithosphere has a higher strength and lower density than the underlying asthenosphere and lateral density variations in the mantle result in the slow drifting motion of the plates, resulting in collisions and subduction zones. One of the main points of the theory is that the amount of surface of the plates that disappear through subduction along the boundaries where they collide is more or less equal to the new crust that is formed along the margins where they are drifting apart. In this way, the total surface of the Globe remains the same. A different explanation lies in different forces generated by the rotation of the Globe and tidal forces of the Sun and the Moon. A final theory which predates the Plate Tectonics “paradigm”, has it that a gradual shrinking (contraction) or gradual expansion of the Globe is responsible.

We have written many articles about the North American Plate for Universe Today. Here’s an article about the continental plate, and here’s an article about the plate tectonics theory.

If you’d like more info on Earth, check out NASA’s Solar System Exploration Guide on Earth. And here’s a link to NASA’s Earth Observatory.

We’ve also recorded related episodes of Astronomy Cast about Plate Tectonics. Listen here, Episode 142: Plate Tectonics.

Sources:
http://en.wikipedia.org/wiki/North_American_Plate
http://en.wikipedia.org/wiki/Plate_tectonics
http://www.platetectonics.com/book/page_5.asp
http://www.uwgb.edu/dutchs/GeolColBk/NAmerPlate.HTM
http://en.wikipedia.org/wiki/Mantle_convection
http://en.wikipedia.org/wiki/Craton
http://en.wikipedia.org/wiki/Laurasia

How Much Does the Earth Weigh?

Winter Solstice
Earth as viewed from the cabin of the Apollo 11 spacecraft. Credit: NASA

Earth is, by any reckoning, a pretty big place. Ever since humanity first began the process of exploring, philosophers and scholars have sought to understand its exact dimensions. In addition to wanting to quantify its diameter, circumference, and surface area, they have also sought to understand just how much weight it packs on.

In terms of mass, Earth is also a pretty big customer. Compared to the other bodies of the Solar System, it is the largest and densest of the rocky planets. And over the course of the past few centuries, our methods for determining its mass have improved – leading to the current estimate of 5.9736×1024kg (1.31668×1025 lbs).

Size and Composition:

With a mean radius of 6,371.0 km (3,958.8 mi), Earth is the largest terrestrial planet in our Solar System. This means that it is composed primarily of silicate rock and metals, which are differentiated between a solid inner core, an outer core of molten metal, and a silicate mantle and crust made of silicate material.

This cutaway of planet Earth shows the familiar exterior of air, water and land as well as the interior: from the mantle down to the outer and inner cores. Currents in hot, liquid iron-nickel in the outer core create our planet's protective but fluctuating magnetic field. Credit: Kelvinsong / Wikipedia
This cutaway of planet Earth shows the familiar exterior of air, water and land as well as the interior: from the mantle down to the outer and inner cores. Credit: Kelvinsong / Wikipedia

Earth is composed approximately of 32% iron, 30% oxygen, 15% silicon, 14% magnesium, 3% sulfur, 2% nickel, 1.5% calcium, and 1.4% aluminum, with the remaining made up of trace elements. Meanwhile, the core region is primarily composed of iron (88.8%), with smaller amounts of nickel (5.8%), sulfur (4.5%), and less than 1% trace elements.

Mass and Density:

Earth is also the densest planet in the Solar System, with a mean density of 5.514 g/cm3 (0.1992 lbs/cu in). Between its size, composition, and the distribution of its matter, the Earth has a mass of 5.9736×1024 kg (~5.97 billion trillion metric tons) or 1.31668×1025 lbs (6.585 billion trillion tons).

But since the Earth’s density is not even throughout – i.e. it is denser towards the core than it is at its outer layers – its mass is also not evenly distributed. In fact, the density of the inner core (at 12.8 to 13.1 g/cm³; 0.4624293 lbs/cu in), while the density of the crust is just 2.2–2.9 g/cm³ (0.079 – 0.1 lbs/cu in).

The layers of the Earth, a differentiated planetary body. Credit: Wikipedia Commons/Surachit

This overall mass and density are also what causes Earth to have a gravitational pull equivalent to 9.8 m/s² (32.18 ft/s2), which is defined as 1 g.

History of Study:

Modern scientists discerned what the mass of the Earth was by studying how things fall towards it. Gravity is created by mass, so the more mass an object has, the more gravity it will pull with. If you can calculate how an object is being accelerated by the gravity of an object, like Earth, you can determine its mass.

In fact, astronomers didn’t accurately know the mass of Mercury or Venus until they finally put spacecraft into orbit around them. They had rough estimates, but once there were orbiting spacecraft, they could make the final mass calculations. We know the mass of Pluto because we can calculate the orbit of its moon Charon.

The Geoid 2005 model, which was based on data of two satellites (CHAMP and GRACE) plus surface data. Credit: GFZ

And by studying other planets in our Solar System, scientists have had a chance to improve the methods and instruments used to study Earth. From all of this comparative analysis, we have learned that Earth outstrips Mars, Venus, and Mercury in terms of size, and all other planets in the Solar System in terms of density.

In short, the saying “it’s a small world” is complete rubbish!

We have written many articles about Earth for Universe Today. Here’s Ten Interesting Facts About Earth, What is the Diameter of the Earth?, How Strong is the Force of Gravity on Earth?, What is the Rotation of the Earth?

If you’d like more info on Earth, check out NASA’s Solar System Exploration Guide on Earth. And here’s a link to NASA’s Earth Observatory.

We’ve also recorded an episode of Astronomy Cast all about planet Earth. Listen here, Episode 51: Earth.

Sources:

Solar Day

Winter Solstice
Earth as viewed from the cabin of the Apollo 11 spacecraft. Credit: NASA

[/caption]

Since the dawn of time, human beings have relied on the cycles of the sun, the moon, and the constellations through the zodiac in order to measure time. The most basic of these was the motion of the Sun as it traced an apparent path through the sky, beginning in the East and ending in the West. This procession, by definition, is what is known as a Solar Day. Originally, it was thought that this motion was the result of the Sun moving around the Earth, much like the Moon, celestial objects and stars seemed to do. However, beginning with Copernicus’ heliocentric model, it has since been known that this motion is due to the daily rotation of the earth around the Sun’s polar axis.

Up until the 1950’s, two types of Solar time were used by astronomers to measure the days of the year. The first, known as Apparent Solar Time, is measured in accordance with the observable motion of the Sun as it moves through the sky (hence the term apparent). The length of a solar day varies throughout the year, a result of the Earth’s elliptical orbit and axial tilt. In this model, the length of the day varies and the accumulated effect is a seasonal deviation of up to 16 minutes from the mean. The second type, Solar Mean Time, was devised as a way of resolving this conflict. Conceptually, Mean solar time is based on a fictional Sun that is considered to move at a constant rate of 360° in 24 hours along the celestial meridian. One mean day is 24 hours in length, each hour consisting of 60 minutes, and each minute consisting of 60 seconds. Though the amount of daylight varies significantly throughout the year, the length of a mean solar day is kept constant, unlike that of an apparent solar day.

The measure of time in both of these models depends on the rotation of the Earth. In both models, the time of day is not plotted based on the position of the Sun in the sky, but on the hour angle that it produces – i.e. the angle through which the earth would have to turn to bring the meridian of the point directly under the sun. Nowadays both kinds of solar time stand in contrast to newer kinds of time measurement, introduced from the 1950s and onwards which were designed to be independent of earth rotation.

We have written many articles about Solar Day for Universe Today. Here’s an article about how long a day is on Earth, and here’s an article about the rotation of the Earth.

If you’d like more info on Earth, check out NASA’s Solar System Exploration Guide on Earth. And here’s a link to NASA’s Earth Observatory.

We’ve also recorded an episode of Astronomy Cast all about planet Earth. Listen here, Episode 51: Earth.

Sources:
http://en.wikipedia.org/wiki/Solar_time
http://www.tpub.com/content/administration/14220/css/14220_149.htm
http://scienceworld.wolfram.com/astronomy/SolarDay.html
http://www.britannica.com/EBchecked/topic/553052/solar-time?anchor=ref144523
http://en.wikipedia.org/wiki/Hour_angle

Simple Colors Could Provide First Details of Alien Worlds

At best, the few extrasolar planets we have imaged directly are just points of light. But what can that light tell us about the planet? Maybe more than we thought. As you probably know the, Deep Impact spacecraft flew by comet Hartley 2 today, taking images from only 700 km away. But maneuvering to meet up with the comet is not the only job this spacecraft has been doing. The EPOXI mission also looked for ways to characterize extrasolar planets and the team made a discovery that should help identify distinctive information about extrasolar planets. How did they do it? By using the Deep Impact spacecraft to look at the planets in our very own solar system.

The spacecraft imaged the planetary bodies in our solar system — in particular the Earth, Mars and our Moon — (see here for movies of the Moon transiting Earth) and astronomer Lucy McFadden and UCLA graduate Carolyn Crow compared the reflected red, blue, and green light and grouped the planets according to the similarities they saw. The planets fall into very distinct regions on this plot, where the vertical direction indicates the relative amount of blue light, and the horizontal direction the relative amount of red light.

This suggests that when we do have the technology to gather light from individual exoplanets, astronomers could use color information to identify Earth-like worlds. “Eventually, as telescopes get bigger, there will be the light-gathering power to look at the colors of planets around other stars,” McFadden says. “Their colors will tell us which ones to study in more detail.”

On the plot, the planets cluster into groups based on similarities in the wavelengths of sunlight that their surfaces and atmospheres reflect. The gas giants Jupiter and Saturn huddle in one corner, Uranus and Neptune in a different one. The rocky inner planets Mars, Venus, and Mercury cluster off in their own corner of “color space.”

But Earth really stands out, and its uniqueness comes from two factors. One is the scattering of blue light by the atmosphere, called Rayleigh scattering, after the English scientist who discovered it. The second reason Earth stands out in color is because it does not absorb a lot of infrared light. That’s because our atmosphere is low in infrared-absorbing gases like methane and ammonia, compared to the gas giant planets Jupiter and Saturn.

“It is Earth’s atmosphere that dominates the colors of Earth,” Crow says. “It’s the scattering of light in the ultraviolet and the absence of absorption in the infrared.”

So, this filtering approach could provide a preliminary look at exoplanet surfaces and atmospheres, giving us an inkling of whether the planet is rocky or a gas planet, or what kind of atmosphere it has.

EPOXI is a combination of the names for the two extended mission components for the Deep Impact spacecraft: the first part of the acronym comes from EPOCh, (Extrasolar Planet Observations and Characterization) and the flyby of comet Hartley 2 is called the Deep Impact eXtended Investigation (DIXI).

Calculate the Effect of an Asteroid Impact on Earth

Impact Earth website

[/caption]

A 20-km asteroid has just been predicted to hit Earth and you want to know if a. You should run for it, b. You should call Bruce Willis, or c. You can rest easy because your part of the world won’t be affected. All you have to do is input the parameters of the asteroid on the recently updated “Impact Earth” website, and you’ll find out everything about what an impactor will do to Earth, including an estimate of the size of the crater, how far away you’ll need to be in order to avoid being affected by the impact (and if that is possible), tsunami wave height, and other details of the subsequent disaster. The fun part is, you can simulate the destruction of Earth multiple times, without hurting anyone.

The original Impact Earth website was created in 2002 for use by NASA and homeland security. The new version, built in a collaboration between Purdue University and Imperial College London, is more user-friendly for the general public, as well as providing more visual details of an impact. Besides being rather fun to play around with, the website is highly educational about what a various sized impacts would do Earth, depending on if it hit ground or water.

Go play around with it.

Best of Earth from the ISS

Fire scars in Australia are featured in this image photographed by an Expedition 5 crewmember on the International Space Station (ISS). Bright orange fire scars show up the underlying dune sand in the Simpson Desert, Credit: NASA

The International Space Station has been orbiting the Earth every day for over 10 years, and the astronauts all say their favorite pastime is looking at the Earth. During the past 10 years, the crews have taken some great pictures of our planet, and these images provide a unique look at our world. These are just a few of the spectacular views of Earth from the space station.

Continue reading “Best of Earth from the ISS”

How Does a Compass Work

How Does a Compass Work
Pocket Compass. Image Credit: Solar Navigator

[/caption]

Compasses are some of the oldest navigational tools in history. Since Mankind started to understand more about Navigation they have been crucial to major feats of navigation such as the first transoceanic voyages and the circumnavigation of the globe. None of this would be possible without the aid of the compass in performing navigation calculations over long distances. Early explorers had to use local landmarks and the stars to navigate. This made it very difficult to travel to far or unknown destinations. Compasses were one of the key breakthroughs that made such voyages a reality. So how does a compass work?

A compass works by detecting the Earth’s natural magnetic fields. The Earth has an iron core that is part liquid and part solid crystal due to gravitational pressure. It is believed that movement in the liquid outer core is what produces the Earth’s magnetic field. Like all magnetic fields the Earth’s magnetic field has two main poles, a north and south pole. These magnetic poles are slightly off from the Earth’s axis rotation which is used as the basis of the geographic poles, but they are close enough that the general directions with adjustments for the polar difference, called a declination, can be used for navigation.

Essentially a compass is a light weight magnet, generally a magnetized needle, on a free rotating pivot. This allows the needle to better react to nearby magnetic fields. Since opposites attract the southern pole of the needle is attracted to the Earth’s natural magnetic north pole. This is how navigators are able to discern north. The Earliest compasses were water compasses invented by the Chinese during the Song dynasty. These were a magnetized piece of metal floating in a bowl of water. The water provides the first frictionless pivot needed for making a working compass.

The compass later came into common use in the west during the 14th century AD. This led to what is now known as the Age of Exploration where major European powers started further exploration of the World including North and South America. While the compass was just one of the devices that brought about this golden age of exploration it played an important part in bring it to pass. Even now modern navigation to some point still relies on compasses and the more accurate maps they helped to develop.

We have written many articles about the compass for Universe Today. Here’s an article about the inventions of Galileo, and here’s an article about bar magnets.

If you’d like info on Earth’s magnetic field, check out NASA’s Solar System Exploration Guide on Earth. And here’s a link to NASA’s Earth Observatory.

We’ve also recorded an episode of Astronomy Cast all about Magnetism. Listen here, Episode 42: Magnetism Everywhere.

Sources:
USGS
How Stuff Works

Last Day of Summer

Winter Solstice
Earth as viewed from the cabin of the Apollo 11 spacecraft. Credit: NASA

Summertime is a joyous time for so many reasons. There’s the sense of vacation, that feeling of freedom we remember so fondly from our childhoods. There’s the warmth weather, the sunshine, the early mornings and cool, late evenings. Seriously, there’s nothing wrong with summer, except the unfortunate fact that sooner or later, it has to end.

But when exactly is the very last day of summer? Well, it differs from place to place, depending on your location, whether you are north or south of the equator and by how much. But in the Northern Hemisphere, the change in seasons occurred on September 22nd for the year of 2010. In the Southern Hemisphere, it took place on February 28th.

In order to understand why this date was pegged as the end of the season, we need to understand exactly how the season itself is measured. These have to do with the equinoxes and solstices, seasonal markers that occur twice a year respectively. From an astronomical point of view, the equinoxes and solstices are in the middle of the respective seasons, but a variable seasonal lag means that the meteorological start of the season, which is based on average temperature patterns, occurs several weeks later than the start of the astronomical season.

According to meteorologists, summer extends for the whole months of June, July and August in the northern hemisphere and the whole months of December, January and February in the southern hemisphere. Interestingly enough, in this hemisphere, the end of the summer season is also dependent on whether or not it is a leap year (during leap years, an extra day is added).

In North America, summer is often fixed as the period from the summer solstice (June 20 or 21, depending on the year) to the fall equinox (September 22 or 23, again depending on the year). Therefore, Sept. 22 was the last day of summer and the beginning of the 2010 autumnal equinox, which officially began at 11:09 p.m. EST., the full moon having peaked the following morning at 5:17 a.m. EST which marked it as the first day of fall in the Northern Hemisphere.

The moon closest to the September equinox is considered the “Harvest Moon.” Its name stems from when farmers would rely on the light to work in the fields as the days grew shorter. For the first time since 1991, the full moon fell on the equinox, creating a “Super Harvest Moon.” In the Southern Hemisphere, the last day of summer was February 28th since 2010 was not a leap year.

We have written many articles about Summer for Universe Today. Here’s an article about the summer solstice, and here’s an article about the Earth seasons.

If you’d like more info on Earth, check out NASA’s Solar System Exploration Guide on Earth. And here’s a link to NASA’s Earth Observatory.

We’ve also recorded an episode of Astronomy Cast all about planet Earth. Listen here, Episode 51: Earth.

Sources:
http://en.wikipedia.org/wiki/Summer
http://www.tonic.com/article/last-day-of-summer-first-night-of-fall-super-harvest-moon/
http://en.wikipedia.org/wiki/Equinox
http://en.wikipedia.org/wiki/Solstice
http://wiki.answers.com/Q/What_is_the_last_day_of_summer_in_Southern_Hemisphere