Global Temperatures Continue to Rise

This map represents global temperature anomalies averaged from 2008 through 2012. Credit: NASA Goddard Institute for Space Studies/NASA Goddard's Scientific Visualization Studio.

This week, scientists at NASA released their global climate analysis for 2012 which revealed that Earth continues to experience warmer temperatures than several decades ago. The past year was the ninth warmest year on record since 1880, continuing what appears to be a long-term global trend of rising temperatures. The ten warmest years in the 132-year record have all occurred since 1998, and the last year that was cooler than average was 1976. The hottest years on record were 2010 and 2005.

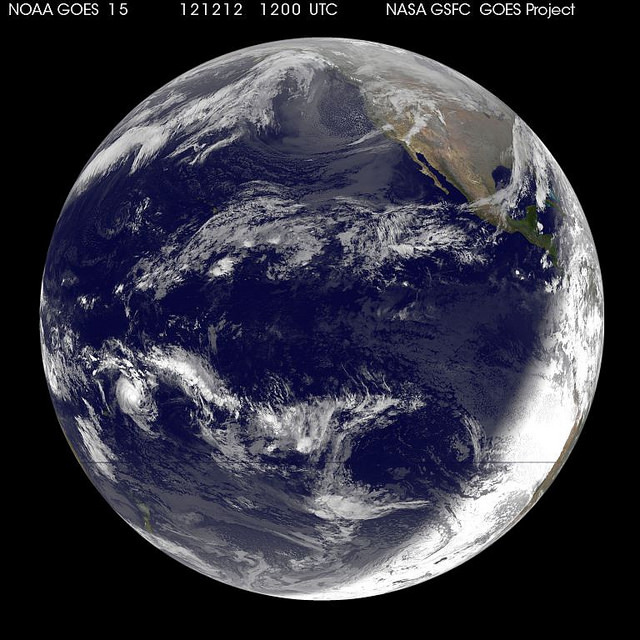
The analysis was done by NASA’s Goddard Institute for Space Studies (GISS) which monitors global surface temperatures on an ongoing basis, comparing temperatures around the globe to the average global temperature from the mid-20th century.

In 2012, the average temperature was about 14.6 degrees Celsius (58.3 degrees Fahrenheit). This is .55 degrees C (1.0 degree F) warmer than the mid-20th century baseline, with the global average temperature having risen about 0.8 degrees C (1.4 degrees F) since 1880. The majority of that change has occurred in the past forty years.

Additionally, last week the US National Climatic Data Center (NCDC) released their latest climate report from 2012 and found that it was the warmest year ever recorded in the contiguous United States. The average temperature for the contiguous United States for 2012 was 13 degrees C (55.3 degrees F) which was 3.2°F above the 20th century average.

The map depicts temperature anomalies, or changes, by region in 2012; while the line plot above shows yearly temperature anomalies from 1880 to 2011 as recorded by NASA GISS, the National Oceanic and Atmospheric Administration (NOAA) National Climatic Data Center, the Japanese Meteorological Agency, and the Met Office Hadley Centre in the United Kingdom. NASA Goddard Institute for Space Studies.

The data was gathered by NASA GISS, the National Oceanic and Atmospheric Administration (NOAA) National Climatic Data Center, the Japanese Meteorological Agency, and the Met Office Hadley Centre in the United Kingdom. All four institutions tally temperature data from stations around the world and make independent judgments about whether the year was warm or cool compared to other years. Though there are minor variations from year to year, all four records show peaks and valleys in sync with each other. All show rapid warming in the past few decades, and all show the last decade as the warmest.

Scientists emphasize that weather patterns cause fluctuations in average temperatures from year to year, but the continued increase in greenhouse gas levels in the atmosphere assures that there will be a long-term rise in global temperatures. Each individual year will not necessarily be warmer than the previous year, but scientists expect each decade to be warmer than the previous decade.

“One more year of numbers isn’t in itself significant,” GISS climatologist Gavin Schmidt said. “What matters is this decade is warmer than the last decade, and that decade was warmer than the decade before. The planet is warming. The reason it’s warming is because we are pumping increasing amounts of carbon dioxide into the atmosphere.”

See an interactive global temperature map from New Scientist.

Carbon dioxide traps heat and largely controls Earth’s climate. It occurs naturally but is also released by the burning of fossil fuels for energy. The level of carbon dioxide in Earth’s atmosphere has been rising consistently for decades, largely driven by increasing man-made emissions. The carbon dioxide level in the atmosphere was about 285 parts per million in 1880, the first year of the GISS temperature record. By 1960, the atmospheric carbon dioxide concentration, measured at NOAA’s Mauna Loa Observatory, was about 315 parts per million. Today, that measurement exceeds 390 parts per million.

The continental U.S. endured its warmest year on record by far, according to NOAA, the official keeper of U.S. weather records. NOAA also announced that global temperatures were 10th warmest on record by their analysis methods.

“The U.S. temperatures in the summer of 2012 are an example of a new trend of outlying seasonal extremes that are warmer than the hottest seasonal temperatures of the mid-20th century,” NASA GISS director James E. Hansen said. “The climate dice are now loaded. Some seasons still will be cooler than the long-term average, but the perceptive person should notice that the frequency of unusually warm extremes is increasing. It is the extremes that have the most impact on people and other life on the planet.”

For more explanation of how the analysis works, read World of Change: Global Temperatures (pdf).

Sources: NASA, NASA’s Earth Observatory

What Craters on the Moon Teach Us About Earth

When the Moon was receiving its highest number of impacts, so was Earth. Credit: Dan Durda

Some questions about our own planet are best answered by looking someplace else entirely… in the case of impact craters and when, how and how often they were formed, that someplace can be found shining down on us nearly every night: our own companion in space, the Moon.

By studying lunar impact craters both young and old scientists can piece together the physical processes that took place during the violent moments of their creation, as well as determine how often Earth — a considerably bigger target — was experiencing similar events (and likely in much larger numbers as well.)

With no substantial atmosphere, no weather and no tectonic activity, the surface of the Moon is a veritable time capsule for events taking place in our region of the Solar System. While our constantly-evolving Earth tends to hide its past, the Moon gives up its secrets much more readily… which is why present and future lunar missions are so important to science.

linne_shade_scalebTake the crater Linné, for example. A young, pristine lunar crater, the 2.2-km-wide Linné was formed less than 10 million years ago… much longer than humans have walked the Earth, yes, but very recently on lunar geologic terms.

It was once thought that the circular Linné (as well as other craters) is bowl-shaped, thus setting a precedent for the morphology of craters on the Moon and on Earth. But laser-mapping observations by NASA’s Lunar Reconnaissance Orbiter (at right) determined in early 2012 that that’s not the case; Linné is actually more of a truncated inverted cone, with a flattened interior floor surrounded by sloping walls that rise up over half a kilometer to its rim.

On our planet the erosive processes of wind, water, and earth soon distort the shapes of craters like Linné, wearing them down, filling them in and eventually hiding them from plain sight completely. But in the Moon’s airless environment where the only weathering comes from more impacts they retain their shape for much longer lengths of time, looking brand-new for many millions of years. By studying young craters in greater detail scientists are now able to better figure out just what happens when large objects strike the surface of worlds — events that can and do occur quite regularly in the Solar System, and which may have even allowed life to gain a foothold on Earth.

Most of the craters visible on the Moon today — Linné excluded, of course — are thought to have formed within a narrow period of time between 3.8 and 3.9 billion years ago. This period, called the Late Heavy Bombardment, saw a high rate of impact events throughout the inner Solar System, not only on the Moon but also on Mars, Mercury, presumably Venus and Earth as well. In fact, since at 4 times its diameter the Earth is a much larger target than the Moon, it stands to reason that Earth was impacted many more times than the Moon as well. Such large amounts of impacts introduced material from the outer Solar System to the early Earth as well as melted areas of the surface, releasing compounds like water that had been locked up in the crust… and even creating the sorts of environments where life could have begun to develop and thrive.

(It’s been suggested that there was even a longer period of heavy impact rates nicknamed the “late late heavy bombardment” that lingered up until about 2.5 billion years ago. Read more here.)

In the video below lunar geologist David Kring discusses the importance of impacts on the evolution of the Moon, Earth and eventually life as we know it today:

“Impact cratering in Earth’s past has affected not only the geologic but the biologic evolution of our planet, and we were able to deduce that in part by the lessons we learned by studying the Moon… and you just have to wonder what other things we can learn by going back to the Moon and studying that planetary body further.”

– David Kring

David is a senior staff scientist at the Lunar and Planetary Institute in Houston, TX.

It’s these sorts of connections that make lunar exploration so valuable. Keys to our planet’s past are literally sitting on the surface of the Moon, a mere 385,000 km away, waiting for us to just scoop them up and bring them back. While the hunt for a biological history on Mars or resource-mining an asteroid are definitely important goals in their own right, only the Moon holds such direct references to Earth. It’s like an orbiting index to the ongoing story of our planet — all we have to do is make the connections.


Learn more about lunar research at the LPI site here, and see the latest news and images from LRO here.

Astronaut Captures Incredible Images of Australian Bush Fires

Lines of scorched earth and huge smoke plumes from wild fires in Australia were visible from the International Space Station on January 8, 2013. Credit: NASA/Chris Hadfield

Intense wild fires, or bush fires as they are called in Australia, are burning out of control across southeast Australia with authorities describing the condition as “catastrophic.” The huge fires were easily visible from the International Space Station on Tuesday and onboard, Canadian astronaut Chris Hadfield has been watching from above.

See more of his images below:

A long line of bush fires range in Australia, and are visible from space. Credit: NASA/Chris Hadfield

Officials say more than 130 fires, many uncontained, are burning in the heavily populated New South Wales state, where dry conditions are fueling the fires as temperatures reached 45 degrees and wind gusts reached more than 100 kilometers per hour.

Huge plumes of smoke from bush fires in Australia were visible from the International Space Station. Credit: NASA/Chris Hadfield.

In Tasmania, an island south of Australia, rescue officials are still trying to locate around 100 residents who have been missing after a fire tore through a village, destroying dozens of homes. You can see images from the Moderate Resolution Imaging Spectroradiometer (MODIS) on NASA’s Terra satellite that were taken on January 7, 2013 at the Earth Observatory website.

Follow Chris Hadfield on Twitter to see more images.

Additional information on the bush fires from Voice of America

The Paranal and the Shadow of the Earth

This beautiful photo, taken by ESO photo ambassador Babak Tafreshi, shows the European Southern Observatory’s Very Large Telescope array and VISTA telescope atop the peaks of the Cerro Paranal in Chile’s Atacama Desert. In the distance the Earth’s shadow extends outward toward the horizon, divided from the bluer daytime sky by the dusky pink “Belt of Venus.”

At an altitude of 2,635 meters (8,645 feet) the Paranal looks down onto a sea of clouds covering the Pacific Ocean, visible at right, whose shores lie 12 km in the distance.

Image credit: ESO/B. Tafreshi (twanight.org

What Earth Looked like on 12/12/12

Earth, as seen by the GOES15 satellite on December 12, 2012. Credit: NASA/NOAA GOES Project/Dennis Chesters

Although we don’t subscribe to hokum like numerology or think that dates on a man-made calendar could have any sort of cosmic significance, there is something about a little symmetry. The GOES-15 satellite captured this image of Earth today, which is 12/12/12 on the Gregorian calendar, and even added a bonus of taking the image at 1200 UTC.

Too bad the GOES-12 spacecraft had some thruster problems and is currently in a standby mode.

Dennis Chesters, project scientist of NASA’s GOES Project at the NASA Goddard Space Flight Center said this image does something significant, however: the fourth tropical cyclone in the southern Pacific Ocean. Newborn Tropical Storm Evan was born today, Dec. 12, 2012 at 1500 UTC (10 a.m. EST) and appears as a rounded area of clouds in the bottom left corner of the image. Tropical Storm Evan is about 145 nautical miles west of Pago Pago, American Samoa.

See a larger version of this image here.

“Overview:” The Perspective-Altering Effect of Seeing Earth from Space

For over 40 years, the ‘Blue Marble’ images of Earth taken from space have provided a new perspective of our planet, and the sometimes life-altering experience of such views was described in Frank White’s book “The Overview Effect,” published in 1987. When it came out, I gobbled it up, and have since read it several times.

Today, on the 40th anniversary of the final launch of the Apollo missions to the Moon, a new short film “Overview” has been released, which explores this phenomenon through interviews with five astronauts who have experienced first-hand seeing Earth from space.

“This view of the Earth from space – the whole Earth perspective – is, I think, the true symbol of this age,” says White in the film. “I believe … there’s going to be a greater and greater interest in communicating this idea because, after all, it’s key to our survival. We have to start acting as one species with one destiny. We are not going to survive if we don’t do that.”

The film is an inspiring look at how exploring space has given us look back at our own world and changed our perceptions. While some may say the Overview Effect is only a concept, an ideal outcome of space exploration that has yet to become a global phenomenon, I believe it is certainly something we should strive for.

The Blue Marble image from Apollo 17. Credit: Image courtesy NASA Johnson Space Center. See more info about it here.

The film includes:
Edgar Mitchell – Apollo 14 astronaut and founder of the Institute of Noetic Sciences
Ron Garan – ISS astronaut and founder of humanitarian organization Fragile Oasis
Nicole Stott – Shuttle and ISS astronaut and member of Fragile Oasis
Jeff Hoffman – Shuttle astronaut and senior lecturer at MIT
Shane Kimbrough – Shuttle/ISS astronaut and Lieutenant Colonel in the US Army
Frank White – space theorist and author of the book ‘The Overview Effect’
David Loy- philosopher and author
David Beaver – philosopher and co-founder of The Overview Institute

It was produced by a group called Planetary Collective, specifically Guy Reid, Steve Kennedy and Christopher Ferstad.

OVERVIEW from Planetary Collective on Vimeo.

Pale Blue Dot: an Animated Contemplation

Every now and then, someone takes Carl Sagan’s wonderful reading of his iconic “Pale Blue Dot” narrative and turns it into an animated presentation, usually combining images and video footage of space exploration and Earthly vistas to create something undeniably spellbinding (Sagan’s narratives do have a tendency to have that effect!) Artist Adam Winnik went a slightly different route, however, creating an illustrated animation to go along with Sagan’s reading for his thesis project in 2011. The result is no less poignant… check it out above.

See more of Adam’s work on his website here.

Video: Adam Winnik. Music: Hans Zimmer “You’re So Cool”

The Black Marble: Stunning New Orbital Views of Earth at Night

This image of Asia and Australia at night is a composite assembled from data acquired by the Suomi NPP satellite in April and October 2012. Credit: NASA, NOAA, and the Department of Defense.

Two months of night-time imagery gathered by the Suomi NPP satellite have resulted in a stunning new look at Earth at night, appropriately nicknamed the Black Marble.

The nighttime views were made possible by the new satellite’s “day-night band” of the Visible Infrared Imaging Radiometer Suite. VIIRS detects light in a range of wavelengths from green to near-infrared and uses filtering techniques to observe dim signals such as city lights, gas flares, auroras, wildfires, and reflected moonlight. In this case, auroras, fires, and other stray light have been removed to emphasize the city lights.

“This is not your father’s low light sensor!” said Steve Miller, senior research scientist and deputy director of the Cooperative Institute for Research in the Atmosphere (CIRA), Colorado State University, speaking at the American Geophysical Union conference this week.

See more views and a video presentation of the VIIRS data below:

The new satellite is providing a much higher resolution across a greater band of light than previous night-light gathering satellites.

Originally developed for meteorologists to be able to look at nighttime clouds, the VIIRS data is providing a wide variety of information. “We are getting as much mileage from these data sets as we can,” said Chris Elvidge, who leads the Earth Observation Group at NOAA’s National Geophysical Data Center.

Elvidge and Miller said the data is being used to model population distribution, fossil fuel and CO2 emissions, and other information that can be gleaned from nighttime lights such finding power outages, determining astronomical viewing conditions, providing site selection for astronomical observatories, and looking at impacts of artificial lights on humans and animals.

The difference between electrical lights and fires, and night glow and auroras can even be determined by VIIRS.

North and South America at night is a composite assembled from data acquired by the Suomi NPP satellite in April and October 2012. Credit: NASA, NOAA, and the Department of Defense.

Europe, Africa, and the Middle East at night is a composite assembled from data acquired by the Suomi NPP satellite in April and October 2012. Credit: NASA, NOAA, and the Department of Defense.

Named for satellite meteorology pioneer Verner Suomi, NPP flies over any given point on Earth’s surface twice each day at roughly 1:30 a.m. and p.m. The polar-orbiting satellite flies 824 kilometers (512 miles) above the surface, sending its data once per orbit to a ground station in Svalbard, Norway, and continuously to local direct broadcast users distributed around the world,
.

See more imagery and get additional information about the night-time VIIRS Data at the NASA Earth Observatory website.

In the Shadow of the Moon: Experience a Solar Eclipse From 37 Kilometers Up

The Moon’s shadow stretches over the Earth in this balloon-mounted camera view of the November 14 solar eclipse (Catalin Beldea, Marc Ulieriu, Daniel Toma et. al/Stiinta&Tehnica)

On November 14, 2012, tens of thousands of viewers across northeastern Australia got a great view of one of the most awe-inspiring sights in astronomy — a total solar eclipse. Of course many fantastic photos and videos were taken of the event, but one team of high-tech eclipse hunters from Romania went a step further — or should I say higher — and captured the event from a video camera mounted on a weather balloon soaring over 36,800 meters (120,000 feet) up!

Their video can be seen below:

During a solar eclipse the Moon passes in front of the disk of the Sun, casting its shadow upon the Earth. Any viewers within the darkest part of the shadow — the umbra — will experience a total eclipse, while those within the wider, more diffuse shadow area along the perimeter — the penumbra — will see a partial eclipse.

By launching a weather balloon carrying a wide-angle camera into the stratosphere above Queensland, eclipse hunter and amateur astronomer Catalin Beldea, ROSA research scientist Florin Mingireanu and others on the team were able to obtain their incredible video of the November 14 total eclipse from high enough up that the shadow of the Moon was visible striking Earth’s atmosphere. Totality only lasted a couple of minutes so good timing was essential… but they got the shot. Very impressive!

The mission was organized by teams from the Romanian Space Agency (ROSA) and  Stiinta&Tehnica.com, with the video assembled by Daniel Toma and posted on YouTube by editor-in-chief Marc Ulieriu. Music by Shamil Elvenheim.

A Branching “Tree” of Solar Plasma

Hydrogen-alpha photo of the Sun by Alan Friedman

An enormous tree-shaped prominence spreads its “branches” tens of thousands of miles above the Sun’s photosphere in this image, a section of a photo acquired in hydrogen alpha (Ha) by Alan Friedman last week from his backyard in Buffalo, NY.

Writes Alan on his blog, “gotta love a sunny day in November!”

Check out the full image — along with an idea of just how big this “tree” is — after the jump:

Taken through a special solar telescope and a Grasshopper CCD camera, Alan’s gorgeous solar photos show the Sun in a wavelength absorbed by atomic hydrogen — most present in the photosphere and chromosphere — thus revealing the complex and dynamic activity of the Sun’s “surface”.

Here’s the full image:

The dark circle at upper left (added by me) shows approximately the scale size of Earth (12,756 km, or about 7,926 miles diameter.) As you can see, that particular prominence is easily six times that in altitude, and spreads out many more times wider… and this isn’t even a particularly large prominence! As far as solar activity goes, this is a non-event. (Not like what was seen by SDO on Nov. 16!)

Regardless, it makes for an impressive backyard photo.

Check out more of Alan’s photos on his blog and on his website, AvertedImagination.com. Many of his photos, some of which have been shown at galleries across the U.S., are available as limited-edition prints. (Alan also runs a greeting card print studio.) I’ve found that he usually shares at least a couple of fantastic solar shots every month, if not more.

Image © Alan Friedman. All rights reserved. Used with permission.