Spectacular Footage, Satellite Images of Eyjafjallajokull Volcano in Iceland

NASA's Terra Satellite captured this image on April 15, 2010 of the volcano and resulting ash plume. NASA image by Jeff Schmaltz, MODIS Rapid Response Team at NASA GSFC.

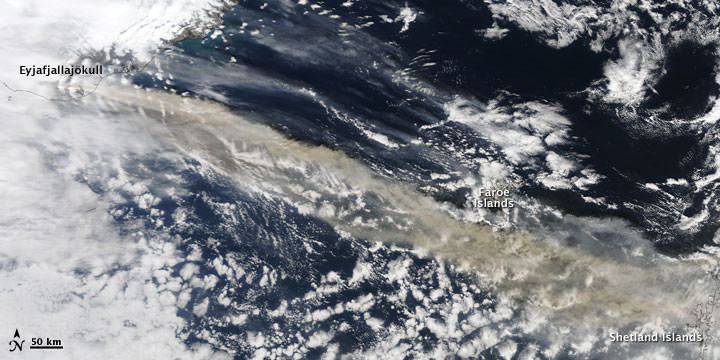
A volcano under a glacier in Iceland erupted Wednesday, melting ice, shooting smoke and steam into the air and forcing hundreds of people to leave their homes. The resulting ash plume has also halted air traffic over much of Europe. Scientists said the eruption under the ice cap was 10 to 20 times more powerful than an eruption from the that happened from the Eyjafjallajokullin Volcano late last month. “This is a very much more violent eruption because it’s interacting with ice and water,” said Andy Russell, an expert in glacial flooding at the University of Newcastle in northern England, in an article on the CBC website. The dramatic footage in the video here was released today, April 15, and satellite images, below, show how far the ash plume has traveled.

[/caption]

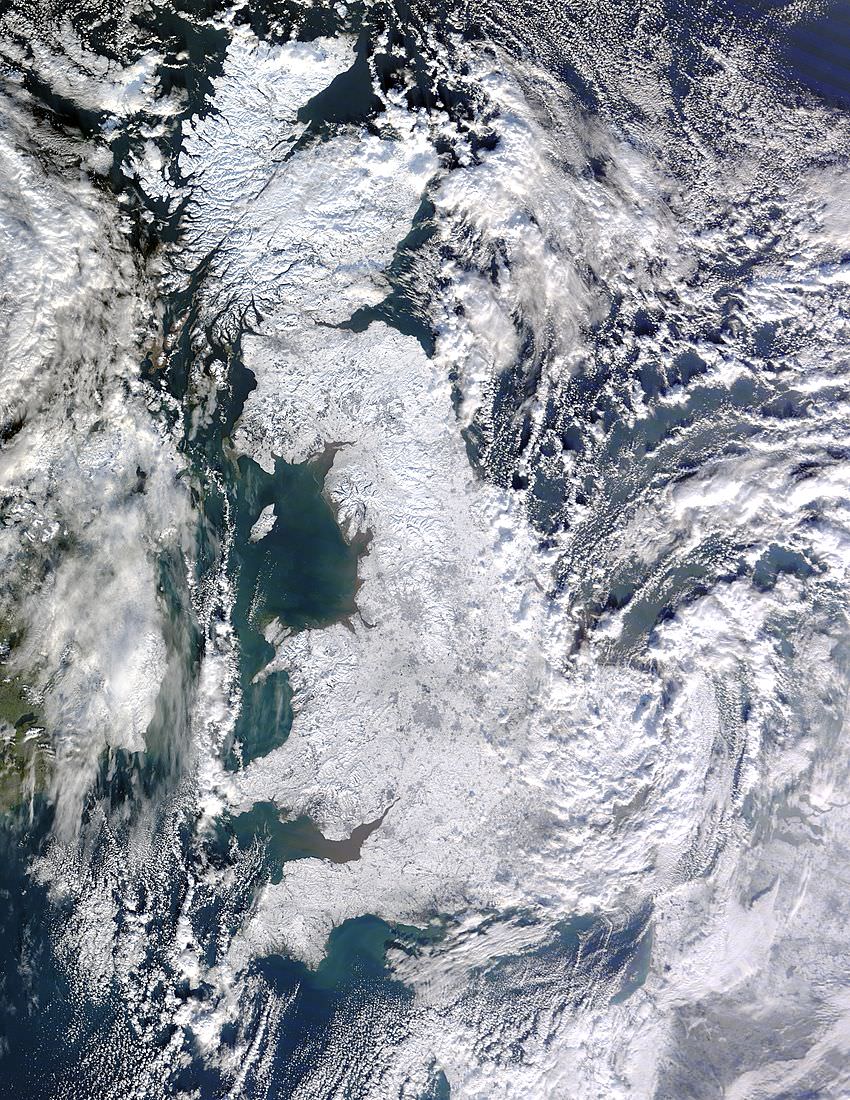
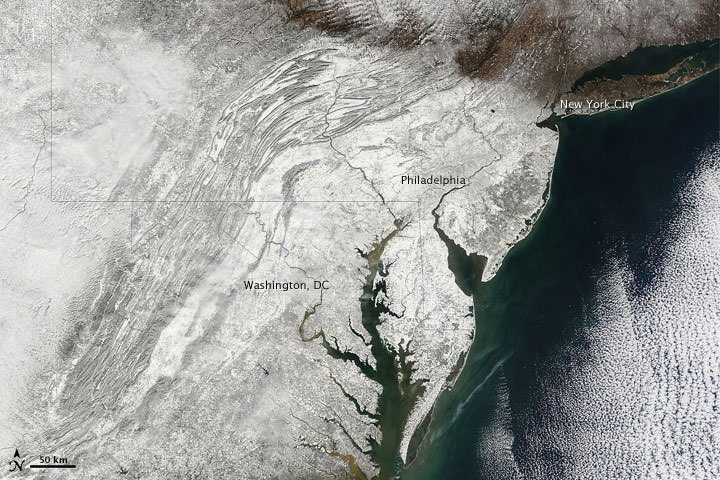
The iceland volcano sent a plume of ash and steam across the North Atlantic prompting airspace closures in the United Kingdom, Ireland, France, and Scandinavia, which then had a ripple effect, disrupting flights to and from other countries as well. Authorities could not say how long the airspace closure would last, and the ash’s spread threatened to force closures of additional airspace over the coming days.

NASA's EO-1 Satellite took this image on April 1, 2010. NASA image by Robert Simmon, using ALI data from the EO-1 team

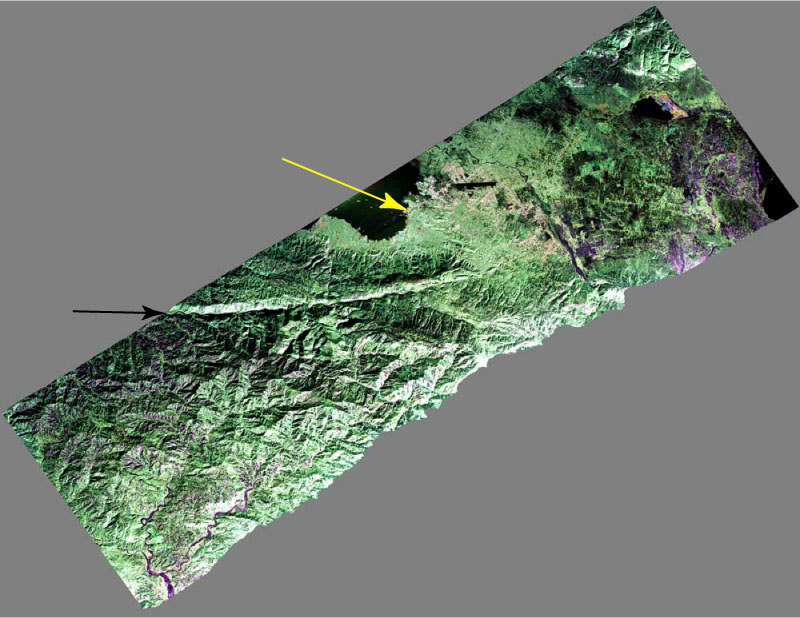
This natural-color satellite image shows the area of the eruption on April 1, when a new vent opened up. The image was acquired by the Advanced Land Imager (ALI) aboard NASA’s Earth Observing-1 (EO-1) satellite.

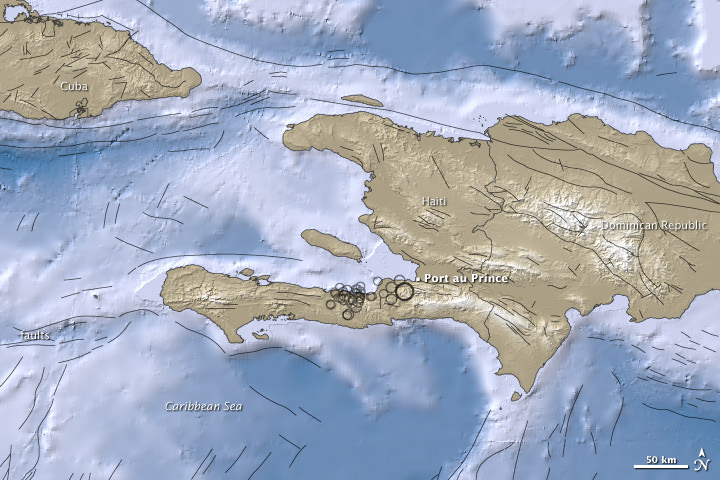
The volcano, about 120 kilometres east of Reykjavik, erupted March 20 after almost 200 years of silence.

Watch an animation from ESA of how the plume traveled.

Pall Einarsson, a geophysicist at the University of Iceland, said magma was melting a hole in the thick ice covering the volcano’s crater, sending water coursing down the glacier, and causing widespread flooding.

Iceland’s main coastal ring road was closed near the volcano, and workers smashed a hole in the highway in a bid to give the rushing water a clear route to the coast and prevent a major bridge from being swept away.

Sources: CBC, NASA Earth Observatory, ESA

Unmanned Robo-Plane Makes First Science Observations

The Global Hawk is a robotic plane that can fly autonomously to study Earth’s atmosphere, and can get to the area called the “Ignorosphere” that previously hasn’t been studied very well. The plane is carrying 11 instruments, and recently made its first science flight over the Pacific Ocean. “The Global Hawk is a fantastic platform because it gives us expanded access to the atmosphere beyond what we have with piloted aircraft,” said David Fahey, co-mission scientist and a research physicist at NOAA’s Earth System Research Laboratory in Boulder, Colo. “We can go to regions we couldn’t reach or go to previously explored regions and study them for extended periods that are impossible with conventional planes.”
Continue reading “Unmanned Robo-Plane Makes First Science Observations”

Best “Blue Marble” Images Yet

Our "Blue Marble." Credit: NASA

[/caption]

The Goddard Space Flight Center has a Flickr account showcasing a series of images of our own home planet. Called “Blue Marble,” these spectacular images are the most detailed true-color image of the entire Earth to date. Using a collection of satellite-based observations, scientists and visualizers stitched together months of observations in 2001 of the land surface, oceans, sea ice, and clouds into a seamless, true-color mosaic of every square kilometer (.386 square mile) of our planet. Your tax dollars at work, these images are freely available to educators, scientists, museums, and the public. This record includes preview images and links to full resolution versions up to 21,600 pixels across.

Our blue marble. Credit: NASA

Compare these new images to the original “Blue Marble” photograph, below, taken by the Apollo 17 crew in 1968.

The original Blue Marble by Apollo 17.

ISS Astronaut Sends Twitpics of Chile Earthquake Aftermath

Santiago, the capital city of Chile. One day after the Mega earthquake(M8.8) hit the country. We wish the earliest recovery. Credit: Soichi Noguchi

[/caption]
Astronaut Soichi Noguchi, (@Astro_Soichi) who has taken full advantage of being able to use Twitter live from the International Space Station, has been sending down a stream of images he has taken of Chile following the magnitude 8.8 earthquake that hit the country early Saturday. Just recently, he posted the above image, taken directly over Santiago. “Santiago, the capital city of Chile. One day after the Mega earthquake(M8.8) hit the country. We wish the earliest recovery,” Noguchi wrote on Twitter. He also took a video of the ISS astronaut’s view as they flew over Chile earlier today, below.

Here’s another image Noguchi took from the ISS, of the coastline of Chile, near Santiago.

Near Santiago, Chile. Coast line. Credit: Soichi Noguchi

And another, near Concepcion, Chile.

Coastline near Concepcion, Chile. Credit: Soichi Noguchi

For more images from space, follow @Astro_Soichi on Twitter.

With a Name Like GOES-P, This Satellite Has to be Good

The final spacecraft in this series of NASA and NOAA’s “GOES” geostationary environmental weather satellites is ready for launch. GOES stands for Geostationary Operational Environmental Satellite, and in evidence that not all acronyms turn out for the best, this latest satellite in the series is GOES-P. But (to quote the Bad Astronomer) this satellite will be a whiz in helping to provide continuous observations of severe weather events on Earth and space weather, too, as well as providing an update to search and rescue capabilities. Once in orbit GOES-P’s name will change to GOES-15. “GOES are the backbone of NOAA’s severe weather forecasts, monitoring fast-changing conditions in the atmosphere that spawn hurricanes, tornadoes, floods and other hazards,” said Steve Kirkner, GOES program manager at NASA’s Goddard Space Flight Center.

Launch is targeted for March 2, during a launch window from 6:19 to 7:19 p.m. EST from Space Launch Complex 37 at the Cape Canaveral Air Force Station on a Delta IV rocket. Universe Today will be on location to provide coverage of all the launch and pre-launch activities. Follow Nancy on Twitter for live updates.

“The latest series of satellites, GOES- N, O, and P has new capabilities in space weather,” said Dr. Howard Singer from NOAA. “This is data that arrives almost instantaneously and therefore allows us to provide very timely alerts and warnings.”

But GOES-P will be a back-up satellite. Once launched, it will be checked out and then stored on-orbit and ready for activation should one of the operational GOES satellites degrade or exhaust their fuel. Currently, NOAA operates GOES-12, (GOES East) and GOES-11 (GOES-West.) In late April, NOAA will activate GOES-13 to replace GOES-12, and move GOES-12 to provide coverage for South America as part of the Global Earth Observing System of Systems (GEOSS). NASA handed over GOES-14, launched last June, to NOAA on December 14, 2009.

In addition to weather forecasting on Earth, a key instrument onboard GOES-P, the Solar X-Ray Imager (SXI), will help NOAA continue monitoring solar conditions.

“The SXI is improving our forecasts and warnings for solar disturbances, protecting billions of dollars worth of commercial and government assets in space and on the ground, and lessening the brunt of power surges for the satellite-based electronics and communications industry,” said Tom Bodgan, director of NOAA’s Space Weather Prediction Center (SWPC) in Boulder, Colo.

GOES P is the last in the series. The first GOES satellite was launched in 1975.

GOES-P joins a system of weather satellites that provide timely environmental information to meteorologists and the public. The GOES system provides data used to graphically display the intensity, path and size of storms. Early warning of impending severe weather enhances the public’s ability to take shelter and protect property.

You can find launch status and a countdown here.

Source: NASA

Satellite View of “Snowmageddon”

The big snowfall of February 2010 as seen from space. Credit: MODIS Rapid Response Team at NASA GSFC.

[/caption]

Did you live through what has been called “snowmageddon” or “snowpocalypse?” Here’s a satellite’s-eye view of the exceptionally severe winter storm in the Eastern US that dropped several feet of snow on Feb. 6 and 7. Reports of crashed and abandoned cars and hundreds of cancelled flights were interspersed with stories of massive snowball fights. The huge snowfall may hinder highway traffic into midweek, and hundreds of thousands lost electricity. The image comes from the Moderate Resolution Imaging Spectroradiometer (MODIS) on NASA’s Terra satellite. Snow blankets the area hundreds of kilometers inland from the Atlantic coastline.

Source: NASA Earth Observatory

NASA Radar Captures its First Haiti Image

False-color composite image of the Port-au-Prince, Haiti region, taken Jan. 27, 2010 by NASA’s UAVSAR airborne radar. The city is denoted by the yellow arrow; the black arrow points to the fault responsible for the Jan. 12 earthquake. Image credit: NASA

[/caption]

A modified NASA Gulfstream III aircraft began a three-week campaign to provide a close-up study of the fault lines in Haiti with radar. This first image, captured on Jan. 27, 2010 is a false-color composite image of the city of Port-au-Prince, Haiti, (near the center of the image) and the surrounding region. This image and subsequent images taken by the Uninhabited Aerial Vehicle Synthetic Aperture Radar (UAVSAR) will be combined to measure the motion of Earth’s surface. The earthquake in Haiti on January 12, 2010 has increased the stress on this fault line, significantly increasing the risk of a future earthquake, according to a recent report by the U.S. Geological Survey.

The UAVSAR uses a technique called interferometry. The polarimetric L-band synthetic aperture radar (SAR) specifically designed to acquire airborne repeat track SAR data for differential interferometric measurements, and these measurements will allow scientists to study the pressures building up and being released on the fault at depth.

NASA Grumman Gulfstream III (G-III) in flight with the UAVSAR instrument. Credit: NASA

Shortly before 5 p.m. local time on Jan. 12, 2010, a magnitude 7.0 earthquake struck southern Haiti. The earthquake’s epicenter was about 25 kilometers (15 miles) west-southwest of Port-au-Prince, close to the west (left) edge of this image. The large linear east-west valley in the mountains south of the city is the location of the major active fault zone responsible for the earthquake: the Enriquillo-Plantain Garden fault.

The fault extends from the western tip of Haiti past Port-au-Prince into the Dominican Republic to the east of this image.

Satellite interferometric synthetic aperture radar measurements show that the Jan. 12 earthquake ruptured a segment of the fault extending from the epicenter westward over a length of about 40 kilometers (25 miles), leaving the section of the fault in this image unruptured.

Historical records show that the southern part of Haiti was struck by a series of large earthquakes in the 1700s, and geologists believe those were also caused by ruptures on this fault zone.

The large dark line running east-west near the city is the main airport.

The colors in the image reflect the three different UAVSAR radar polarizations: HH (horizontal transmit, horizontal receive) is colored red; VV (vertical transmit, vertical receive) is colored blue; and HV (horizontal transmit, vertical receive) is colored green. Like a pair of Polaroid sunglasses, these images are sensitive to different parts of the radar signal that is reflected back from Earth’s surface. The HV polarization is sensitive to volume scattering that typically occurs over vegetation—this gives hills a greenish color. VV polarization is sensitive to surface scattering such as that returned from bare surfaces or water—this gives water a bluish tint. Finally, HH polarization is sensitive to corner-like objects—this gives some urban areas and vegetated regions a reddish tint. The image is roughly 20 kilometers (12.5 miles) wide in the northwest-southeast direction. North is up and radar illumination is from the southeast.

More information on UAVSAR.

Source: NASA

Latest GeoEye Satellite Imagery of Haiti Devastation Now Available on Google Earth

Before-and-after screenshots of the Presidential Palace and an area of Port-au-Prince. Credit: Google, GeoEye

[/caption]

The folks at Google Earth and the satellite imaging company GeoEye have teamed up to make available the most recent Haiti photos — taken at approximately 10:27am EST on January 13, 2010. It is available as a KML overlay for Google Earth, and you can download the KML here and open it in Google Earth. You can also open the file in Google Maps. As you’ll see, the imagery shows a powerful glimpse into the destruction in Haiti. Above are before-and-after screenshots of the Presidential Palace and an area of Port-au-Prince.

Google said they will continue to automatically update the layer (you’ll only need to download it once) to make more imagery and data available.

If you don’t have Google Earth (what!) you can go to this page and see the images in an embedded KML viewer.

Google also has a listing of how you can help the relief efforts in Haiti.

Source: Google Lat Long Blog

Maps of Earthquake and Aftershocks in Haiti

Caption: NASA Earth Observatory image by Jesse Allen

At 21:53 UTC on January 12, 2010 an earthquake with a magnitude 7.0 struck the Caribbean nation of Haiti. The US Geological Survey (USGS) says that it was the most violent earthquake to strike the impoverished country in a century, and death tolls are reported to be rising into the hundreds of thousands. “Porte-au-Prince is probably one of the worst constructed cities in the world, and even the presidential palace collapsed,” said Roger Bilham, from the University of Colorado-Boulder. “This is an earthquake many of us were expecting to occur sooner or later.”

Map of earthquake and aftershocks in Haiti. Credit: USGS

This image from the USGS shows all the seismic activity in the region, including areas in the ocean.

Dennis Mileti, also from CU-Boulder said three factors contributed to the severity of the Haitian event: the shallow location of the earth quake (only 8.3 kilometers or 5.2 miles underground) resulting in high shaking intensity; the low-quality construction of structures in the area; and the lack of earthquake preparedness and increased vulnerability resulting from Haiti being a poor country.

The epicenter of the earthquake was just 15 kilometers (10 miles) southwest of the Haitian capital of Port-au-Prince. Besides its strong magnitude, the earthquake’s shallow depth ensured that the densely populated capital would suffer violent shaking. More than 30 aftershocks rocked the area.

Reports say a majority if the infrastructure has collapsed, including schools, hospitals, government buildings – such as the presidential palace and the main prison — aid centers, and shantytowns.

The top map shows the region surrounding the 7.0-magnitude earthquake and the aftershock. Earthquake magnitudes are measures of earthquake size calculated from ground motion recorded on seismographs.

Ocean areas appear in shades of blue, and land areas appear in shades of brown. Both in water and on land, higher elevation appears in lighter colors. Black circles mark earthquake locations determined by the USGS, and circle sizes correspond with quake magnitudes. Black lines indicate fault lines.

The map was created using earthquake and plate tectonics data from the USGS Earthquake Hazard Program, elevation data from the Shuttle Radar Topography Mission (SRTM) courtesy of the University of Maryland’s Global Land Cover Facility, and ocean bathymetry data from the British Oceanogprahic Data Centre’s (BODC) General Bathymetric Chart of the Oceans (GEBCO).


This “shake” map from the USGS shows the intensity of shaking felt across the region in Haiti.

The USGS said the earthquakes occurred along the boundary between the Caribbean and North America plates. This area is characterized as a strike-slip fault where the Caribbean plate moves eastward with respect to the North America plate.

But Haiti wasn’t the only place an earthquake has taken place recently. Check out this intriguing map of earthquakes in the past week.

Sources: NASA Earth Observatory, USGS, University of Colorado-Boulder, Nature,

UK’s Big Snowfall, As Seen From Space

Great Britain, as seen on Jan. 7, 2010 by the Terra Satellies. Credit: NASA

[/caption]
This satellite image taken by NASA’s Terra satellite shows the entire island of Great Britain blanketed by heavy snowfall, with some areas seeing the most snow in 50 years. It looks pretty from space, but frigid temperatures followed snowfall, leaving roads and sidewalks treacherously icy, according to news reports. As of January 7, overnight temperatures had plunged to -18 degrees Celsius (-0.4 degrees Fahrenheit) in isolated spots, with more widespread temperatures of -10 degrees Celsius (14 degrees Fahrenheit). The heavy snowfall downed power lines, leaving several thousand homes in southern England without electricity.

North America is also experiencing heavy snows and cold temperatures. NASA’s Earth Observatory website says that a possible contributor to the persistent cold and snow across much of the Northern Hemisphere’s mid-latitudes in December 2009 and January 2010 could be the fact that the atmosphere was in an extreme negative phase of the Arctic Oscillation (AO). The AO is a seesawing strengthening and weakening of semi-permanent areas of low and high atmospheric pressure in the Arctic and the mid-latitudes. One consequence of the oscillation’s negative phase is cold, snowy weather in Eurasia and North America during the winter months. The extreme negative dip of the Arctic Oscillation Index in December 2009 was the lowest monthly value observed for the past six decades.

Source: Earth Observatory