Astronomers Find The Most Distant Supernova Ever: 10.5 Billion Light-Years Away

This image shows the incredibly distant and ancient supernova DES16C2nm. The supernova was discovered by the Dark Energy Survey. Image: Mat Smith and DES collaboration.

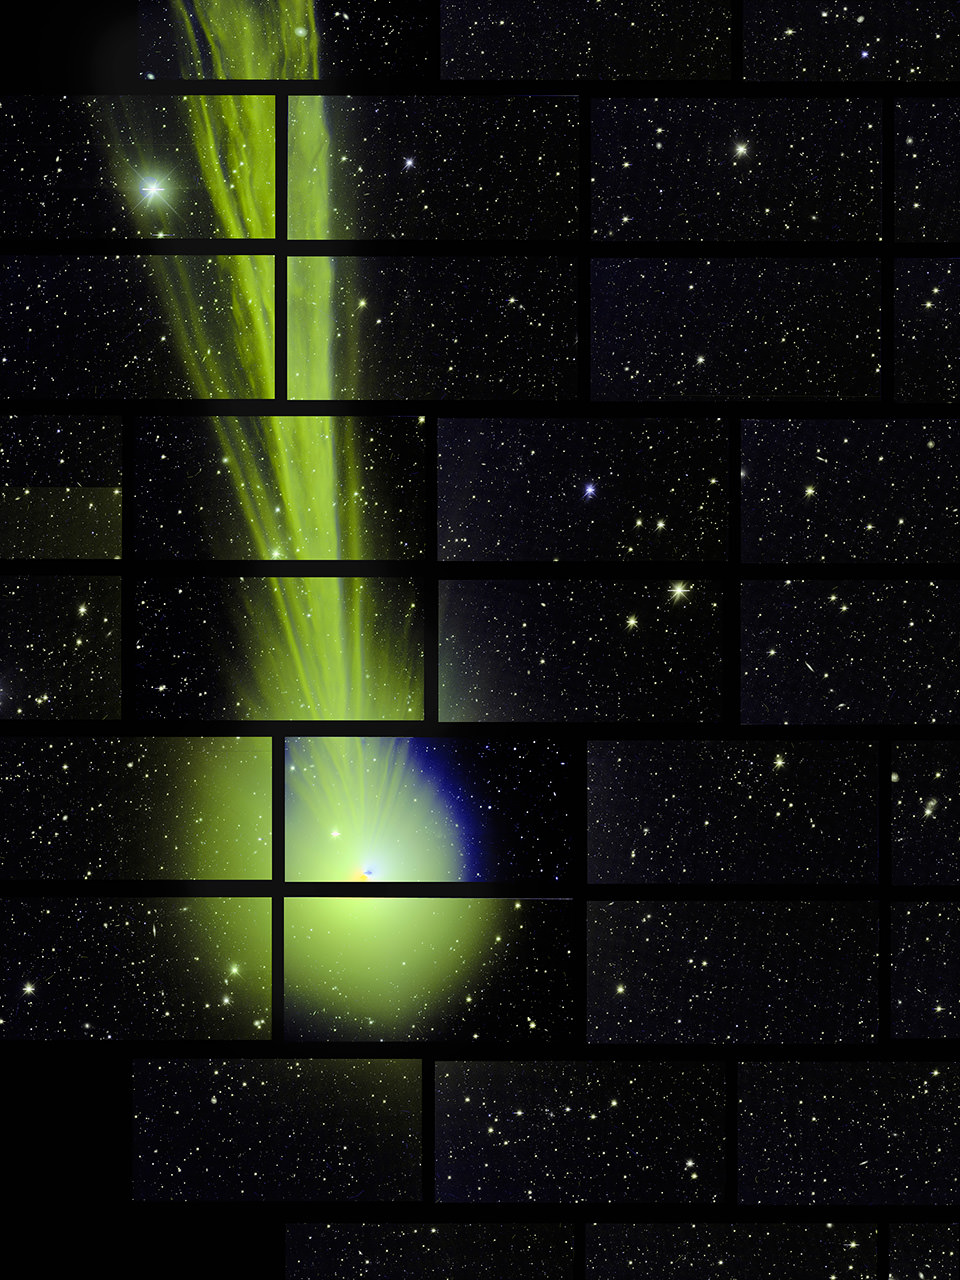
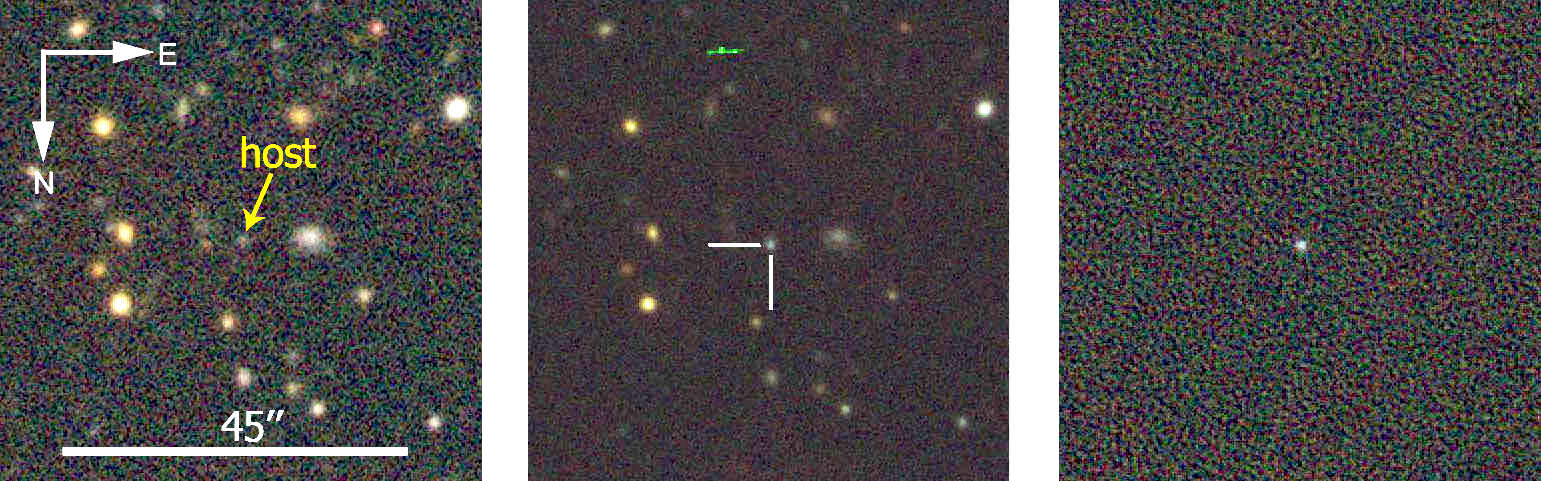
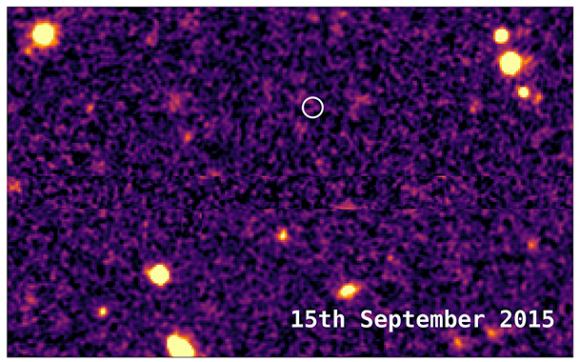
Astronomers have discovered the most distant supernova yet, at a distance of 10.5 billion light years from Earth. The supernova, named DES16C2nm, is a cataclysmic explosion that signaled the end of a massive star some 10.5 billion years ago. Only now is the light reaching us. The team of astronomers behind the discovery have published their results in a new paper available at arXiv.

“…sometimes you just have to go out and look up to find something amazing.” – Dr. Bob Nichol, University of Portsmouth.

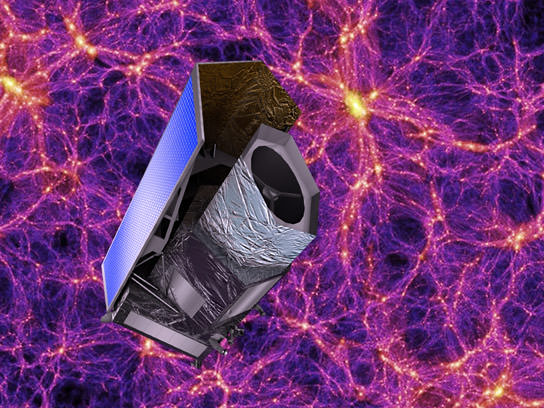
The supernova was discovered by astronomers involved with the Dark Energy Survey (DES), a collaboration of astronomers in different countries. The DES’s job is to map several hundred million galaxies, to help us find out more about dark energy. Dark Energy is the mysterious force that we think is causing the accelerated expansion of the Universe.

DES16C2nm was first detected in August 2016. Its distance and extreme brightness were confirmed in October that year with three of our most powerful telescopes – the Very Large Telescope and the Magellan Telescope in Chile, and the Keck Observatory, in Hawaii.

This image from 2015 shows the same area of sky before DES16C2nm exploded. Image: Mat Smith and DES collaboration.

DES16C2nm is what’s known as a superluminous supernova (SLSN), a type of supernova only discovered 10 years ago. SLSNs are the rarest—and the brightest—type of supernova that we know of. After the supernova exploded, it left behind a neutron star, which is the densest type of object in the universe. The extreme brightness of SLSNs, which can be 100 times brighter than other supernovae, are thought to be caused by material falling into the neutron star.

“It’s thrilling to be part of the survey that has discovered the oldest known supernova.” – Dr Mathew Smith, lead author, University of Southampton

Lead author of the study Dr Mathew Smith, of the University of Southampton, said: “It’s thrilling to be part of the survey that has discovered the oldest known supernova. DES16C2nm is extremely distant, extremely bright, and extremely rare – not the sort of thing you stumble across every day as an astronomer.”

Dr. Smith went on to say that not only is the discovery exciting just for being so distant, ancient, and rare. It’s also providing insights into the cause of SLSNs: “The ultraviolet light from SLSN informs us of the amount of metal produced in the explosion and the temperature of the explosion itself, both of which are key to understanding what causes and drives these cosmic explosions.”

“Now we know how to find these objects at even greater distances, we are actively looking for more of them as part of the Dark Energy Survey.” – Co-author Mark Sullivan, University of Southampton.

Now that the international team behind the Dark Energy Survey has found one of the SLSNs, they want to find more. Co-author Mark Sullivan, also of the University of Southampton, said: “Finding more distant events, to determine the variety and sheer number of these events, is the next step. Now we know how to find these objects at even greater distances, we are actively looking for more of them as part of the Dark Energy Survey.”

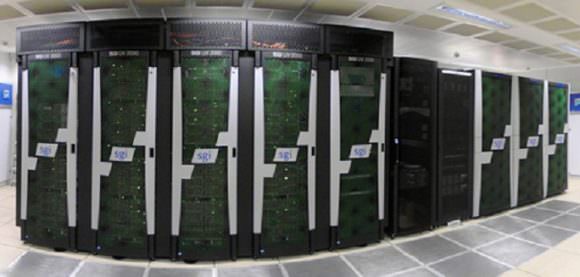
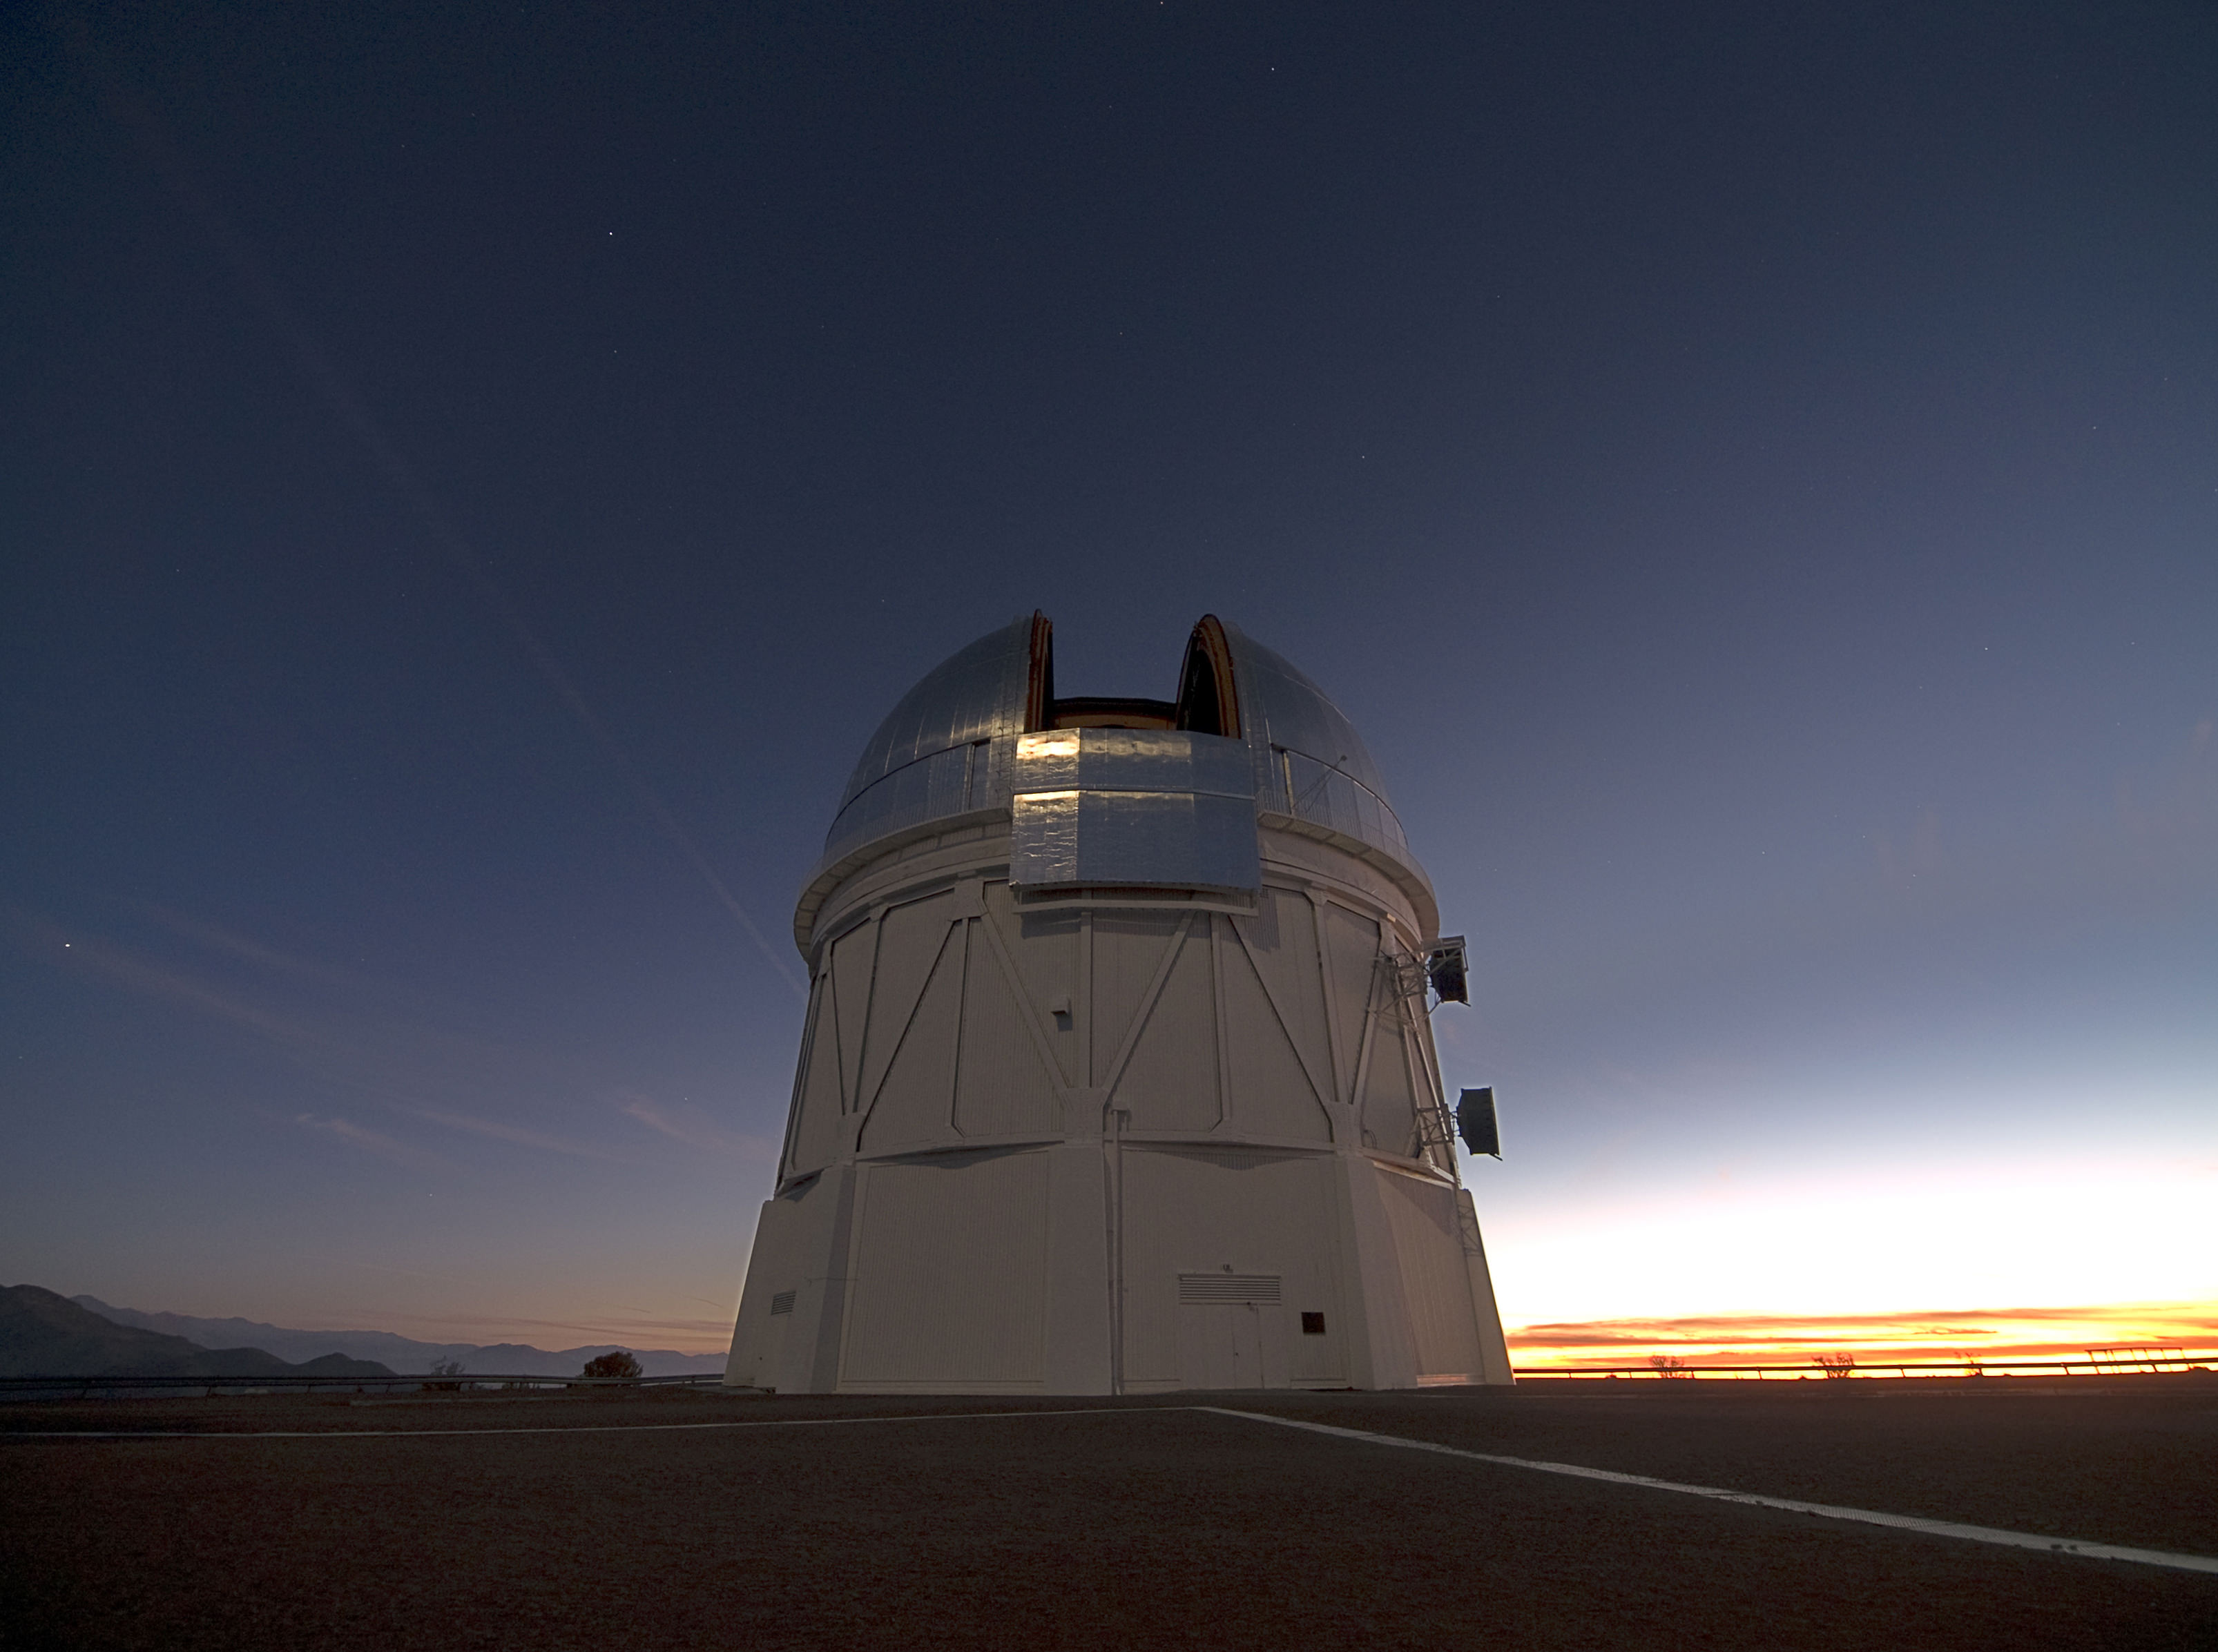
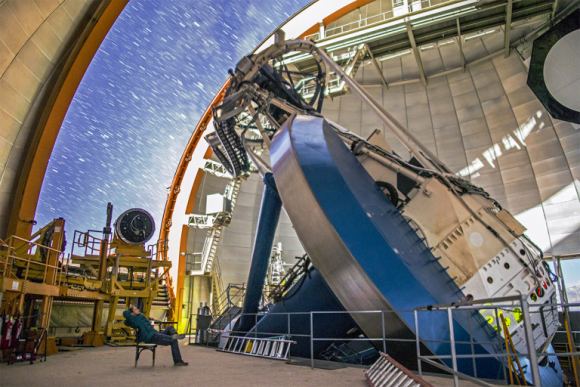
The instrument used by DES is the newly constructed Dark Energy Camera (DECam), which is mounted on the Victor M. Blanco 4-meter Telescope at the Cerro Tololo Inter-American Observatory (CTIO) in the Chilean Andes. DECam is an extremely sensitive 570-megapixel digital camera designed and built just for the Dark Energy Survey.

The DECam in operation at its home in the Chilean Andes. The extremely sensitive, 570 megapixel camera is mounted on the Victor M. Blanco 4-meter Telescope at the Cerro Tololo Inter-American Observatory. Image: DES/CTIO

The Dark Energy Survey involves more than 400 scientists from over 40 international institutions. It began in 2013, and will wrap up its five year mission sometime in 2018. The DES is using 525 nights of observation to carry out a deep, wide-area survey to record information from 300 million galaxies that are billions of light-years from Earth. DES is designed to help us answer a burning question.

According to Einstein’s General Relativity Theory, gravity should be causing the expansion of the universe to slow down. And we thought it was, until 1998 when astronomers studying distant supernovae found that the opposite is true. For some reason, the expansion is speeding up. There are really only two ways of explaining this. Either the theory of General Relativity needs to be replaced, or a large portion of the universe—about 70%—consists of something exotic that we’re calling Dark Energy. And this Dark Energy exerts a force opposite to the attractive force exerted by “normal” matter, causing the expansion of the universe to accelerate.

“…sometimes you just have to go out and look up to find something amazing.” – Dr. Bob Nichol, University of Portsmouth.

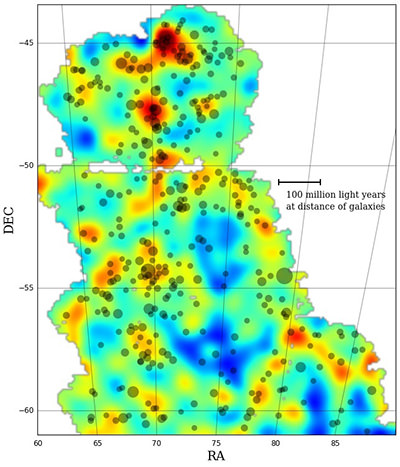
To help answer this question, the DES is imaging 5,000 square degrees of the southern sky in five optical filters to obtain detailed information about each of the 300 million galaxies. A small amount of the survey time is also used to observe smaller patches of sky once a week or so, to discover and study thousands of supernovae and other astrophysical transients. And this is how DES16C2nm was discovered.

Study co-author Bob Nichol, Professor of Astrophysics and Director of the Institute of Cosmology and Gravitation at the University of Portsmouth, commented: “Such supernovae were not thought of when we started DES over a decade ago. Such discoveries show the importance of empirical science; sometimes you just have to go out and look up to find something amazing.”

Professor Stephen Hawking Intends To Map The Known Universe

In honor of Dr. Stephen Hawking, the COSMOS center will be creating the most detailed 3D mapping effort of the Universe to date. Credit: BBC, Illus.: T.Reyes

Back in 1997, a team of leading scientists and cosmologists came together to establish the COSMOS supercomputing center at Cambridge University. Under the auspices of famed physicist Stephen Hawking, this facility and its supercomputer are dedicated to the research of cosmology, astrophysics and particle physics – ultimately, for the purpose of unlocking the deeper mysteries of the Universe.

Yesterday, in what was themed as a “tribute to Stephen Hawking”, the COSMOS center announced that it will be embarking on what is perhaps the boldest experiment in cosmological mapping. Essentially, they intend to create the most detailed 3D map of the early universe to date, plotting the position of billions of cosmic structures including supernovas, black holes, and galaxies.

This map will be created using the facility’s supercomputer, located in Cambridge’s Department of Applied Mathematics and Theoretical Physics. Currently, it is the largest shared-memory computer in Europe, boasting 1,856 Intel Xeon E5 processor cores, 31 Intel Many Integrated Core (MIC) co-processors, and 14.5 terabytes of globally shared memory.

The COSMOS IX supercomputer. Credit: cosmos.damtp.cam.ac.uk

The 3D will also rely on data obtained by two previous surveys – the ESA’s Planck satellite and the Dark Energy Survey. From the former, the COSMOS team will use the detailed images of the Cosmic Microwave Background (CMB) – the radiation leftover by the Big Ban – that were released in 2013. These images of the oldest light in the cosmos allowed physicists to refine their estimates for the age of the Universe (13.82 billion years) and its rate of expansion.

This information will be combined with data from the Dark Energy Survey which shows the expansion of the Universe over the course of the last 10 billion years. From all of this, the COSMOS team will compare the early distribution of matter in the Universe with its subsequent expansion to see how the two link up.

While cosmological simulations that looked at the evolution and large-scale structure of the Universe have been performed in the past – such as the Evolution and Assembly of GaLaxies and their Environments (EAGLE) project and the survey performed by the Institute for the Physics and Mathematics of the Universe at Tokyo University – this will be the first time where scientists compare data the early Universe to its evolution since.

The project is also expected to receive a boost from the deployment of the ESA’s Euclid probe, which is scheduled for launch in 2020. This mission will measure the shapes and redshifts of galaxies (looking 10 billion years into the past), thereby helping scientists to understand the geometry of the “dark Universe” – i.e. how dark matter and dark energy influence it as a whole.

Artist impression of the Euclid probe, which is set to launch in 2020. Credit: ESA

The plans for the COSMOS center’s 3D map are will be unveiled at the Starmus science conference, which will be taking place from July 2nd to 27th, 2016, in Tenerife – the largest of the Canary Islands, located off the coast of Spain. At this conference, Hawking will be discussing the details of the COSMOS project.

In addition to being the man who brought the COSMOS team together, the theme of the project – “Beyond the Horizon – Tribute to Stephen Hawking” – was selected because of Hawking’s long-standing commitment to physics and cosmology. “Hawking is a great theorist but he always wants to test his theories against observations,” said Prof. Shellard in a Cambridge press release. “What will emerge is a 3D map of the universe with the positions of billions of galaxies.”

Hawking will also present the first ever Stephen Hawking Medal for Science Communication, an award established by Hawking that will be bestowed on those who help promote science to the public through media – i.e. cinema, music, writing and art. Other speakers who will attending the event include Neil deGrasse Tyson, Chris Hadfield, Martin Rees, Adam Riess, Rusty Schweickart, Eric Betzig, Neil Turok, and Kip Thorne.

Professor Hawking, flanked by , announcing the launch of the Stephen Hawking Medal for Science Communication, Dec. 16th, 2015. Credit:
Professor Hawking and colleagues from the Royal Society announcing the launch of the Stephen Hawking Medal for Science Communication, Dec. 16th, 2015. Credit: starmus.com

Naturally, it is hoped that the creation of this 3D map will confirm current cosmological theories, which include the current age of the Universe and whether or not the Standard Model of cosmology – aka. the Lambda Cold Dark Matter (CDM) model – is in fact the correct one. As Hawking is surely hoping, this could bring us one step closer to a Theory of Everything!

Further Reading: Cambridge News

Scientists Map the Dark Matter Around Millions of Galaxies

The first Dark Energy Survey map to trace the dark matter distribution across a large area of sky. The colors indicate projected mass density. (Image: Dark Energy Survey)

This week, scientists with the Dark Energy Survey (DES) collaboration released the first in a series of detailed maps charting the distribution of dark matter inferred from its gravitational effects. The new maps confirm current theories that suggest galaxies will form where large concentrations of dark matter exist. The new data show large filaments of dark matter where visible galaxies and galaxy clusters lie and cosmic voids where very few galaxies reside.

“Our analysis so far is in line with what the current picture of the universe predicts,” said Chihway Chang from the Swiss Federal Institute of Technology (ETH) in Zurich, a co-leader of the analysis. “Zooming into the maps, we have measured how dark matter envelops galaxies of different types and how together they evolve over cosmic time.”

The research and maps, which span a large area of the sky, are the product of a massive effort of an international team from the US, UK, Spain, Germany, Switzerland, and Brazil. They announced their new results at the American Physical Society (APS) meeting in Baltimore, Maryland.

According to cosmologists, dark matter particles stream and clump together over time in particular regions of the cosmos, often in the same places where galaxies form and cluster. Over time, a “cosmic web” develops across the universe. Though dark matter is invisible, it expands with the universe and feels the pull of gravity. Astrophysicists then can reconstruct maps of it by surveying millions of galaxies, much like one might infer the shifting orientation of a flock of birds from its shadow moving along the ground.

DES scientists created the maps with one of the world’s most powerful digital cameras, the 570-megapixel Dark Energy Camera (DECam), which is particularly sensitive to the light from distant galaxies. It is mounted on the 4-meter Victor M. Blanco Telescope, located at the Cerro Tololo Inter-American Observatory in northern Chile. Each of its images records data from an area 20 times the size of the moon as seen from earth.

In addition, DECam collects data nearly ten times faster than previous machines. According to David Bacon, at the University of Portsmouth’s Institute of Cosmology and Gravitation, “This allows us to stare deeper into space and see the effects of dark matter and dark energy with greater clarity. Ironically, although these dark entities make up 96% of our universe, seeing them is hard and requires vast amounts of data.”

The silvered dome of the Blanco 4-meter telescope holds the DECam at the Cerro Tololo Inter-American Observatory in Chile. (Photo credit: T. Abbott and NOAO/AURA/NSF)

The telescope and its instruments enable precise measurements utilizing a technique known as “gravitational lensing.” Astrophysicists study the small distortions and shear of images of galaxies due to the gravitational pull of dark matter around them, similar to warped images of objects in a magnifying glass, except that the lensed galaxies observed by the DES scientists are at least 6 billion light-years away.

Chang and Vinu Vikram (Argonne National Laboratory) led the analysis, with which they traced the web of dark matter in unprecedented detail across 139 square degrees of the southern hemisphere. “We measured the barely perceptible distortions in the shapes of about 2 million galaxies to construct these new maps,” Vikram said. This amounts to less then 0.4% of the whole sky, but the completed DES survey will map out more than 30 times this area over the next few years.

They submitted their research paper for publication in an upcoming issue of the Monthly Notices of the Royal Astronomical Society, and the DES team publicly released it as part of a set of papers on the arXiv.org server on Tuesday.

The precision and detail of these large contiguous maps being produced by DES scientists will allow for tests of other cosmological models. “I’m really excited about what these maps will tell us about dark matter in galaxy clusters especially with respect to theories of modified gravity,” says Robert Nichol (University of Portsmouth). Einstein’s model of gravity, general relativity, could be incorrect on large cosmological scales or in the densest regions of the universe, and ongoing research with the Dark Energy Survey will facilitate investigations of this.

Dark Energy Camera Takes Accidental Gigantic, Magnificent Picture of Comet Lovejoy

Comet 2014 Q2 Lovejoy on December 27, 2014, as seen by the Dark Energy Survey. Credit: Fermilab’s Marty Murphy, Nikolay Kuropatkin, Huan Lin and Brian Yanny.

Oops! In a happy accident, Comet Lovejoy just happened to be in the field of view of the 570-megapixel Dark Energy Camera, the world’s most powerful digital camera. One member of the observing team said it was a “shock” to see Comet Lovejoy pop up on the display in the control room.

“It reminds us that before we can look out beyond our Galaxy to the far reaches of the Universe, we need to watch out for celestial objects that are much closer to home!” wrote the team on the Dark Energy Detectives blog.

On December 27, 2014, while the Dark Energy Survey was scanning the southern sky, C2014 Q2 entered the camera’s view. Each of the rectangular shapes above represents one of the 62 individual fields of the camera.

At the time this image was taken, the comet was passing about 82 million km (51 million miles) from Earth. That’s a short distance for the Dark Energy Camera, which is sensitive to light up to 8 billion light years away. The comet’s center is likely made of rock and ice and is roughly 5 km (3 miles) across. The visible coma of the comet is a cloud of gas and dust about 640,000 km (400,000 miles) in diameter.

The Dark Energy Survey (DES) is designed to probe the origin of the accelerating universe and help uncover the nature of dark energy by measuring the 14-billion-year history of cosmic expansion with high precision.

The camera just finished up the third, six-month-long season of observations, and the camera won’t be observing again until this fall.

You can download higher resolution versions of this image here.

The Search for Dark Energy Just Got Easier

The Victor M. Blanco telescope at Cerro Tololo Interamerican Observatory (CTIO) in the Chilean Andes. Credit: Berkeley Lab

Since the early 20th century, scientists and physicists have been burdened with explaining how and why the Universe appears to be expanding at an accelerating rate. For decades, the most widely accepted explanation is that the cosmos is permeated by a mysterious force known as “dark energy”. In addition to being responsible for cosmic acceleration, this energy is also thought to comprise 68.3% of the universe’s non-visible mass.

Much like dark matter, the existence of this invisible force is based on observable phenomena and because it happens to fit with our current models of cosmology, and not direct evidence. Instead, scientists must rely on indirect observations, watching how fast cosmic objects (specifically Type Ia supernovae) recede from us as the universe expands.

This process would be extremely tedious for scientists – like those who work for the Dark Energy Survey (DES) – were it not for the new algorithms developed collaboratively by researchers at Lawrence Berkeley National Laboratory and UC Berkeley.

“Our algorithm can classify a detection of a supernova candidate in about 0.01 seconds, whereas an experienced human scanner can take several seconds,” said Danny Goldstein, a UC Berkeley graduate student who developed the code to automate the process of supernova discovery on DES images.

Currently in its second season, the DES takes nightly pictures of the Southern Sky with DECam – a 570-megapixel camera that is mounted on the Victor M. Blanco telescope at Cerro Tololo Interamerican Observatory (CTIO) in the Chilean Andes. Every night, the camera generates between 100 Gigabytes (GB) and 1 Terabyte (TB) of imaging data, which is sent to the National Center for Supercomputing Applications (NCSA) and DOE’s Fermilab in Illinois for initial processing and archiving.

A Type Ia supernova occurs when a white dwarf accretes material from a companion star until it exceeds the Chandrasekhar limit and explodes. By studying these exploding stars, astronomers can measure dark energy and the expansion of the universe. CfA scientists have found a way to correct for small variations in the appearance of these supernovae, so that they become even better standard candles. The key is to sort the supernovae based on their color.  Credit: NASA/CXC/M. Weiss
By studying Type Ia supernova, astronomers can measure dark energy and the expansion of the universe. Credit: NASA/CXC/M. Weiss

Object recognition programs developed at the National Energy Research Scientific Computing Center (NERSC) and implemented at NCSA then comb through the images in search of possible detections of Type Ia supernovae. These powerful explosions occur in binary star systems where one star is a white dwarf, which accretes material from a companion star until it reaches a critical mass and explodes in a Type Ia supernova.

“These explosions are remarkable because they can be used as cosmic distance indicators to within 3-10 percent accuracy,” says Goldstein.

Distance is important because the further away an object is located in space, the further back in time it is. By tracking Type Ia supernovae at different distances, researchers can measure cosmic expansion throughout the universe’s history. This allows them to put constraints on how fast the universe is expanding and maybe even provide other clues about the nature of dark energy.

“Scientifically, it’s a really exciting time because several groups around the world are trying to precisely measure Type Ia supernovae in order to constrain and understand the dark energy that is driving the accelerated expansion of the universe,” says Goldstein, who is also a student researcher in Berkeley Lab’s Computational Cosmology Center (C3).

UC Berkeley / Berkeley Lab graduate student Danny Goldstein developed a new code using the machine learning technique Random Forest to vet detections of supernova candidates automatically, in real time, optimizing it for the Dark Energy Survey. Credit: Danny Goldstein, UC Berkeley / Berkeley Lab)
Goldstein’s new code uses machine learning techniques to vet detections of supernova candidates. Credit: Danny Goldstein, UC Berkeley/Berkeley Lab)

The DES begins its search for Type Ia explosions by uncovering changes in the night sky, which is where the image subtraction pipeline developed and implemented by researchers in the DES supernova working group comes in. The pipeline subtracts images that contain known cosmic objects from new images that are exposed nightly at CTIO.

Each night, the pipeline produces between 10,000 and a few hundred thousand detections of supernova candidates that need to be validated.

“Historically, trained astronomers would sit at the computer for hours, look at these dots, and offer opinions about whether they had the characteristics of a supernova, or whether they were caused by spurious effects that masquerade as supernovae in the data. This process seems straightforward until you realize that the number of candidates that need to be classified each night is prohibitively large and only one in a few hundred is a real supernova of any type,” says Goldstein. “This process is extremely tedious and time-intensive. It also puts a lot of pressure on the supernova working group to process and scan data fast, which is hard work.”

To simplify the task of vetting candidates, Goldstein developed a code that uses the machine learning technique “Random Forest” to vet detections of supernova candidates automatically and in real-time to optimize them for the DES. The technique employs an ensemble of decision trees to automatically ask the types of questions that astronomers would typically consider when classifying supernova candidates.

Evolution of a Type Ia supernova. Credit: NASA/ESA/A. Feild

At the end of the process, each detection of a candidate is given a score based on the fraction of decision trees that considered it to have the characteristics of a detection of a supernova. The closer the classification score is to one, the stronger the candidate. Goldstein notes that in preliminary tests, the classification pipeline achieved 96 percent overall accuracy.

“When you do subtraction alone you get far too many ‘false-positives’ — instrumental or software artifacts that show up as potential supernova candidates — for humans to sift through,” says Rollin Thomas, of Berkeley Lab’s C3, who was Goldstein’s collaborator.

He notes that with the classifier, researchers can quickly and accurately strain out the artifacts from supernova candidates. “This means that instead of having 20 scientists from the supernova working group continually sift through thousands of candidates every night, you can just appoint one person to look at maybe few hundred strong candidates,” says Thomas. “This significantly speeds up our workflow and allows us to identify supernovae in real-time, which is crucial for conducting follow up observations.”

“Using about 60 cores on a supercomputer we can classify 200,000 detections in about 20 minutes, including time for database interaction and feature extraction.” says Goldstein.

Goldstein and Thomas note that the next step in this work is to add a second-level of machine learning to the pipeline to improve the classification accuracy. This extra layer would take into account how the object was classified in previous observations as it determines the probability that the candidate is “real.” The researchers and their colleagues are currently working on different approaches to achieve this capability.

Further Reading: Berkley Lab

Superluminous Supernova Puzzles Astronomers

Before (left) and after (center) images of the region where DES13S2cmm was discovered. On the right is a subtraction of these two images, showing a bright new object at the center -- a supernova. Credit: Dark Energy Survey

Supernovae are surprisingly dependable. These brilliant and powerful explosions that mark the end of massive stars’ lives tend to shine anywhere from one hundred million to a few billion times brighter than the Sun for weeks on end. And their intrinsic brightness is always well known.

But in recent years a rare class of cosmic explosions, which are tens to hundreds of times more luminous than ordinary supernovae, has been discovered. And now one of these odd superluminous supernovae is mystifying astronomers further, with characteristics that simply don’t add up.

The Dark Energy Survey (DES) came online in August 2013 in order to investigate millions of galaxies for the subtle effects of weak lensing, the phenomenon where intervening invisible matter causes distant galaxies to appear minutely sheared and stretched.

The survey started off with a bang; its first images revealed a rare superluminous supernova, dubbed DES13S2cmm, 7.8 billion light-years away.

“Fewer than forty such supernovae have ever been found and I never expected to find one in the first DES images,” said Andreas Papadopoulos from the University of Portsmouth in a press release. “As they are rare, each new discovery brings the potential for greater understanding  or more surprises.”

The problem is this: DES13S2cmm doesn’t easily match the typical characteristics of a superluminous supernova. The stellar explosion could be seen in the data six months later, much longer than most other superluminous supernovae observed to date.

“Its unusual, slow decline was not apparent at first,” said Mark Sullivan from Southampton University. “But as more data came in and the supernova stopped getting fainter, we would look at the light curve and ask ourselves, ‘what is this?’ ”

So Sullivan decided to investigate further. But understanding its origins are proving difficult.

For some supernovae, the optical light we see is actually created by radioactivity. In fact, supernovae tend to create large amounts of radioactive elements, which don’t occur naturally on Earth. Nickel-56, with a half-life of roughly six days, is a common example.

As the nickel decays into cobalt, it releases gamma rays, which are trapped by the other material ejected by the supernova. These trapped rays heat up the surrounding material until it radiates in the optical. In this case, the peak magnitude of the supernova is directly proportional to the amount of nickel-56 created in the explosion.

“We have tried to explain the supernova as a result of the decay of the radioactive isotope nickel-56,” said coauthor Dr Chris D’Andrea of the University of Portsmouth. “But to match the peak brightness, the explosion would need to produce more than three times the mass of our Sun of the element. And even then the behavior of the light curve doesn’t match up.”

So the team is now investigating other explanations. In one intriguing scenario the supernova was relatively normal but created a magnetar — an extremely dense and highly magnetic neutron star that’s millions of times more powerful than the strongest magnets on Earth — whose energy made the explosion exceptionally bright.

But this explanation doesn’t match the data either.

A few months ago a team of astronomers led by Robert Quimby explained a superluminous supernovae, PS1-10afx, by a chance cosmic alignment, where intervening matter worked like a lens to deflect and intensify the background light for a typical Type Ia supernova. D’Andrea, however, doesn’t believe this is the case here.

“DES13S2cmm looks nothing like a normal type of supernova, either in its photometric evolution or its spectroscopy,” D’Andrea told Universe Today. “So while we can never be sure that a very faint but very massive galaxy lies between us and another object and is serendipitously brightening the object, there is no need to adopt that assumption in the case of DES13S2cmm.”

chance cosmic alignment — where intervening matter worked like a lens to deflect and intensify the background light – See more at: http://www.skyandtelescope.com/astronomy-news/stellar-science/mysteriously-bright-supernova-explained/#sthash.m7Z8PJ3k.dpuf

So astronomers are heading back to the drawing board.

“With so few known, it’s hard to really understand their properties in detail,” said Bob Nichol from the University of Portsmouth. “DES should find enough of these objects to allow us to understand superluminous supernovae as a population. But if some of these discoveries prove as difficult to interpret as DES13S2cmm, we’re prepared for the unusual.”

The results will be presented today at the National Astronomy Meeting 2014 in Portsmouth.

First Images in a New Hunt for Dark Energy

Zoomed-in image from the Dark Energy Camera of the barred spiral galaxy NGC 1365, about 60 million light-years from Earth. (Dark Energy Survey Collaboration)

The ongoing search for dark energy now has a new set of eyes: the Dark Energy Camera, mounted on the 4-meter Victor M. Blanco telescope at the National Science Foundation’s Cerro Tololo Inter-American Observatory in Chile. The culmination of eight years of planning and engineering, the phone-booth-sized 570-megapixel Dark Energy Camera has now gathered its very first images, capturing light from cosmic structures tens of millions of light-years away.

Eventually the program’s survey will help astronomers uncover the secrets of dark energy — the enigmatic force suspected to be behind the ongoing and curiously accelerating expansion of the Universe.

Zoomed-in image from the Dark Energy Camera of the Fornax cluster

“The Dark Energy Survey will help us understand why the expansion of the universe is accelerating, rather than slowing due to gravity,” said Brenna Flaugher, project manager and scientist at Fermilab.

Read more: Polar Telescope Casts New Light on Dark Energy

The most powerful instrument of its kind, the Dark Energy Camera will be used to create highly-detailed color images of  a full 1/8th of the night sky — about 5,000 square degrees — surveying thousands of supernovae, galactic clusters and literally hundreds of millions of galaxies, peering as far away as 8 billion light-years.

The survey will attempt to measure the effects of dark energy on large-scale cosmic structures, as well as identify its gravitational lensing effects on light from distant galaxies. The images seen here, acquired on September 12, 2012, are just the beginning… the Dark Energy Survey is expected to begin actual scientific investigations this December.

Full Dark Energy Camera composite image of the Small Magellanic Cloud

“The achievement of first light through the Dark Energy Camera begins a significant new era in our exploration of the cosmic frontier,” said James Siegrist, associate director of science for high energy physics with the U.S. Department of Energy. “The results of this survey will bring us closer to understanding the mystery of dark energy, and what it means for the universe.”

Read more on the Symmetry Magazine article here, and you can also follow the Dark Energy Survey on Facebook here. (The Fermilab press release can be found here.)

Images: Dark Energy Survey Collaboration. Inset image: the 4-meter Blanco Telescope dome at CTIO (NOAO)

The Dark Energy Survey is supported by funding from the U.S. Department of Energy; the National Science Foundation; funding agencies in the United Kingdom, Spain, Brazil, Germany and Switzerland; and the participating DES institutions.