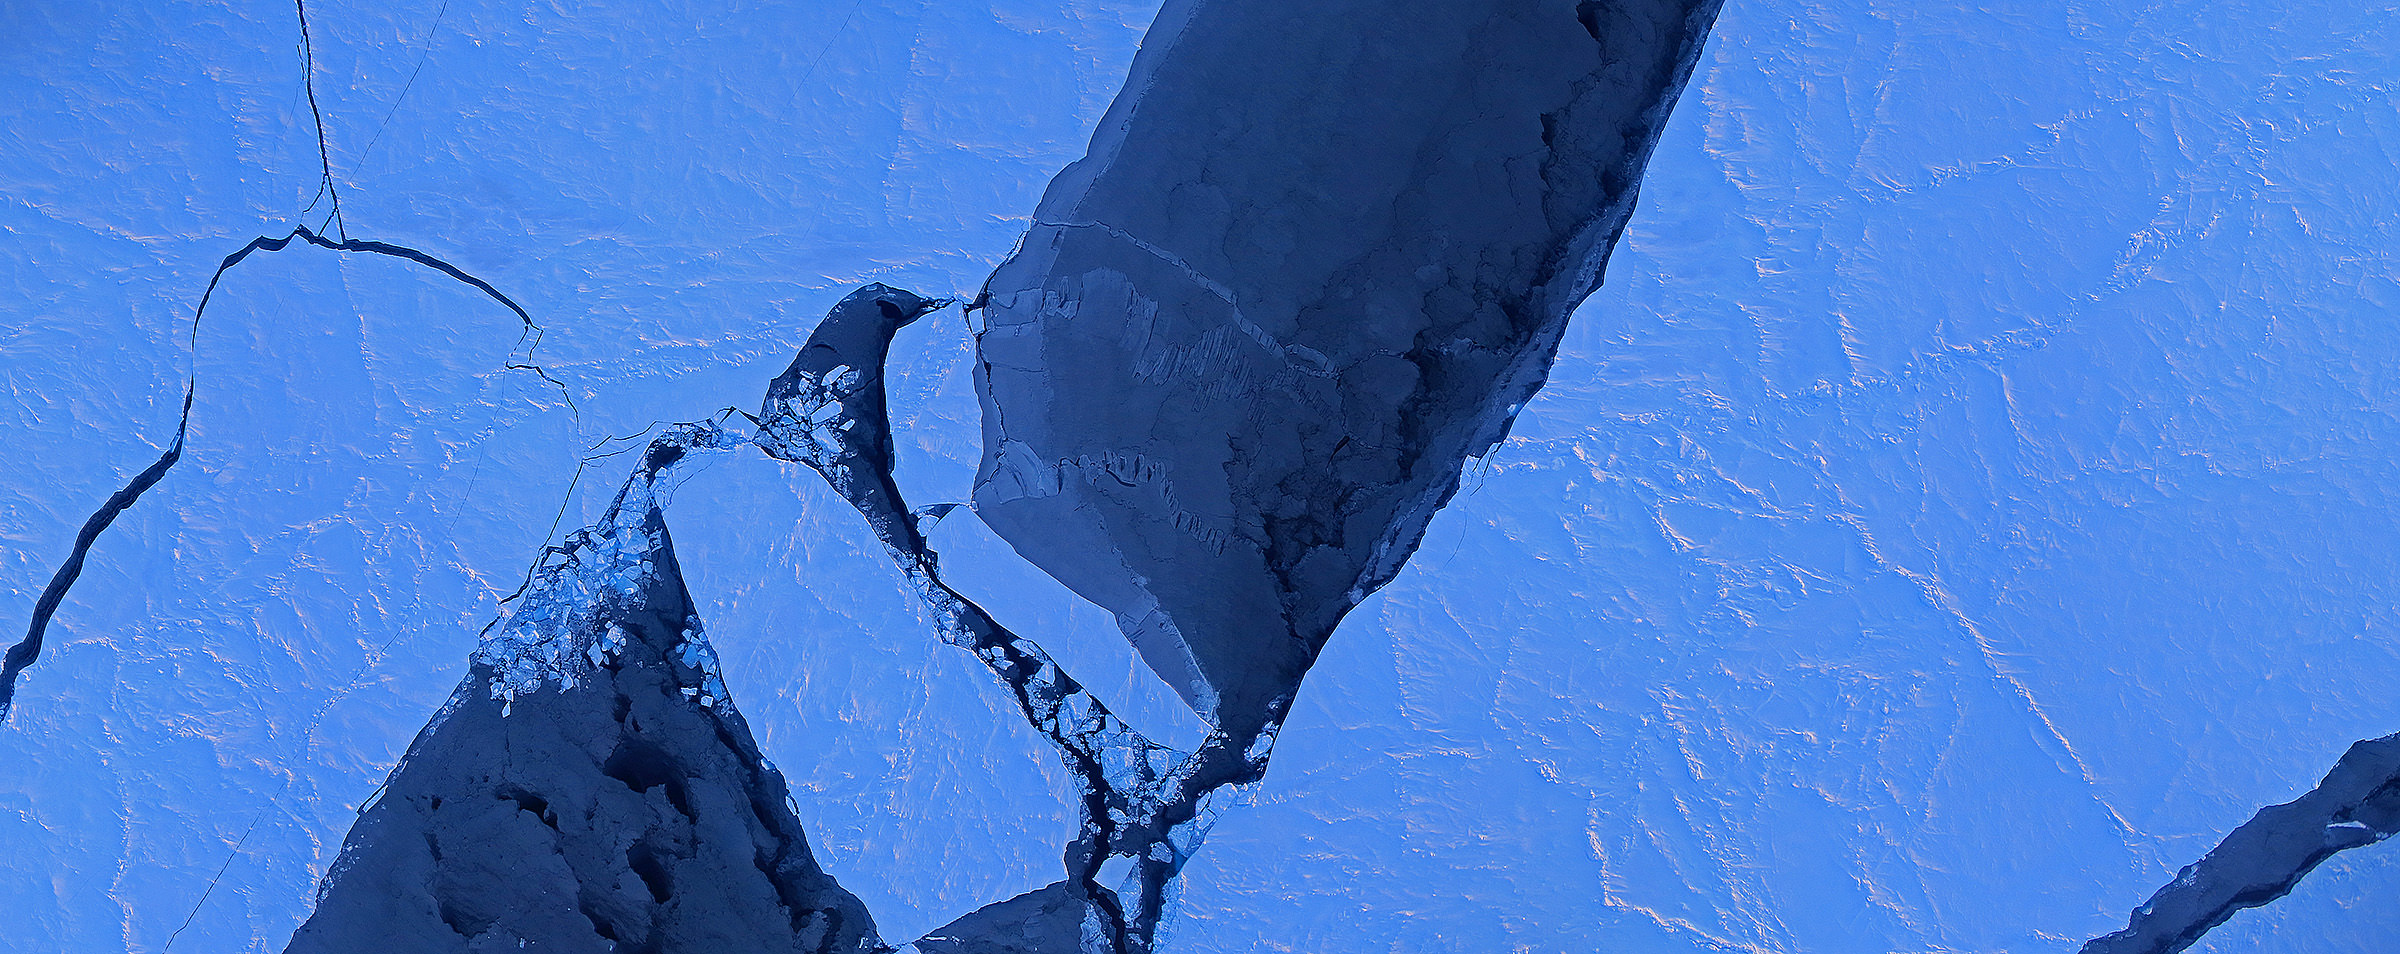
An image mosaic of ice breaking up in the Arctic Ocean's Canada Basin on March 28, 2014. Image taken by Operation IceBridge's Digital Mapping System. Credit: Digital Mapping System/NASA Ames
The Arctic melt season is averaging five days longer with each passing decade, a new study by NASA and the National Snow and Ice Data Center reveals. And with more ice-free days, the water (which is darker than the surrounding ice) is absorbing the sun’s heat and accelerating the process. This means the Arctic ice cap has shrank by as much as four feet.
The sobering news comes following a study of satellite data from 1979 to 2013. By the end of this century, scientists believe, there will be a fully melted Arctic Ocean during the entire summer. And the news also comes in the same week that the Intergovernmental Panel on Climate Change (IPCC) released its own report on global warming.
“The Arctic is warming and this is causing the melt season to last longer,” stated Julienne Stroeve, a senior scientist at NSIDC, Boulder and lead author of a new study. “The lengthening of the melt season is allowing for more of the sun’s energy to get stored in the ocean and increase ice melt during the summer, overall weakening the sea ice cover.”
The research further revealed that solar radiation absorption depends on when the melt season begins; this is particularly true since the sun rises higher during the spring, summer and fall than in the winter. It’s still hard to predict when things will melt or freeze, however, since this depends on weather.
“There is a trend for later freeze-up, but we can’t tell whether a particular year is going to have an earlier or later freeze-up,” Stroeve said. “There remains a lot of variability from year to year as to the exact timing of when the ice will reform, making it difficult for industry to plan when to stop operations in the Arctic.”
Data was collected with NASA’s (long deceased) Nimbus-7 Scanning Multichannel Microwave Radiometer and instruments aboard Defense Meteorological Satellite Program spacecraft.
“When ice and snow begin to melt, the presence of water causes spikes in the microwave radiation that the snow grains emit, which these sensors can detect,” NASA stated. “Once the melt season is in full force, the microwave emissivity of the ice and snow stabilizes, and it doesn’t change again until the onset of the freezing season causes another set of spikes.”
The research has been accepted for publication in Geophysical Research Letters.
Climate change is one of the defining issues of our time. So begins the latest report by the U.S. National Academy of Sciences and the United Kingdom’s Royal Society. The two institutions agree: climate change is not only indisputable, it’s largely the result of human activities.
The bulk of the 36-page report is presented in a question-and-answer format, making it a good bed-side read. But in case you don’t want to have nightmares about surging temperatures or polar bears alone on breaking ice caps, we’ll leaf through the intriguing points here.
In a forward to the report, Dr. Ralph J. Cicerone, president of the National Academy of Sciences, and Sir Paul Nurse, president of the Royal Society argue that multiple lines of evidence show that humans are changing Earth’s climate. This is now more certain than ever.
They are careful to include a caveat: “The evidence is clear. However, due to the nature of science, not every single detail is ever totally settled or completely certain. Nor has every pertinent question yet been answered.” Areas of active debate include how much warming to expect in the future and the connections between climate change and extreme weather events such as the frequency and intensity of hurricanes, droughts and floods.
Earth’s global average surface temperature has risen as shown in this plot of combined land and ocean measurements from 1850 to 2012, derived from three independent analyses of the available data sets. Image Credit: National Academy of Sciences / The Royal Society
But the first question: is the climate warming? goes without debate. Yes. Earth’s average surface air temperature has increased by about 0.8 degrees Celsius since 1900, and the last 30 years have been the warmest in 800 years. It’s the most rapid period of sustained temperature change in the scale of global history, trumping every ice age cycle.
Recent estimates of the increase in global temperature since the end of the last ice age are four to five degrees Celsius. While this is much greater than the 0.8 degree Celsius change recorded over the last 100+ years, this change occurred over a period of about 7,000 years. So the change in rate is now 10 times faster.
Of course an increase in temperature goes hand in hand with an increase in carbon emissions. Greenhouse gases such as carbon dioxide absorb heat (infrared radiation) emitted from the Earth’s surface. Increases in the atmospheric concentrations of these gases trap most of the outgoing heat, causing the Earth to warm. Human activities, especially the burning of fossil fuels have increased carbon dioxide concentrations by 40 percent between 1880 and 2012. It is now higher than at any time in at least 800,000 years.
And if the rise in carbon emissions continues unchecked, warming of the same magnitude as the increase out of the last ice age can be expected by the end of this century.
The report continues to ask more controversial questions. Take as an example the question: Does the recent slowdown of warming mean that climate change is no longer happening? The short answer is no. Decades of slow warming and accelerated warming occur naturally in the climate system. Despite the slower rate of warming the 2000’s were still warmer than the 1990’s
The new report builds upon the long history of climate-related work from the United Nations’ Intergovernmental Panel on Climate Change. So while some have argued it doesn’t add anything new to the wealth of climate science data available, it does help make that data more succinct and available to the public. Its goal is to help inform decision makers, policy makers, educators and all other individuals.
The report concludes by noting available options to citizens and governments. They can simply wait and accept the losses, they can change their pattern of energy production, they can attempt to adapt to environmental changes as much as possible, or they can seek as yet unproven geoengineering solutions.
No matter which option we choose, one thing remains certain: the Earth is warming at a tremendous rate and we are the cause.
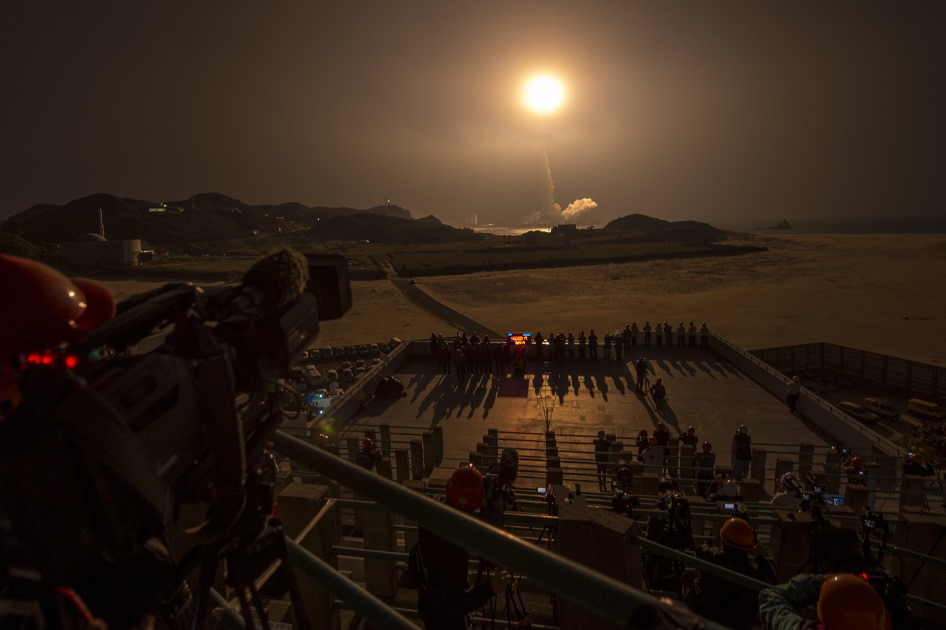
GPM Launch Seen From the Tanegashima Space Center. A Japanese H-IIA rocket with the NASA-Japan Aerospace Exploration Agency (JAXA), Global Precipitation Measurement (GPM) Core Observatory onboard, is seen launching from the Tanegashima Space Center on Friday, Feb. 28, 2014 (Japan Time), in Tanegashima, Japan; Thursday, Feb. 27, EST.. Credit: NASA/Bill Ingalls
GPM Launch Seen From the Tanegashima Space Center
A Japanese H-IIA rocket with the NASA-Japan Aerospace Exploration Agency (JAXA), Global Precipitation Measurement (GPM) Core Observatory onboard, is seen launching from the Tanegashima Space Center on Friday, Feb. 28, 2014 (Japan Time), in Tanegashima, Japan; Thursday, Feb. 27, EST. Credit: NASA/Bill Ingalls[/caption]
NASA GODDARD SPACE FLIGHT CENTER, MARYLAND – A powerful, next generation weather observatory aimed at gathering unprecedented 3-D measurements of global rain and snowfall rates – and jointly developed by the US and Japan – thundered to orbit today (Feb. 27 EST, Feb. 28 JST) ) during a spectacular night time blastoff from a Japanese space port.
The Global Precipitation Measurement (GPM) Core Observatory was launched precisely on time at 1:37 p.m. EST, 1837 GMT, Thursday, Feb. 27 (3:37 a.m. JST Friday, Feb. 28) atop a Mitsubishi Heavy Industries H-IIA rocket from the Tanegashima Space Center on Tanegashima Island off southern Japan.
Viewers could watch the spectacular liftoff live on NASA TV – which was streamed here at Universe Today.
“GPM’s precipitation measurements will look like a CAT scan,” Dr. Dalia Kirschbaum, GPM research scientist, told me during a prelaunch interview with the GPM satellite in the cleanroom at NASA’s Goddard Space Flight Center in Greenbelt, Md.
“The radar can scan through clouds to create a three dimensional view of a clouds structure and evolution.”
GPM lifts off on Feb. 27, EST (Feb. 28, JST) to begin its Earth-observing mission. Credit: NASA/Bill Ingalls
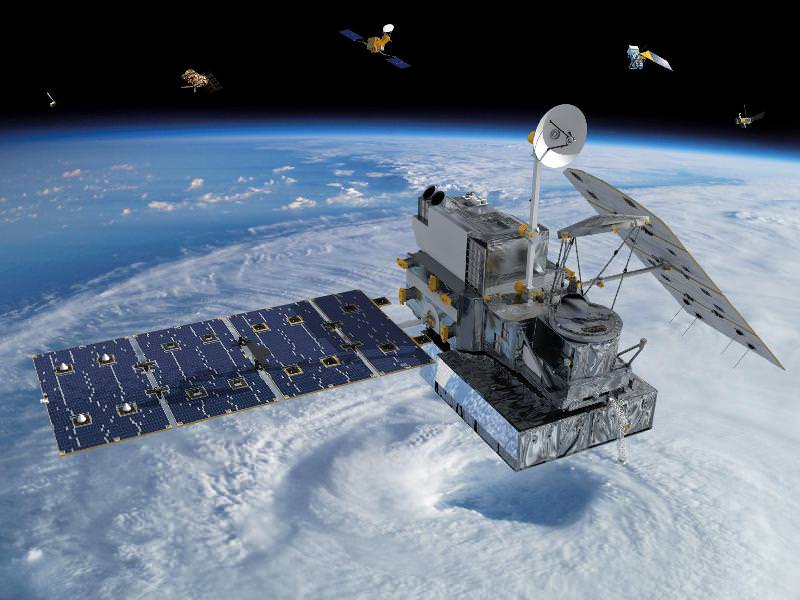
GPM is the lead observatory of a constellation of nine highly advanced Earth orbiting weather research satellites contributed by the US, Japan, Europe and India.
Indeed GPM will be the first satellite to measure light rainfall and snow, in addition to heavy tropical rainfall.
It will collect a treasure trove of data enabling the most comprehensive measurements ever of global precipitation every three hours – and across a wide swath of the planet where virtually all of humanity lives from 65 N to 65 S latitudes.
GPM orbits at an altitude of 253 miles (407 kilometers) above Earth – quite similar to the International Space Station (ISS).
The global precipitation data will be made freely available to climate researchers and weather forecasters worldwide in near real time – something long awaited and not possible until now.
Water and the associated water and energy cycles are the basis of all life on Earth.
Yet scientists lack a clear and comprehensive understanding of key rain and snow fall amounts on most of the globe – which is at the heart of humanity’s existence and future well being on the home planet.
Having an accurate catalog of the water and energy cycles will direct benefit society and impact people’s lives on a daily basis with improved weather forecasts, more advanced warnings of extreme weather conditions, aid farmers, help identify and determine the effects of global climate change.
Researchers will use the GPM measurements to study climate change, freshwater resources, floods and droughts, and hurricane formation and tracking.
“With this launch, we have taken another giant leap in providing the world with an unprecedented picture of our planet’s rain and snow,” said NASA Administrator Charles Bolden, in a NASA statement.
“GPM will help us better understand our ever-changing climate, improve forecasts of extreme weather events like floods, and assist decision makers around the world to better manage water resources.”
“The GPM spacecraft has been under development for a dozen years,” said GPM Project Manager Art Azarbarzin of NASA’s Goddard Space Flight Center in Greenbelt, Md., in a prelaunch interview with Universe Today conducted inside the clean room with GPM before it’s shipment to Japan.
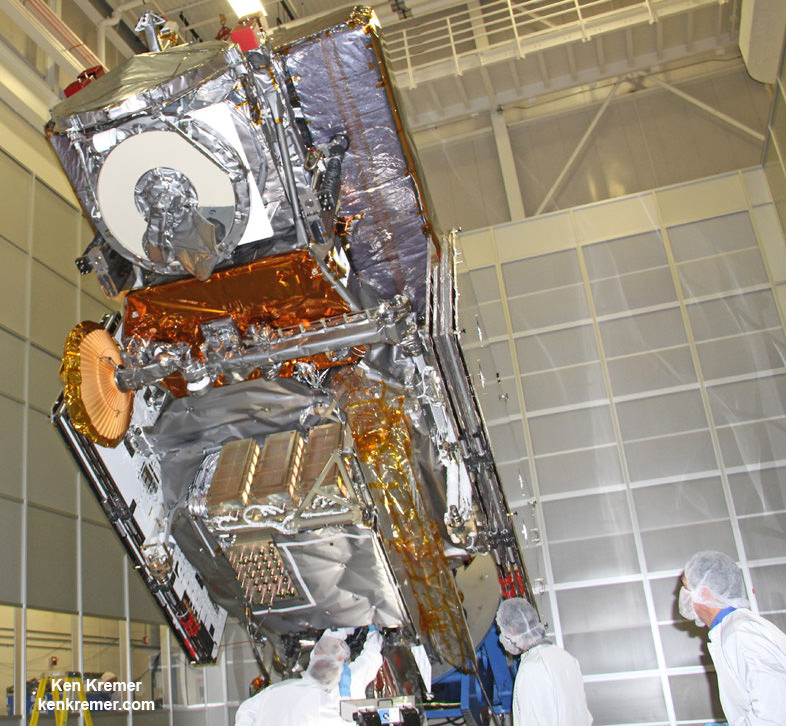
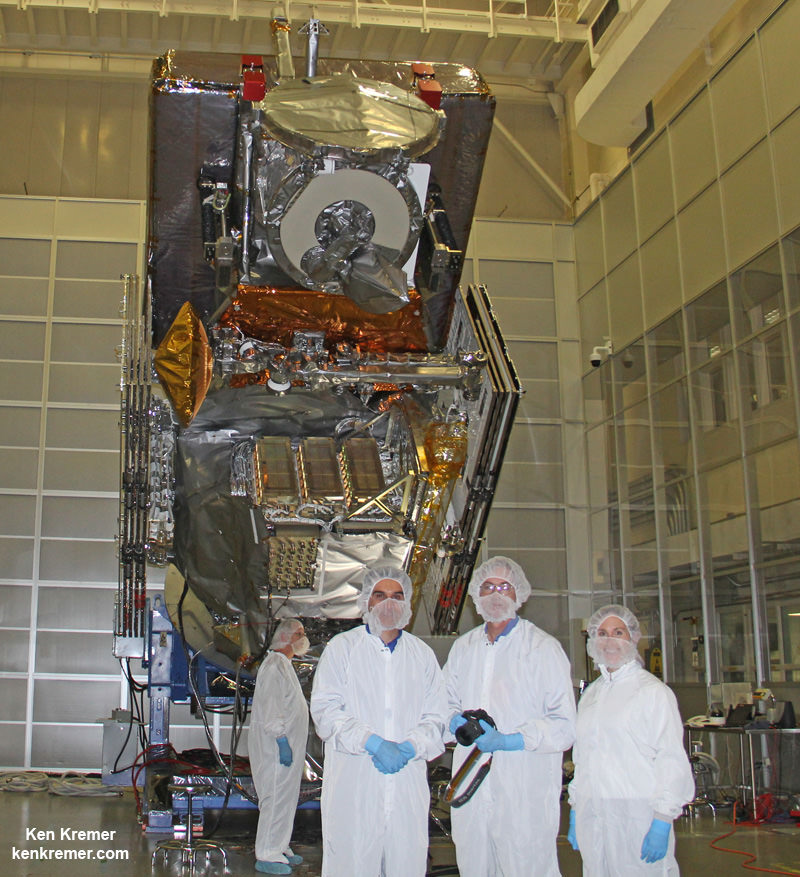
NASA’s next generation Global Precipitation Measurement (GPM) observatory inside the clean room at NASA Goddard Space Flight Center, MD. Technicians at work on final processing during exclusive up-close inspection tour by Universe Today. GPM is slated to launch on February 27, 2014 and will provide global measurements of rain and snow every 3 hours. Credit: Ken Kremer/kenkremer.com
“The GPM satellite was built in house by the dedicated team at NASA’s Goddard Space Flight Center in Maryland,” Azarbarzin told me.
“It’s the largest satellite ever built at Goddard.”
Following the flawless blastoff, the nearly four ton GPM spacecraft separated from the Japanese rocket some 16 minutes later at an altitude of 247 miles (398 kilometers).
10 minutes later both of the spacecrafts life giving solar arrays deployed as planned.
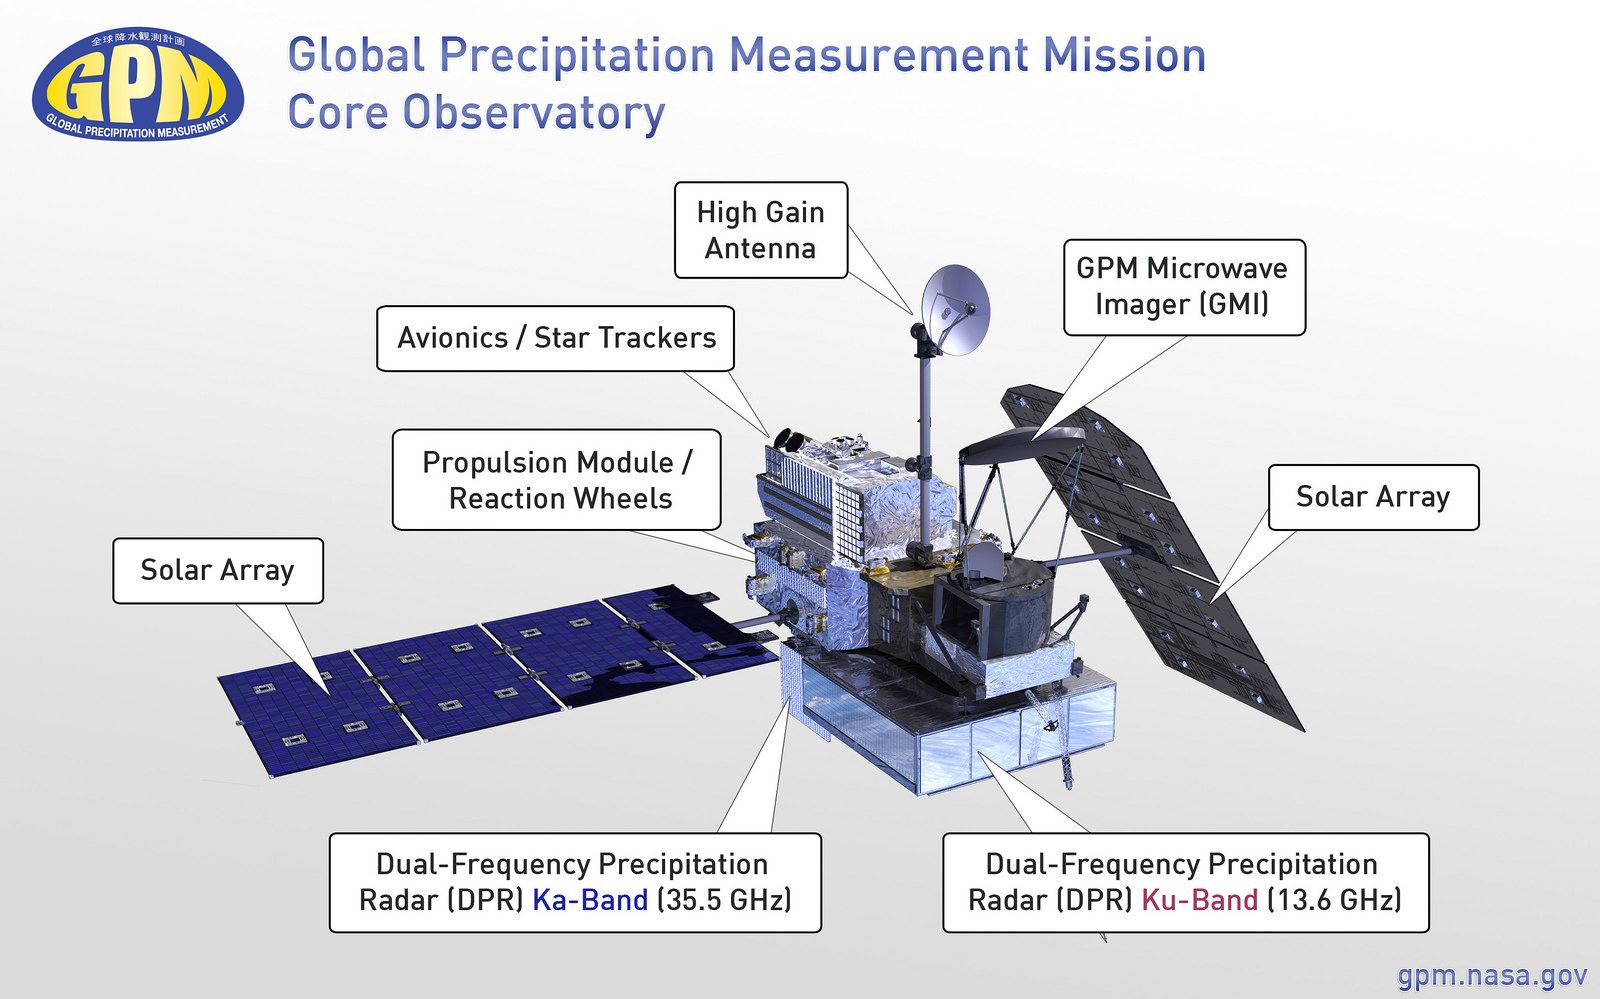
Major components of the GPM Core Observatory labeled, including the GMI, DPR, HGAS, solar panels, and more. Credit: NASA Goddard
“It is incredibly exciting to see this spacecraft launch,” said Azarbarzin, in a NASA statement. He witnessed the launch in Japan.
“This is the moment that the GPM Team has been working toward since 2006.”
“The GPM Core Observatory is the product of a dedicated team at Goddard, JAXA and others worldwide.”
“Soon, as GPM begins to collect precipitation observations, we’ll see these instruments at work providing real-time information for the scientists about the intensification of storms, rainfall in remote areas and so much more.”
The $933 Million observatory is a joint venture between the US and Japanese space agencies, NASA and the Japan Aerospace Exploration Agency (JAXA).
The 3850 kilogram GPM satellite is equipped with two instruments – an advanced, higher resolution dual -frequency precipitation (DPR) radar instrument (Ku and Ka band) built by JAXA in Japan and the GPM microwave imager (GMI) built by Ball Aerospace in the US.
The GPM observatory will replace the aging NASA/JAXA Tropical Rainfall Measuring Mission (TRMM) satellite launched back in 1997 and also jointly developed by NASA and JAXA.
“GPM is the direct follow-up to the currently orbiting TRMM satellite,” Azarbarzin explained to me.
“TRMM is reaching the end of its usable lifetime. After GPM launches we hope it has some overlap with observations from TRMM.”
GPM is vital to continuing the TRMM measurements. It will help provide improved forecasts and advance warning of extreme super storms like Hurricane Sandy and Super Typhoon Haiyan.
“TRMM was only designed to last three years but is still operating today. We hope GPM has a similar long life,” said Azarbarzin.
NASA astronaut Paul Richards (STS-102) discusses GPM at NASA Goddard Space Flight Center on Feb. 27, 2014. Credit: Ken Kremer/kenkremer.com
Stay tuned here for Ken’s continuing GPM reports and on-site coverage at NASA Goddard Space Flight Center in Maryland.
And watch for Ken’s continuing planetary and human spaceflight news about Curiosity, Opportunity, Chang’e-3, SpaceX, Orbital Sciences, LADEE, MAVEN, MOM, Mars, Orion and more.
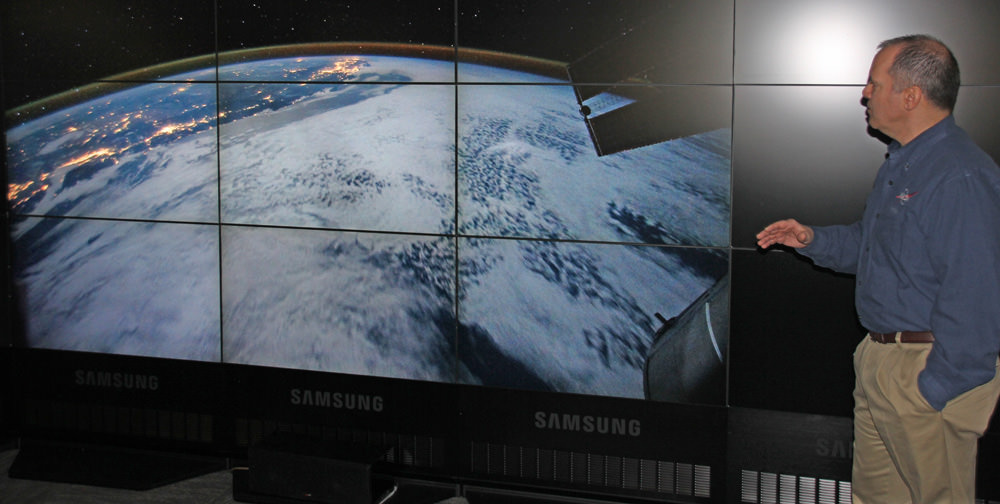
Visualization of the GPM Core Observatory and Partner Satellites. GPM launched on Feb. 27 from Japan. Credit: NASANASA/JAXA Global Precipitation Measurement (GPM) satellite inside the clean room at NASA Goddard Space Flight Center, MD, undergoes final processing during exclusive up-close inspection tour by Universe Today: Dr. Art Azarbarzin/NASA GPM project manager, Dr. Ken Kremer/Universe Today and Dr. Dalia Kirschbaum/NASA GPM research scientist. Credit: Ken Kremer/kenkremer.com
One of the most striking features of the climate change ‘debate’ is that it’s no longer a debate. Climate scientists around the world agree that climate change is very real — the Earth is warming up and we are the cause.
Yet while there is consensus even among the most reserved climate scientists, a portion of the public persistently disagrees. A recent Pew Research Center — an organization that provides information on demographic trends across the U.S. and the world — survey found that roughly four-in-ten Americans see climate change as a global threat. Climate scientists are racking their brains in an attempt to find out why.
Yale law professor Dan Kahan has done extensive research which reveals how our deep-rooted cultural dispositions might interfere with our perceptions of reality.
Why We Resist Climate Change
In 2010 Kahan led a study, “Cultural Cognition of Scientific Consensus,” which found that individuals tend to weigh evidence and credit experts differently based on cultural considerations. Psychological mechanisms allow individuals to selectively credit or dismiss evidence and experts, depending on whether the views presented match the dominant view of their group.
“There is an interdependence between people’s prior beliefs about risk and their exposure to and understanding of information,” Kahan told Universe Today. “People are motivated to search out information in a biased way. They look more for information that is consistent with their views than for information that is going to refute their views.”
Kahan’s study was administered online to 1,500 U.S. adults. Preliminary analyses wanted to determine if the public thought there was a scientific consensus regarding climate change and if there was a scientific consensus regarding human activity as the cause.
A majority — 55 percent — of the subjects reported their opinion that most scientists agree that global temperatures are rising, 12 percent believed most scientists do not find that global temperatures are rising, and 33 percent believed that scientists are divided on the topic. On whether or not human activity is the cause, 45 percent believed scientists agree that human activity is the cause, 15 percent believed scientists don’t think human activity is the cause, and 40 percent believed scientists are divided on the topic.
The public is generally not in a position to investigate the data for themselves or even read a scientific paper full of unfamiliar acronyms, plots and equations. Instead they turn to experts for assistance. Often times in determining who is credible, individuals will trust those who share similar world views and personal values. They tend to seek information congenial to their cultural predispositions.
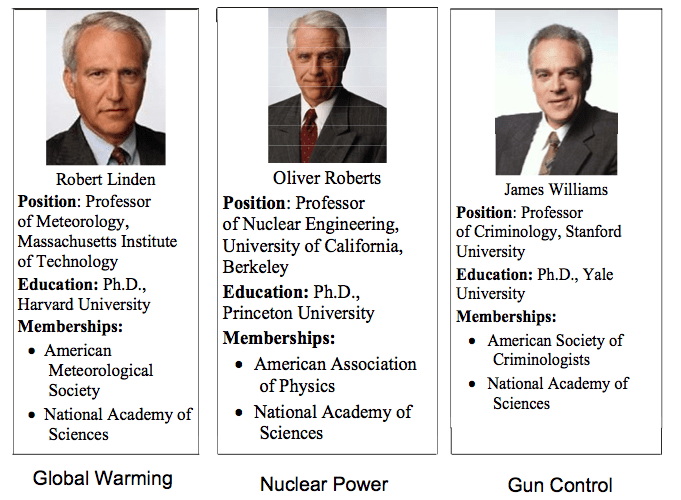
For Kahan’s first experiment, the subjects read the biographical information of an expert scientist. They had to decide whether he was credible, having earned a Ph.D. from an elite university and now serving as a faculty member of another elite university. Those who listed themselves as hierarchical — believing in stratified social roles (generally conservatives) — were more likely to find the expert scientist credible, while those who listed themselves as communitarian — expecting individuals to secure their own well-being (generally liberals) — were more likely to find the expert scientist not credible.
These fictional individuals were identified as credible or not based on their biographies only. Credit: Kahan et al. 2010
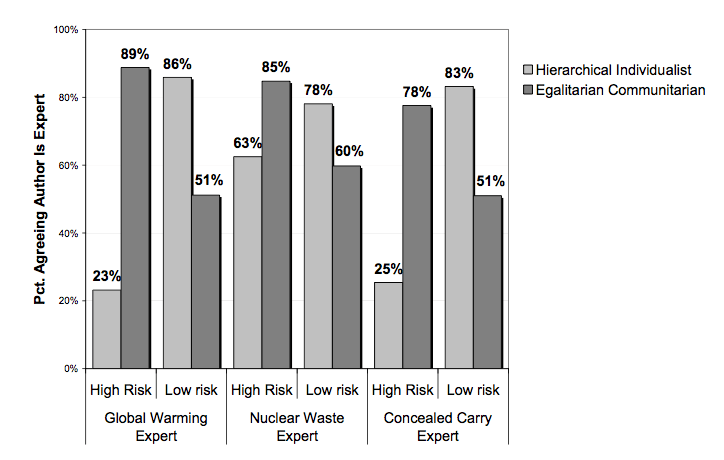
However, a second experiment showed the subjects not only the resume of the expert scientist but his position as well. Half the subjects were shown evidence that the expert believed in climate change, placing us at a high risk, while the other half of the subjects were shown evidence that the expert didn’t believe in climate change, placing us at a low risk.
The position imputed by the expert scientist dramatically affected the responses of the subjects. When the expert scientist supported a high risk position, 23 percent of the hierarchs and 88 percent of the communitarians found him credible. In contrast, when the expert scientist supported a low risk position, 86 percent of the hierarchs and 47 percent of the communitarians found him credible.
Whether the expert scientist was considered credible was highly associated with whether he took the position dominant in the subject’s cultural group. The subjects “have dispositions that are connected to their values that then will affect how they make sense of information,” Kahan said.
The percentage of subjects who found the author credible depending on whether he supported a high risk (climate change is real) or low risk (climate change is not real) position. Credit: Kahan et al. 2010
At the end of the day the conclusion is simple: we’re human. And this leads us to take the path of least resistance: we choose to believe in what those around us believe.
So it’s not that people aren’t sufficiently rational. “They’re too rational,” Kahan said. “They’re too good at extracting from the information you’re giving them, which sends the message that tells them what position they should take given the kind of person they are.”
Moving Forward
Kahan’s study shows that scientific consensus alone will not sway the public. The public will remain polarized despite efforts to increase trust in scientists or simply awareness of scientific research. Instead the key is to use science communication strategies, which reduce the likelihood the public will find climate change threatening.
In a more recent study, published in Nature, Kahan analyzed two techniques of science communication that may help break the connection between cultural predispositions and the evaluation of information.
The first technique is to frame the information in a manner that doesn’t threaten people’s values. In this study, Kahan and his colleagues asked participants to once again assess the credibility of climate change. But before doing so the subjects had to read an article.
One article was a study suggesting that carbon dissipates from the atmosphere much slower than scientists had previously thought. As a result, if we stopped producing carbon today, there would still be catastrophic effects: rising sea level, drought, hurricanes, etc. Another article (shown to a different group) gave information on geo-engineering or nuclear power — potential technological advances that may help reduce the effects of climate change. A final control group read an unrelated article on traffic lights.
Logically all of these articles had nothing to do with whether climate change is valid. But psychologically these articles did determine the meaning that people attached to the evidence of climate change. In all cases the hierarchs were less likely than the communitarians to say climate change is valid. But the gap was 29 percent smaller among the group that was first exposed to geo-engineering than the group that was exposed to regulating carbon.
“The evidence of whether there is a problem doesn’t depend on what you’re going to do about it,” Kahan said. “But psychologically it can make a difference.”
People tend to resist scientific evidence that may lead to restrictions on their personal activities, or evidence that threatens them as individuals But if they are presented with information in a way that upholds their identities, they react with an open mind.
The second technique is to ensure that climate change is vouched for by a diverse set of experts. If a particular group is able to identify with that expert, then that group will be more open-minded in addressing the study. This will help reduce the initial polarization between hierarchs and communitarians.
Kahan argues that science “needs better marketing.” It needs to combine climate change with meanings that are affirming rather than threatening to people. When groups can identify with the expert, or are presented with possible solutions to climate change, the individuals in that group will stop attaching the issues to identity.
According to Kahan, in order to move forward, science communication needs to change the narrative. It needs to mitigate the connection between climate change and the individual. In order for there to be a public consensus on climate change it has to be presented in a less threatening manner.
This doesn’t mean that science communication has to avoid the nasty truth about climate change in order to finally reach a public consensus. Instead it has to spin climate change in a positive way — a way that is less threatening to the individual.
Science communication has to focus the public’s attention on what so many individuals value: efficiency, not being wasteful, innovation and moving forward. Only then will the public reach a consensus where there is now only polarization.
Special Guests: Stephen Pakbaz, designer of the LEGO Mars Rover Kit, and Ray Sanders from CosmoQuest, who is unboxing and building the kit as we hang out!
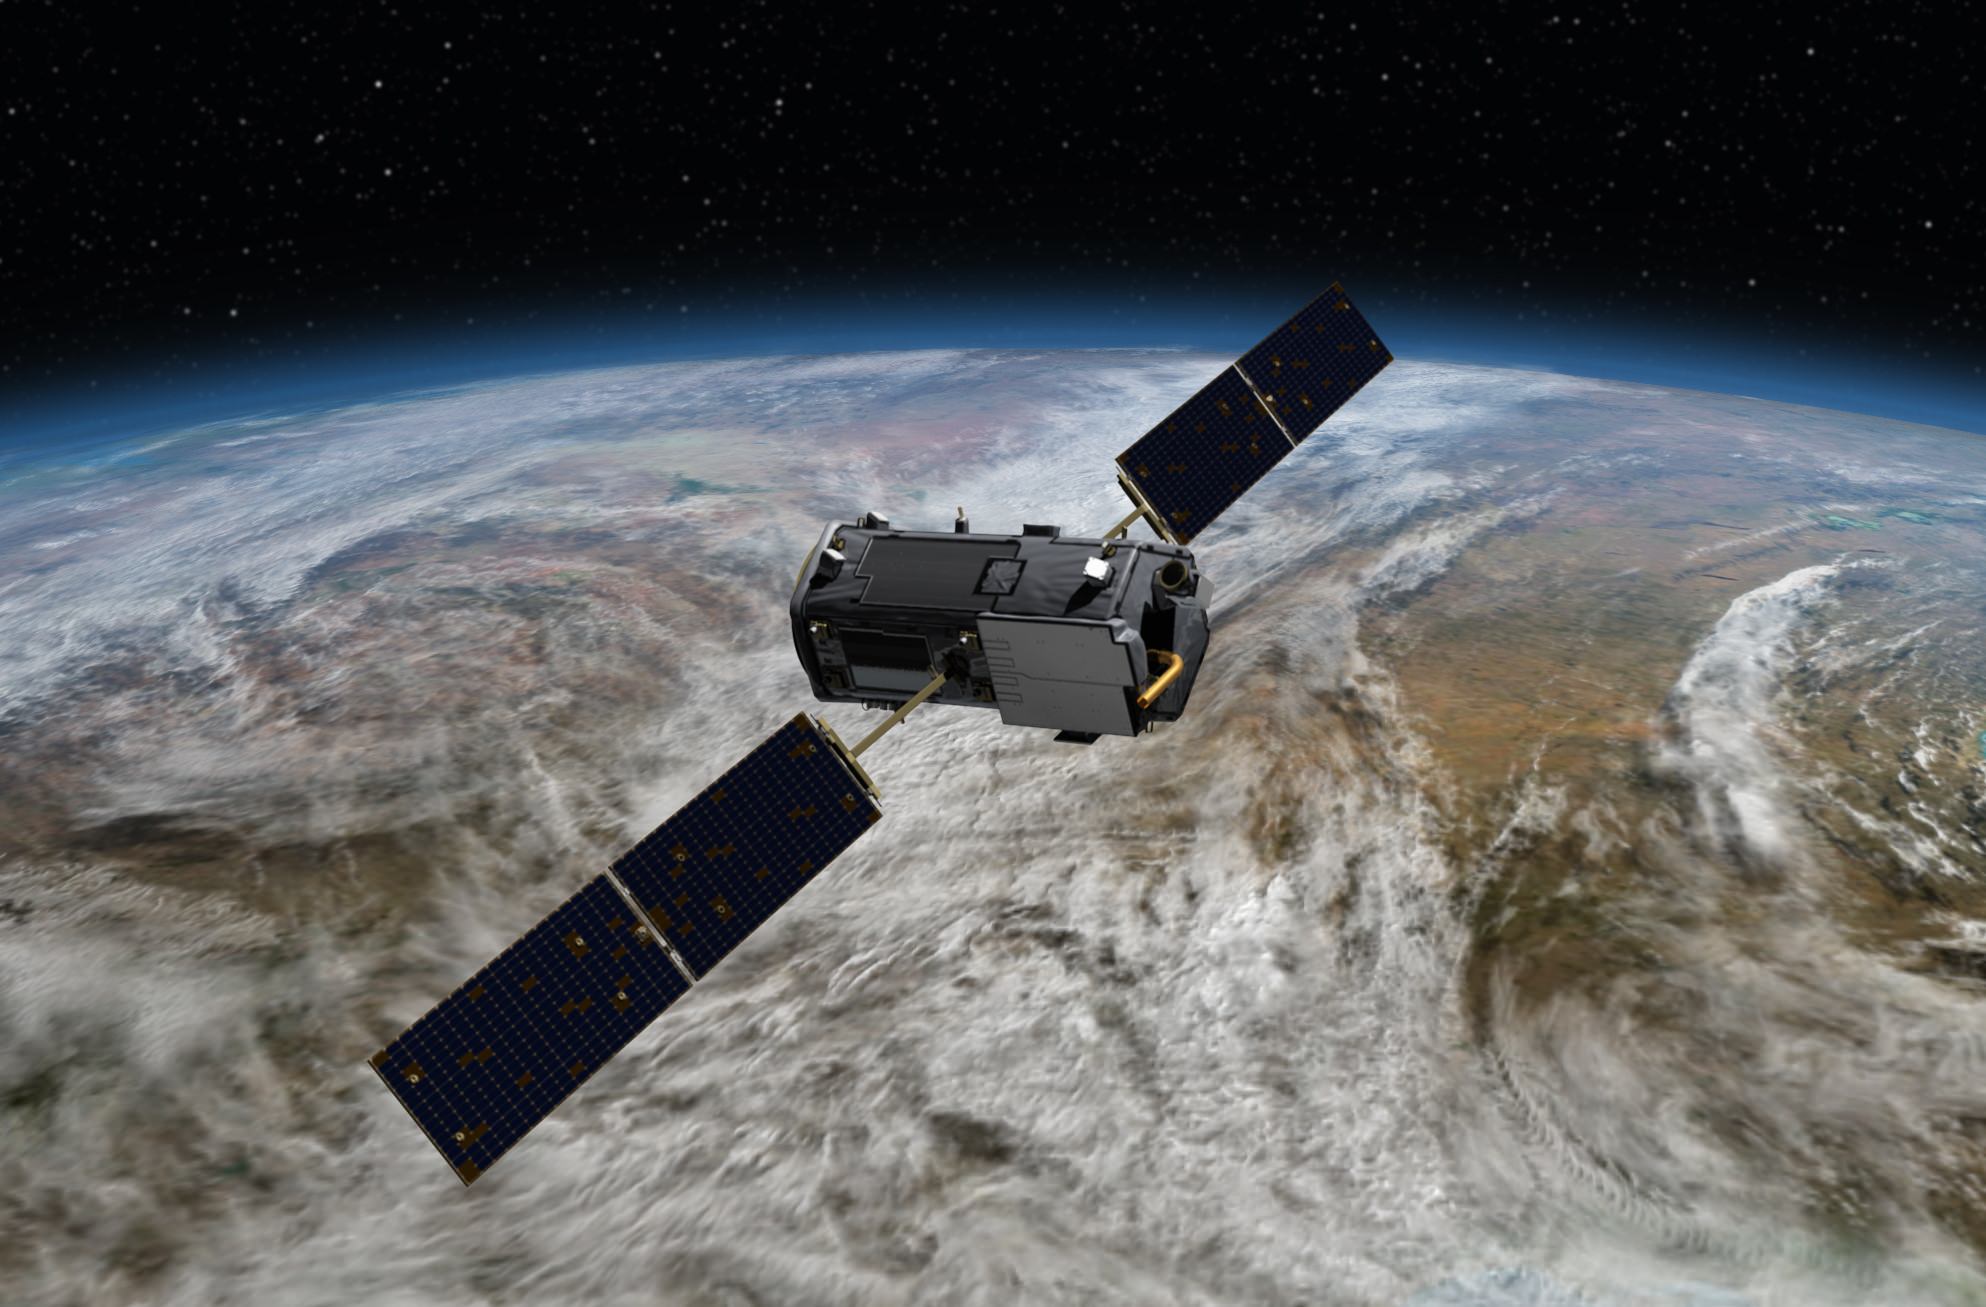
Artist's conception of NASA's Orbiting Carbon Observatory, which will examine carbon dioxide in the atmosphere (and its effect on climate change) after an expected launch in July 2014. Credit: NASA
How badly will climate change affect our planet? Different models tell us different things, and that’s partly because we need more precise information about the factors that warm the world. How much is sea level rising? What are the levels of carbon dioxide in the atmosphere? All of these things must be known.
NASA expects to launch five Earth science missions this year, which is the biggest roster in more than a decade. They’ll track rainfall, seek water hiding in soil, and examine carbon dioxide and ocean winds around the world. Here’s a quick rundown of the busy launch schedule:
Global Precipitation Measurement (GPM) Core Observatory (Feb. 27): This will be the first of a series of satellites to look at snow and rain from space. “This new information will help answer questions about our planet’s life-sustaining water cycle, and improve water resource management and weather forecasting,” NASA stated. This joint spacecraft with the Japanese Aerospace Exploration Agency (JAXA) will launch from Japan’s Tanegashima Space Center on a H-IIA rocket. GPM was built at NASA’s Goddard Space Flight Center in Maryland.
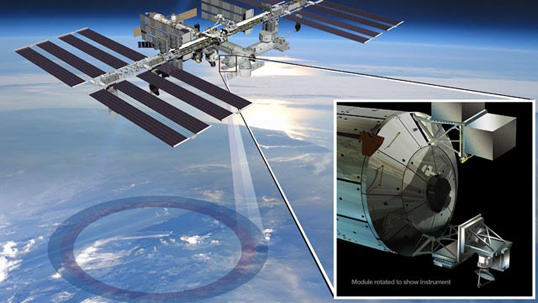
ISS-RapidScat (June 6): This sensor will sit on the International Space Station and monitor ocean winds (including storms and hurricanes). What’s interesting about this mission is its use of old parts, NASA points out, as well as the decision to mount it on a station rather than take the more expensive route of making it a separate satellite. The probe will launch on a SpaceX Dragon spacecraft (aboard a SpaceX Falcon 9 rocket) from Florida’s Cape Canaveral Air Force Station as part of a regular commercial resupply flight.
Artist’s conception of how ISS-RapidScat will work. Credit: NASA/JPL-Caltech/Johnson Space Center
Orbiting Carbon Observatory (OCO)-2 (July): NASA plans to take a second crack at this type of satellite after the OCO launch failure in 2009. The satellite will seek out carbon dioxide to better understand where it is emitted (in both natural and artificial processes) and how it moves through the water, air and land. This will launch from California’s Vandenberg Air Force Base on a Delta II rocket. OCO-2 will be managed by NASA’s Jet Propulsion Laboratory in California.
Cloud-Aerosol Transport System (CATS) (Sept. 12): This technology demonstration project will use lasers, in three wavelengths, to examine tiny particles borne into the atmosphere from phenomena such as pollution, smoke, dust and volcanoes. “These aerosol particles pose human health risks at ground level and influence global climate through their impact on cloud cover and solar radiation in Earth’s atmosphere,” NASA stated. This will also leave Earth aboard a SpaceX resupply flight from Cape Canaveral.
Soil Moisture Active Passive (SMAP) mission (November): Will check out the moisture level of soil, with the aim of refining “predictions of agricultural productivity, weather and climate,” NASA stated. Also managed by JPL, this satellite will spend its time in an almost-polar “sun-synchronous” orbit that keeps the sun’s illumination below constant during SMAP’s turns around the Earth. SMAP will launch from Vandenberg on a Delta II rocket.
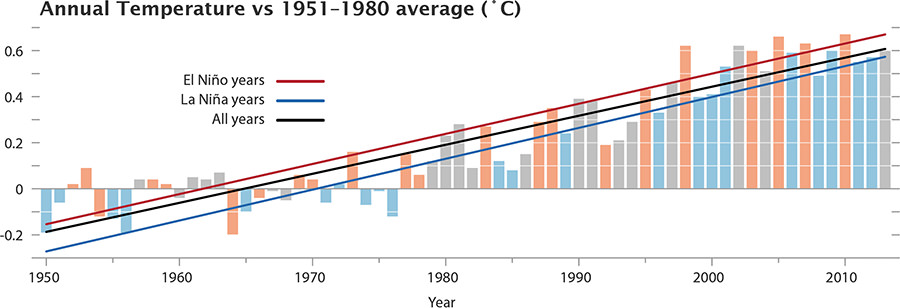
Chart of the temperature anomalies for 1950-2013, also showing the phase of the El Niñ0-La Niña cycle. (Image Credit: NASA/GSFC/Earth Observatory, NASA/GISS)
The latest statistics are in from 2013 and both NASA’s and NOAA’s measurements of global temperatures show Earth continued to experience temperatures warmer than those measured several decades ago.
NASA scientists say 2013 tied with 2009 and 2006 for the seventh warmest year since 1880, continuing a long-term trend of rising global temperatures, while NOAA – which uses a different method of analyzing temperature data – said that 2013 tied with 2003 as 4th-warmest year globally since 1880.
“The long-term trends are very clear, and they’re not going to disappear,” said climatologist Gavin Schmidt from NASA’s Goddard Institute for Space Studies (GISS). “It isn’t an error in our calculations.”
Land and ocean global temperatures in 2013 from both NASA and NOAA. Via NASA.
NASA data shows that since 1950, average temperatures have increased 1.1°F to an average of 58.3° in 2013.
NOAA data shows the average temperature across global land and ocean surfaces was 1.12 degrees above the 20th-century average. This is the 37th consecutive year that the annual temperature was above the long-term average.
This coincides with another recent study that showed the so-called “pause” in global warming is not happening, and that the temperatures over the past 15 years are still on the rise.
Both NASA and NOAA scientists say the increase in greenhouse gas levels continue to drive the temperature increase.
Additionally, with the exception of 1998, the 10 warmest years in the 134-year record all have occurred since 2000, with 2010 and 2005 ranking as the warmest years on record.
NASA says the average temperature in 2013 was 58.3 degrees Fahrenheit (14.6 Celsius), which is 1.1 F (0.6 C) warmer than the mid-20th century baseline. The average global temperature has risen about 1.4 degrees F (0.8 C) since 1880, according to the new analysis. Exact rankings for individual years are sensitive to data inputs and analysis methods.
“Long-term trends in surface temperatures are unusual and 2013 adds to the evidence for ongoing climate change,” GISS climatologist Gavin Schmidt said. “While one year or one season can be affected by random weather events, this analysis shows the necessity for continued, long-term monitoring.”
Scientists emphasize that weather patterns always will cause fluctuations in average temperatures from year to year, but the continued increases in greenhouse gas levels in Earth’s atmosphere are driving a long-term rise in global temperatures. Each successive year will not necessarily be warmer than the year before, but with the current level of greenhouse gas emissions, scientists expect each successive decade to be warmer than the previous.
More from NASA:
Carbon dioxide is a greenhouse gas that traps heat and plays a major role in controlling changes to Earth’s climate. It occurs naturally and also is emitted by the burning of fossil fuels for energy. Driven by increasing man-made emissions, the level of carbon dioxide in Earth’s atmosphere presently is higher than at any time in the last 800,000 years.
The carbon dioxide level in the atmosphere was about 285 parts per million in 1880, the first year in the GISS temperature record. By 1960, the atmospheric carbon dioxide concentration, measured at the National Oceanic and Atmospheric Administration’s (NOAA) Mauna Loa Observatory in Hawaii, was about 315 parts per million. This measurement peaked last year at more than 400 parts per million.
While the world experienced relatively warm temperatures in 2013, the continental United States experienced the 42nd warmest year on record, according to GISS analysis. For some other countries, such as Australia, 2013 was the hottest year on record.
The temperature analysis produced at GISS is compiled from weather data from more than 1,000 meteorological stations around the world, satellite observations of sea-surface temperature, and Antarctic research station measurements, taking into account station history and urban heat island effects. Software is used to calculate the difference between surface temperature in a given month and the average temperature for the same place from 1951 to 1980. This three-decade period functions as a baseline for the analysis. It has been 38 years since the recording of a year of cooler than average temperatures.
The GISS temperature record is one of several global temperature analyses, along with those produced by the Met Office Hadley Centre in the United Kingdom and NOAA’s National Climatic Data Center in Asheville, N.C. These three primary records use slightly different methods, but overall, their trends show close agreement.
You can read NASA’s press release here, and NOAA’s here. Here is a link to a presentation of the data released today from Gavin Schmidt of NASA and Tom Karl, director of NOAA’s Climatic Data Center.
We are awash in the unseen, the unknown and the unexplained. Our Universe is enshrouded in mystery. Even what we do know — the complex physical laws that describe the planets, stars and galaxies — can seem just beyond any normal human being’s grasp. We can’t all be Einsteins, after all.
But excluding string theory, dark energy and quantum field theory most of science is remarkably within our grasp. And in less than a minute, a concept as culturally conflicted and misunderstood as global warming, can be explained. See above.
The motivation behind this video is simple. Research shows that virtually no Americans — roughly 0 percent — can explain the physical mechanisms of global warming at even a basic level. So Berkeley Professor Michael Ranney and colleagues created a total of five videos (with the longest clocking in at 656 words in under five minutes) with the hope of elucidating the basics of global warming.
Their initial study, completed in 2011, surveyed 270 people in San Diego parks in order to assess how well the average American understands global warming. San Diego was chosen because it draws tourists from across the United States, and would thus create a better rounded sample.
“The main concept we were hoping people would tell us, which is at the heart of understanding global warming, is that there is an asymmetry between stuff that’s coming in to our planet and stuff that’s heading out,” Ranney told Universe Today.
This asymmetry explains why sunlight (in the form of visible light) may enter the atmosphere unhindered but is later impeded by greenhouse gases (because it is no longer in the form of visible light — it has been absorbed by the Earth and emitted in the form of infrared light). But not a single person could explain global warming at this basic level.
“We were shocked at how few people knew this” Ranney said. “I thought it was a moral imperative to get the word out as fast as possible.”
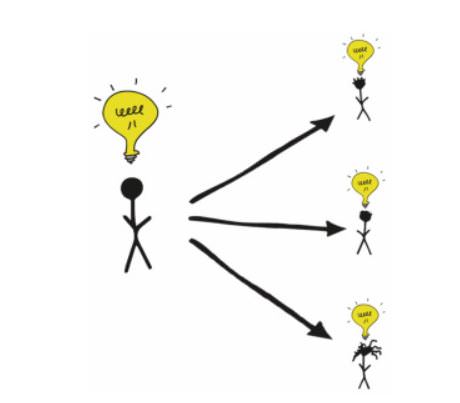
So Ranney and his colleagues set out with their work in front of them, creating the videos in order to increase the average American’s understanding of global warming. Their goal is that any one of the five videos will change the lives of seven billion viewers.
“We hope that a video of 400 words or even 35 words will allow people to have a moment in time to which they fix that they knew what the mechanism of climate change was,” Ranney told Universe Today. For that single moment “their knowledge was obvious, valid, understandable and available.”
In order to drive this point home, Ranney used an analogy that began like this: “So a climate change acceptor walks into a bar.” But all jokes aside, if one who accepts anthropogenic global warming tries to convince the man sitting next to him that global warming is real, but cannot explain the physical mechanism behind global warming, then he’s in trouble. He’s likely not only lost his bar mate but encouraged a life-time of global warming denial.
We cannot expect to increase the public’s awareness and acceptance of climate change without a huge increase in scientific literacy. Even if every viewer can’t recall the exact mechanistic details of global warming they can at least say to the man sitting next to them at the bar: “Look, I can’t regurgitate it now but I did understand it then.”
This graph from NOAA shows the annual trend in average global air temperature in degrees Celsius, through December 2012. For each year, the range of uncertainty is indicated by the gray vertical bars. The blue line tracks the changes in the trend over time. Click here or on the image to enlarge. (Image courtesy NOAA’s National Climatic Data Center.)
A second study provided college students with an explanation akin to the one found in the five-minute video. After reading it, the students not only understood global warming better but they were also more likely to accept global warming as a reality — suggesting these videos have the power to change people’s minds.
“Eventually people come to appreciate salient evidence,” Ranney told Universe Today. “Let’s say you think you’re in a fantastic monogamous relationship. If you come home and find your partner with someone else, it only takes that one moment in time to change your belief.”
Helping people to understand the basic physics behind global warming is a vital tool in convincing them that global warming is as real as it gets. Once someone clicks on the video, the next 52 seconds alone might leave a pretty big impact.
Ranney emphasized help from graduate student Lee Nevo Lamprey, undergraduate student Kimberly Le and other collaborators (including Dav Clark, Daniel Reinholz, Lloyd Goldwasser, Sarah Cohen and Rachel Ranney).
The Earth at night. What will it look like 100 years from now? Image credit: NASA-NOAA
The Earth is warming up.
Ocean temperatures are rising. Arctic sea ice is melting. Atmospheric carbon dioxide levels are growing. The oceans are becoming more acidic. The weather is already more extreme.
With the release of the fifth Assessment Report by the Intergovernmental Panel on Climate Change – a panel of more than 2,500 experts, more commonly known as the IPCC – it’s clear that climate change is very real. But it’s especially clear that we are the cause. If we don’t act now by taking vigorous action to reduce emissions the results will be catastrophic.
Toward the end of this 900-page report, the IPCC looked toward our future, focusing on the climate after the year 2100. Here, Universe Today, explores two extreme scenarios for the Earth by 2100.
1.) Embracing the Challenges of Climate Change
The conclusions reached by climate scientists at the end of the 21st Century were undeniable. We embraced climate change by investing heavily in renewable energies. Both large-scale companies and individuals bought energy drawn from the sunlight, wind, and geothermal heat.
Homes across the world became more sustainable. Their total square feet shrunk, as home owners learned to live with less. It was not uncommon to dress a roof with plants or solar panels. Even the layout of homes changed. They rested partially underground, taking advantage of geothermal heat, and faced South (in the case of the Northern hemisphere) to take advantage of the warm sunlight.
We also embraced geoengineering technologies. We added artificial clouds to our atmosphere, which reflected sunlight, and built towers to collect greenhouse gas emissions. The gases are now trapped deep underground. Our goal was not only to slow the process of climate change, but to stop it, and quite possibly reverse it.
We now eat far less meat than we did in the early 21st Century to cut the emissions generated from livestock farming. Pastures have been replaced with booming forests – helping to absorb CO2. We also eat more locally.
The world followed in China’s footsteps and restricted couples to a certain number of children, reducing our overall population.
We live in small compact cities where we drive hybrid cars and take public transport to work. Carbon offsets must be purchased when taking long trips. Most families vacation in their own backyard – exploring all that nature has to offer in the nearby vicinity.
We viewed climate change as an exciting opportunity to embrace the needs of our environment. We now live much simpler lives and the census shows that our overall intelligence and happiness is much higher than it was a century ago.
2.) The Point of No Return
We simply didn’t want to face the facts. We live in a global economy with a population that has increased significantly over the last century. Most of our energy still comes from fossil fuels. We never invested in renewable energies.
We measure our happiness based on the cars we drive, the number of material possessions we can cram into our large homes, and how often we travel the globe.
The world is, on average, 9 degrees warmer. The entire arctic has melted. Ocean levels have risen by over a meter – flooding coastal communities across the world. Millions have been left homeless.
Our weather is extreme. Hurricanes, tornadoes, fires, floods, draughts, and earthquakes kill hundreds of thousands per year. Climate change has devastated food production and water supplies.
Air quality is much poorer across the world. Due to haze, it is perfectly safe to look at the sun directly. We can only see a third of the stars visible a century ago.
We have triggered various tipping points. The thawing of permafrost released further CO2 and methane. Large areas of the planet are becoming uninhabitable. Our efforts are working toward damage control only. We fear that it may be too late.
Climate change is still in our hands, but we have to act now.
The fifth Assessment Report by the IPCC may be found here. Emphasis in this article may be found in the long term climate change section, as well as descriptions published by the IPCC in 2000.
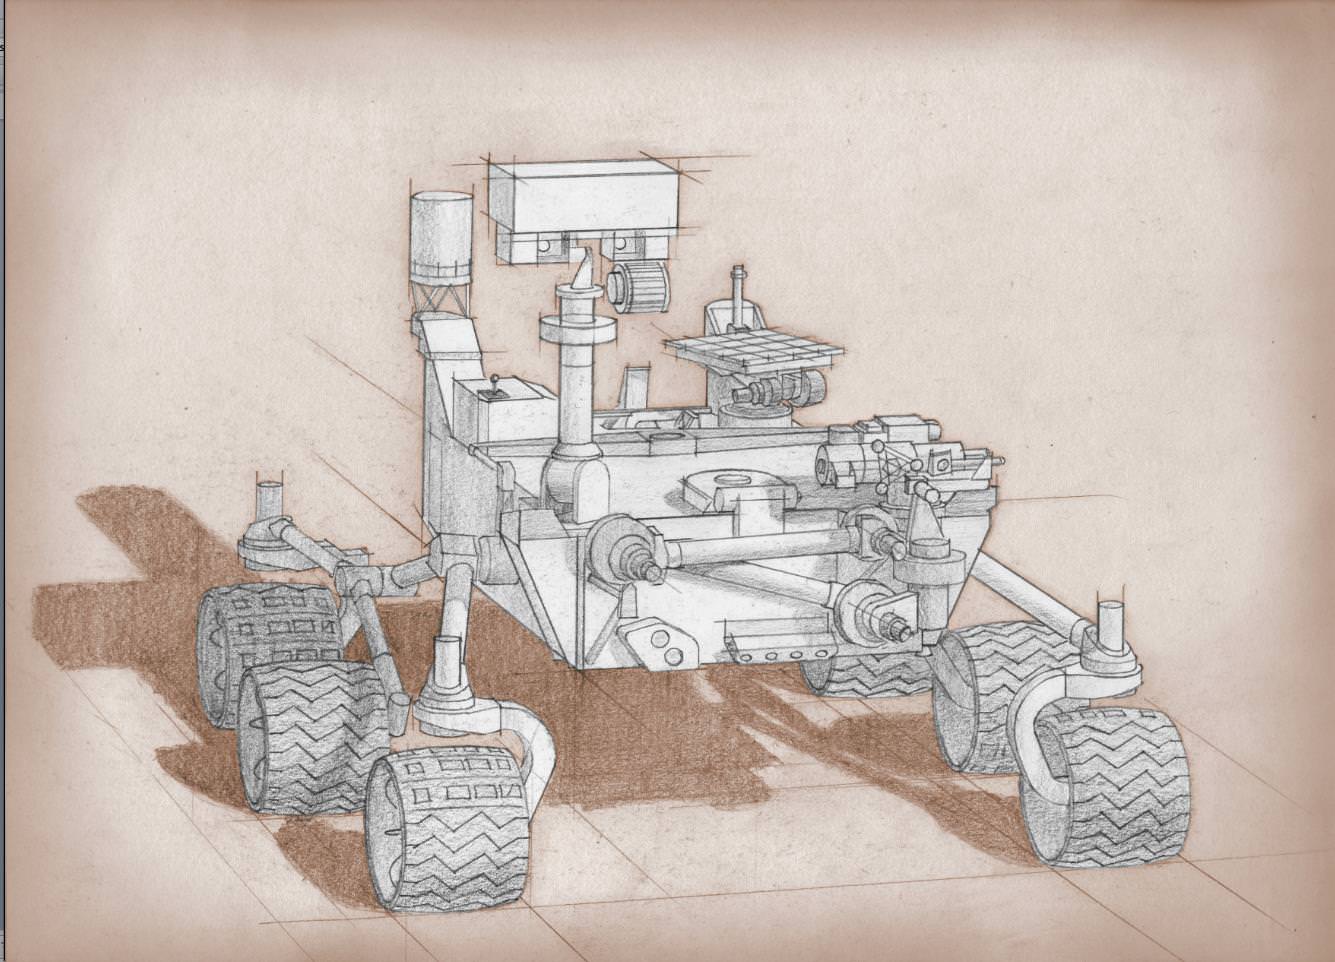
Artist's conception of the Mars 2020 rover. Credit: NASA
As Day 2 of the United States government shutdown continues, some short-term effects are already in evidence when it comes to Earth and space.
Most of the NASA and National Oceanic and Atmospheric Administration (NOAA) websites are offline. Social media updates are silent. At NASA, 97% of agency employees are off work and media reports indicate that 55% of NOAA’s employees are furloughed.
If the shutdown lasts for very long, however, long-term programs could feel the pain. This includes a couple of Mars missions NASA is developing, as well as Earth-based climate research and satellite observation from NOAA.
Mars 2020
A twin rover to Mars Curiosity, called Mars 2020 for now, is expected to leave for the Red Planet in 2020 and do investigations into past life and habitability. Planning is still in the early stages, but an announcement of opportunity for science investigators was supposed to happen on Oct. 8. Notices of intent were due Oct. 15.
“The preproposal conference, scheduled for 10/8, may be rescheduled and the due date for NOIs (currently 10/15) could be delayed, if the government is still shut down closer to those dates,” NASA officials wrote in an update before the shutdown on Monday.
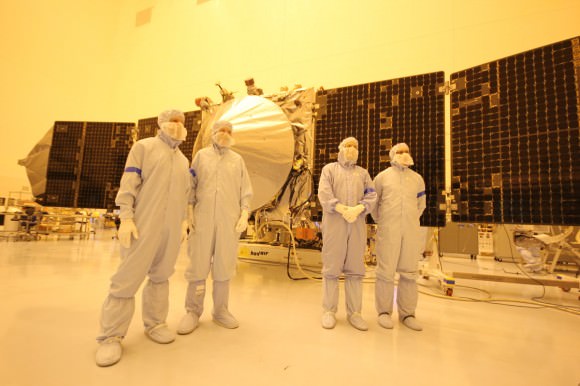
MAVEN team members, including chief scientist Bruce Jakosky (2nd from left) pose with spacecraft inside the cleanroom at the Kennedy Space Center on Sept. 27, 2013. Credit: Ken Kremer/kenkremer.com
MAVEN
As widely reported yesterday, the next Mars orbiter from NASA is expected to lift off from Earth on Nov. 18. Now, however, preparatory work has ceased and there is some concern from team members that it will miss the launch window, which extends into December. At worst, this means MAVEN’s launch could be delayed until 2016, when the next opportunity opens.
“The hardware is being safed, meaning that it will be put into a known, stable, and safe state,” Bruce Jakosky, MAVEN’s principal investigator, told Universe Today‘s Ken Kremer yesterday. “We’ll turn back on when told that we can. We have some margin days built into our schedule.”
NOAA
As with NASA, NOAA is keeping up with mission-critical activities — which in their case, includes weather forecasting. Long-term climate research, however, is reportedly being shelved.
“For example, Harold Brooks, a top tornado researcher who works at the National Severe Storms Laboratory in Norman, Okla., reported his furlough notice on Facebook on Tuesday,” Climate Central wrote on Oct. 1. “Much of the staff at NOAA’s Earth Systems Research Lab and the Geophysical Fluid Dynamics Laboratory, except for positions related to maintaining computing resources, have also been furloughed. Those two labs are heavily involved in NOAA’s climate research programs.”
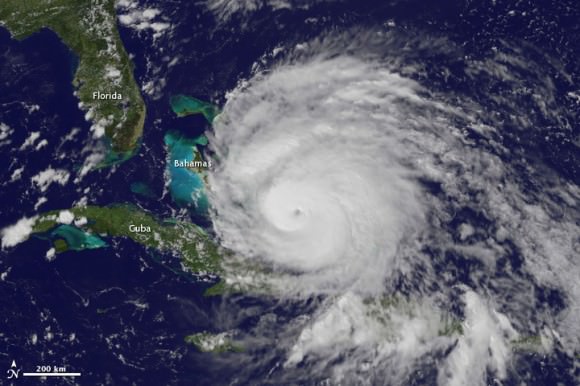
A view of Hurricane Irene taken by the GOES satellite at 2:55 p.m. Eastern Daylight Time on August 24, 2011. Credit: NASA
Observers are also worried that a lengthy shutdown could push back the time when new weather satellites become available. There have been multiple reports about a “weather satellite gap” coming in the United States as many of NOAA’s geostationary and polar-orbiting satellites are nearing the end of their expected lives. The Subcommittees on Oversight and Environment held hearings into this issue in September.
What’s still online?
These are some of the programs that are still happening at NASA and NOAA:
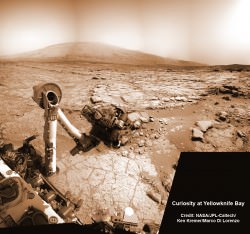
NASA’s Curiosity rover reaches out in ‘handshake’ like gesture with dramatic scenery of Mount Sharp in the background. This mosaic of images was snapped by Curiosity on Sol 262 (May 2, 2013) and shows her flexing the robotic arm. Two drill holes are visible on the surface bedrock below the robotic arm’s turret. Credit: NASA/JPL-Caltech/Ken Kremer-(kenkremer.com)/Marco Di Lorenzo
NASA:
Bare-bones management on programs such as the International Space Station and several robotic missions that are already in operation (such as the Lunar Atmosphere and Dust Environment Explorer (LADEE).
Certain missions are in critical phases that could be hurt if work stops, such as the James Webb Space Telescope, which is undergoing cryogenic testing on some of its instruments.
Several missions run out of the Jet Propulsion Laboratory and Applied Physics Laboratory are still running as usual, according to the Planetary Society, as these receive contract money from NASA; this means Mars Curiosity is still working, for example.
The Mars Reconnaissance Orbiter’s HiRISE camera is still snapping pictures, its Twitter account reported, which is positive given that it was intended to snap shots of Comet ISON during its closest approach to Mars yesterday.
The decades-long Landsat Earth observation program is still operating, according to The Atlantic, with data being sent back to Earth as usual. The difference is this information won’t be packaged as usual until government operations restart.
NOAA (all information according to this Department of Commerce document):
The Office of Oceanic and Atmospheric Research will keep 73 employees on board “to ensure continuity of crucial long-term historical climate records, and real-time regular research to support ongoing weather and air quality prediction services,” NOAA said.
184 employees will stay with the Environmental Satellite and Data Information Service for command and control of several satellites for NOAA and the Department of Defense.
474 employees will remain with the National Marine Fisheries Service. 174 are funded in another form besides appropriations. The others are a mix of law enforcement, fisheries management and property protection officials.
490 employees are with the Office of Marine and Aviation Operations for observational data collection related to weather forecasting.
173 employees are with the National Ocean Service. 17 are funded outside of appropriations, while the 156 remaining “are required to protect against imminent and significant threats to life and property by supporting safe maritime commerce in U.S. waters, including real-time water level data for ships entering U.S. ports, critical nautical chart updates, and accurate position information,” NOAA stated. Some are also monitoring marine health aspects such as algal blooms.
There are 19 IT-related employees and 20 employees providing support services.
The large bulk of employees still at work, 3,935 people, are with the National Weather Service to keep up weather forecasting.
There’s no word yet on when government employees could go back to work. Congress representatives are jousting over the implementation of a spending bill to keep the money flowing to government departments. One big issue: whether to include the Affordable Care Act, sometimes dubbed Obamacare, in the bill.
Another deadline is looming, too. Treasury Secretary Jack Lew has warned repeatedly that on Oct. 17, if the debt ceiling is not raised, the United States government may default on some financial obligations.