The rift in the Larsen C Ice Shelf. Credit: NASA/John Sonntag
Located along the east coast of the Antarctic Peninsula is the Larsen Ice Shelf. Named after the Norwegian Captain who explored the ice front back in 1893, this ice shelf has been monitored for decades due to its close connection with rising global temperatures. Essentially, since the 1990s, the shelf has been breaking apart, causing collapses of considerable intensity.
According to the British Antarctic Survey (BAS), the section of the ice sheet known as the Larsen C Ice Shelf could be experiencing a collapse of its own soon enough. Based on video footage and satellite evidence of the sizeable rift (which is 457 m or 15oo ft across) in the shelf, it is believed that an ice berg that is roughly 5,000 km² (1930.5 mi²) in size could be breaking off and calving into the ocean in the near future.
An ice shelf is essentially a floating extension of a land-based glacier. In this case, the Larsen Ice Shelf is seaborne section of the larger Larsen Glacier, which flows southeast past Mount Larsen and enters the Ross Sea just south of Victoria Land. These shelves often act as buttresses, holding back glaciers that flow down to the coast, thus preventing them from entering the ocean and contributing to rising sea levels.
In the past twenty-two years, the Larsen A and B ice shelves (which were situated further north along the Antarctic Peninsula) both collapsed into the sea. This resulted in the dramatic acceleration of glaciers behind them, as larger volumes of ice were able to flow down the coast and drop into the ocean. While Larsen C appeared to still be stable, in November of 2016, NASA noted the presence of a large crack in its surface.
This crack was about 110 kilometers (68 mi) long and was more than 91 m (299 ft) wide, reaching a depth of about 500 m (1,600 ft). By December, the rift had extended another 21 km (13 mi), which raised concerns about calving. In February of 2017, satellite observations of the shelf noted that the crack appeared to have grown further, which confirmed what researches from the MIDAS project had previously reported.
This UK-based Antarctic research project – which is based at Swansea University and Aberystwyth University in Wales and supported by the BAS and various international partners – is dedicated to monitoring the Larsen C ice shelf in Antarctica. Through a combination of field work, satellite observations, and computer simulations, they have catalogued how recent warming trends has caused seasonal melts of the ice shelf and affected its structure.
And in recent years, they have been monitoring the large crack, which has been fast-moving, and noted the appearance of several elongations. It was during the current Antarctic field season that members of the project filmed what the crack looked like from the air. In previous surveys, the glaciology research team has conducted research on the ice shelf using seismic techniques to survey the seafloor beneath it.
However, this past season, they did not set up on the ice shelf itself for fear of a calving event. Instead, they made a series of trips to and from the UK’s Rothera Research Station aboard twin otter aircraft. During an outing to retrieve some of their science equipment, the crew noted how the crack looked from above and started filming. As you can see from the footage, the rift is very wide and extremely long.
What’s more, the team estimates that if an iceberg from this shelf breaks off and falls into the ocean, it will likely be over three times the size of cities like London or New York City. And while this sort of thing is common with glaciers, the collapse of a large section of Larsen C could speed the flow of the Larsen Glacier towards the Antarctic Ocean.
As Dr Paul Holland, an ice and ocean modeller at the British Antarctic Survey, said in a recent press release:
“Iceberg calving is a normal part of the glacier life cycle, and there is every chance that Larsen C will remain stable and this ice will regrow. However, it is also possible that this iceberg calving will leave Larsen C in an unstable configuration. If that happens, further iceberg calving could cause a retreat of Larsen C. We won’t be able to tell whether Larsen C is unstable until the iceberg has calved and we are able to understand the behavior of the remaining ice. The stability of ice shelves is important because they resist the flow of the grounded ice inland. After the collapse of Larsen B, its tributary glaciers accelerated, contributing to sea-level rise.”
One of the greatest concerns about climate change is the feedback mechanisms it creates. In addition to increased warming trends caused by rising levels of CO² in the atmosphere, the melting of glaciers and the breakup of ice shelves can have a pronounced effect on sea levels. In the end, the depletion of glaciers in Antarctica could have dramatic consequences for the rest of the planet.
According to data from NASA and the NOAA, 2016 was the hottest year on record yet again. Credit: NASA
The reality of Climate Change has become painfully apparent in recent years, thanks to extended droughts in places like California, diminishing water tables around the world, rising tides, and coastal storms of increasing intensity and frequency. But perhaps the most measurable trend is the way that average global temperatures have kept rising year after year.
And this has certainly been the case for the year of 2016. According to independent analyses provided by NASA’s Goddard Institute for Space Studies (GISS) and the National Oceanic and Atmospheric Agency (NOAA), 2016 was the warmest year since modern record keeping began in 1880. This represents a continuation of a most alarming trend, where 16 of the 17 warmest years on record have occurred since 2001.
Based in New York, GISS conducts space and Earth sciences research, in support of the Goddard Space Flight Center’s (GSFC) Sciences and Exploration Directorate. Since its establishment in 1961, the Institute has conducted valuable research on Earth’s structure and atmosphere, the Earth-Sun relationship, and the structure and atmospheres of other planets in the Solar System.
Monthly temperature anomalies with base 1980-2015, superimposed on a 1980-2015 mean seasonal cycle. Credit: NASA/GISS/Schmidt
Their early studies of Earth and other solar planets using data collected by satellites, space probes, and landers eventually led to GISS becoming a leading authority on atmospheric modeling. Similarly, the NOAA efforts to monitor atmospheric conditions and weather in the US since 1970s has led to them becoming a major scientific authority on Climate Change.
Together, the two organizations looked over global temperature data for the year of 2016 and came to the same conclusion. Based on their assessments, GISS determined that globally-averaged surface temperatures in 2016 were 0.99 °C (1.78 °F) warmer than the mid-20th century mean. As GISS Director Gavin Schmidt put it, these findings should silence any doubts about the ongoing nature of Global Warming:
“2016 is remarkably the third record year in a row in this series. We don’t expect record years every year, but the ongoing long-term warming trend is clear.”
The NOAA’s findings were similar, with an average temperature of 14.83 °C (58.69 °F) being reported for 2016. This surpassed last year’s record by about 0.004 °C (0.07 °F), and represents a change of around 0.94 °C (1.69 F) above the 20th century average. The year began with a boost, thanks to El Nino; and for the eight consecutive months that followed (January to August) the world experienced record temperatures.
This represents a consistent change since 2001, where average global temperatures have increased, leading to of the 16 warmest years on record since 1880 in a row. In addition, on five separate occasions during this period, the annual global temperature was record-breaking – in 2005, 2010, 2014, 2015, and 2016, respectively.
Land and ocean global temperatures in 2013 from both NASA and NOAA. Credit: NASA.
With regards to the long-term trend, average global temperatures have increased by about 1.1° Celsius (2° Fahrenheit) since 1880. This too represents a change, since the rate of increase was placed at 0.8° Celsius (1.4° Fahrenheit) back in 2014. Two-thirds of this warming has occurred since 1975, which coincides with a period of rapid population growth, industrialization, and increased consumption of fossil fuels.
And while there is always a degree of uncertainty when it comes to atmospheric and temperature modelling, owing to the fact that the location of measuring stations and practices change over time, NASA indicated that they were over 95% certain of these results. As such, there is little reason to doubt them, especially since they are consistent with what is at this point a very well-documented trend.
To see an animated graph of average global temperature increases since 1880, click here. To see the full data set and learn about the methods employed by GISS, click here.
And be sure to check out this NASA video that shows these changes on a global map:
Artist's impression of ice age Earth at glacial maximum. Credit: Wikipedia Commons/Ittiz
Scientists have known for some time that the Earth goes through cycles of climatic change. Owing to changes in Earth’s orbit, geological factors, and/or changes in Solar output, Earth occasionally experiences significant reductions in its surface and atmospheric temperatures. This results in long-term periods of glaciation, or what is more colloquially known as an “ice age”.
These periods are characterized by the growth and expansion of ice sheets across the Earth’s surface, which occurs every few million years. By definition we are still in the last great ice age – which began during the late Pliocene epoch (ca. 2.58 million years ago) – and are currently in an interglacial period, characterized by the retreat of glaciers.
Definition:
While the term “ice age” is sometime used liberally to refer to cold periods in Earth’s history, this tends to belie the complexity of glacial periods. The most accurate definition would be that ice ages are periods when ice sheets and glaciers expand across the planet, which correspond to significant drops in global temperatures and can last for millions of years.
The Antarctic ice sheet, which expanded during the last ice age. Credit: Wikipedia Commons/Stephen Hudson
During an ice age, there are significant temperature differences between the equator and the poles, and temperatures at deep-sea levels have also been shown to drop. This allows for large glaciers (comparable to continents) to expand, covering much of the surface area of the planet. Since the Pre-Cambrian Era (ca. 600 million years ago), ice ages have occurred at widely space intervals about about 200 million years.
History of Study:
The first scientist to theorize about past glacial periods was the 18th century Swiss engineer and geographer Pierre Martel. In 1742, while visiting an Alpine valley, he wrote about the dispersal of large rocks in erratic formations, which the locals attributed to the glaciers having once extended much further. Similar explanations began to emerge in the ensuing decades for similar patterns of boulder distribution in other parts of he world.
From the middle of the 18th century onward, European scholars increasingly began to contemplate ice as a means of transporting rocky material. This included the presence of boulders in coastal areas in the Baltic states and the Scandinavian peninsula. However, it was Danish-Norwegian geologist Jens Esmark (1762–1839) who first argued the existence of a sequence of world wide ice ages.
This theory was detailed in a paper he published in 1824, in which he proposed that changes in Earth’s climate (which were due to changes in its orbit) were responsible. This was followed in 1832 by German geologist and forestry professor Albrecht Reinhard Bernhardi speculating about how the polar ice caps may have once reached as far as the temperate zones of the world.
Overlook of the Grinnell Glacier in Glacier National Park, Montana. Credit: USGS
At this same time, German botanist Karl Friedrich Schimper and Swiss-American biologist Louis Agassiz began independently developing their own theory about global glaciation, which led toSchimper coining the term “ice age” in 1837. By the late 19th century, ice age theory gradually began to gain widespread acceptance over the notion that the Earth cooled gradually from its original, molten state.
By the 20th century, Serbian polymath Milutin Milankovic developed his concept of Milankovic cycles, which linked long-term climate changes to periodic changes in the Earth’s orbit around the Sun. This offered a demonstrable explanation for ice ages, and allowed scientists to make predictions about when significant changes in Earth’s climate might occur again.
Evidence for Ice Ages:
There are three forms of evidence for ice age theory, which range from the geological and the chemical to the paleontological (i.e. the fossil record). Each has its particular benefits and drawbacks, and has helped scientists to develop a general understanding of the effect ice ages have had on geological record for the past few billion years.
Geological: Geological evidence includes rock scouring and scratching, carved valleys, the formation of peculiar types of ridges, and the deposition of unconsolidated material (moraines) and large rocks in erratic formations. While this sort of evidence is what led to ice age theory in the first place, it remains temperamental.
For one, successive glaciation periods have different effects on a region, which tends to distort or erase geological evidence over time. In addition, geological evidence is difficult to date exactly, causing problems when it comes to getting an accurate assessment of how long glacial and interglacial periods have lasted.
Horseshoe-shaped lateral moraines at the margin of the Penny Ice Cap on Baffin Island, Nunavut, Canada. Lateral moraines are accumulations of debris along the sides of a glacier formed by material falling from the valley wall. Credit: NASA/Michael Studinger
Chemical: This consists largely of variations in the ratios of isotopes in fossils discovered in sediment and rock samples. For more recent glacial periods, ice cores are used to construct a global temperature record, largely from the presence of heavier isotopes (which lead to higher evaporation temperatures). They often contain bubbles of air as well, which are examined to assess the composition of the atmosphere at the time.
Limitations arise from various factors, however. Foremost among these are isotope ratios, which can have a confounding effect on accurate dating. But as far as the most recent glacial and interglacial periods are concerned (i.e. during the past few million years), ice core and ocean sediment core samples remain the most trusted form of evidence.
Paleontological: This evidence consists of changes in the geographical distribution of fossils. Basically, organisms that thrive in warmer conditions become extinct during glacial periods (or become highly restricted in lower latitudes), while cold-adapted organisms thrive in these same latitudes. Ergo, reduced amounts of fossils in higher latitudes is an indication of the spread of glacial ice sheets.
This evidence can also be difficult to interpret because it requires that the fossils be relevant to the geological period under study. It also requires that sediments over wide ranges of latitudes and long periods of time show a distinct correlation (due to changes in the Earth’s crust over time). In addition, there are many ancient organisms that have shown the ability to survive changes in conditions for millions of years.
As a result, scientists rely on a combined approach and multiple lines of evidence wherever possible.
Ice ages are characterized by a drop in average global temperatures, resulting in the expansion of ice sheets globally. Credit: NASA
Causes of Ice Ages:
The scientific consensus is that several factors contribute to the onset of ice ages. These include changes in Earth’s orbit around the Sun, the motion of tectonic plates, variations in Solar output, changes in atmospheric composition, volcanic activity, and even the impact of large meteorites. Many of these are interrelated, and the exact role that each play is subject to debate.
Earth’s Orbit: Essentially, Earth’s orbit around the Sun is subject to cyclic variations over time, a phenomenon also known as Milankovic (or Milankovitch) cycles. These are characterized by changing distances from the Sun, the precession of the Earth’s axis, and the changing tilt of the Earth’s axis – all of which result in a redistribution of the sunlight received by the Earth.
The most compelling evidence for Milankovic orbital forcing corresponds closely to the most recent (and studied) period in Earth’s history (circa. during the last 400,000 years). During this period, the timing of glacial and interglacial periods are so close to changes in Milankovic orbital forcing periods that it is the most widely accepted explanation for the last ice age.
Tectonic Plates: The geological record shows an apparent correlation between the onset of ice ages and the positions of the Earth’s continents. During these periods, they were in positions which disrupted or blocked the flow of warm water to the poles, thus allowing ice sheets to form.
The Earth’s Tectonic Plates. Credit: msnucleus.org
This in turn increased the Earth’s albedo, which reduces the amount of solar energy absorbed by the Earth’s atmosphere and crust. This resulted in a positive feedback loop, where the advance of ice sheets further increased the Earth’s albedo and allowed for more cooling and more glaciation. This would continue until the onset of a greenhouse effect ended the period of glaciation.
Based on past ice-ages, three configurations have been identified that could lead to an ice age – a continent sitting atop the Earth’s pole (as Antarctica does today); a polar sea being land-locked (as the Arctic Ocean is today); and a super continent covering most of the equator (as Rodinia did during the Cryogenian period).
In addition, some scientists believe that the Himalayan mountain chain – which formed 70 million years ago – has played a major role in the most recent ice age. By increasing the Earth’s total rainfall, it has also increased the rate at which CO² has been removed from the atmosphere (thereby decreasing the greenhouse effect). Its existence has also paralleled the long-term decrease in Earth’s average temperature over the past 40 million years.
Atmospheric Composition: There is evidence that levels of greenhouse gases fall with the advance of ice sheets and rise with their retreat. According to the “Snowball Earth” hypothesis – in which ice completely or very nearly covered the planet at least once in the past – the ice age of the late Proterozoic was ended by an increase in CO² levels in the atmosphere, which was attributed to volcanic eruptions.
Image of the Harding Ice Field on Alaska’s Kenai Peninsula. Credit: US Fish and Wildlife Service
However, there are those who suggest that increased levels of carbon dioxide may have served as a feedback mechanism, rather than the cause. For example, in 2009, an international team of scientists produced a study – titled “The Last Glacial Maximum” – that indicated that an increase in solar irradiance (i.e. energy absorbed from the Sun) provided the initial change, whereas greenhouse gases accounted for the magnitude of change.
Major Ice Ages:
Scientists have determined that at least five major ice ages took place in Earth’s history. These include the Huronian, Cryogenian, Andean-Saharan, Karoo, and the Qauternary ice ages. The Huronian Ice Age is dated to the early Protzerozoic Eon, roughly 2.4 to 2.1 billion years ago, based on geological evidence observed to the north and north-east of Lake Huron (and correlated to deposits found in Michigan and Western Australia).
The Cryogenian Ice Age lasted from roughly 850 to 630 million years ago, and was perhaps the most severe in Earth’s history. It is believed that during this period, the glacial ice sheets reached the equator, thus leading to a “Snowball Earth” scenario. It is also believed that ended due to a sudden increase in volcanic activity that triggered a greenhouse effect, though (as noted) this is subject to debate.
The Andean-Saharan Ice Age occurred during the Late Ordovician and the Silurian period (roughly 460 to 420 million years ago). As the name suggests, the evidence here is based on geological samples take from the Tassili n’Ajjer mountain range in the western Sahara, and correlated by evidence obtained from the Andean mountain chain in South America (as well as the Arabian peninsula and the south Amazon basin).
Floating ice at the calving front of Greenland’s Kangerdlugssuaq glacier, photographed in 2011 during Operation IceBridge. Credit: NASA/Michael Studinger
The Karoo Ice Age is attributed to the evolution of land plants during the onset of the Devonian period (ca. 360 to 260 million years ago) which caused a long-term increase in planetary oxygen levels and a reduction in CO² levels – leading to global cooling. It is named after sedimentary deposits that were discovered in the Karoo region of South Africa, with correlating evidence found in Argentina.
The current ice age, known as the Pliocene-Quaternary glaciation, started about 2.58 million years ago during the late Pliocene, when the spread of ice sheets in the Northern Hemisphere began. Since then, the world has experienced several glacial and interglacial periods, where ice sheets advance and retreat on time scales of 40,000 to 100,000 years.
The Earth is currently in an interglacial period, and the last glacial period ended about 10,000 years ago. What remains of the continental ice sheets that once stretched across the globe are now restricted to Greenland and Antarctic, as well as smaller glaciers – like the one that covers Baffin Island.
Anthropogenic Climate Change:
The exact role played by all the mechanisms that ice ages are attributed to – i.e. orbital forcing, solar forcing, geological and volcanic activity – are not yet entirely understood. However, given the role of carbon dioxide and other greenhouse gas emissions, there has been a great deal of concern in recent decades what long-term effects human activity will have on the planet.
For instance, in at least two major ice ages, the Cryogenian and Karoo Ice Ages, increases and decreases in atmospheric greenhouse gases are believed to have played a major role. In all other cases, where orbital forcing is believed to be the primary cause of an ice age ending, increased greenhouse gas emissions were still responsible for the negative feedback that led to even greater increases in temperature.
The addition of CO2 by human activity has also played a direct role in climatic changes taking place around the world. Currently, the burning of fossil fuels by humans constitutes the largest source of emissions of carbon dioxide (about 90%) worldwide, which is one of the main greenhouse gases that allows radiative forcing (aka. the Greenhouse Effect) to take place.
In 2013, the National Oceanic and Atmospheric Administration announced that CO² levels in the upper atmosphere reached 400 parts per million (ppm) for the first time since measurements began in the 19th century. Based on the current rate at which emissions are growing, NASA estimates that carbon levels could reach between 550 to 800 ppm in the coming century.
If the former scenario is the case, NASA anticipates a rise of 2.5 °C (4.5 °F) in average global temperatures, which would be sustainable. However, should the latter scenario prove to be the case, global temperatures will rise by an average of 4.5 °C (8 °F), which would make life untenable for many parts of the planet. For this reason, alternatives are being sought out for development and widespread commercial adoption.
What’s more, according to a 2012 research study published in Nature Geoscience – titled “Determining the natural length of the current interglacial” – human emissions of CO² are also expected to defer the next ice age. Using data on Earth’s orbit to calculate the length of interglacial periods, the research team concluded that the next ice (expected in 1500 years) would require atmospheric CO² levels to remain beneath around 240?ppm.
Learning more about the longer ice ages as well the shorter glacial periods that have taken place in Earth’s past is important step towards understanding how Earth’s climate changes over time. This is especially important as scientists seek to determine how much of modern climate change is man-made, and what possible counter-measures can be developed.
Artist's concept of a space-based solar array. Credit NASA/SAIC
In recent years, alternative energy has been the subject of intense interest and debate. Thanks to the threat of Climate Change, and the fact that average global temperatures continue to rise year after year, the drive to find forms of energy that will reduce humanity’s reliance on fossil fuels, coal, and other polluting methods has naturally intensified.
While most concepts for alternative energy are not new, it has only been in the past few decades that the issue has become pressing. And thanks to improvements in technology and production, the costs of most forms of alternative energy has been dropping while efficiency has been increasing. But just what is alternative energy, and what is the likelihood of it becoming mainstream?
Definition:
Naturally, there is some debate as to what “alternative energy” means and what it can be applied to. On the one hand, the term can refer to forms of energy that do not increase humanity’s carbon footprint. In this respect, it can include things as nuclear facilities, hydroelectric power, and even things like natural gas and “clean coal”.
Residential solar panels in Germany. Credit: Wikimedia Commons/ Sideka Solartechnik
On the other hand, the term is also used to refer to what are currently considered to be non-traditional methods of energy – such as solar, wind, geothermal, biomass, and other recent additions. This sort of classification rules out methods like hydroelectric, which have been around for over a century and are therefore quite common to certain regions of the world.
Another factor is that alternative energy sources are considered to be “clean”, meaning that they don’t produce harmful pollutants. As already noted, this can refer to carbon dioxide but also other emissions like carbon monoxide, sulfur dioxide, nitrogen oxide, and others. Within these parameters, nuclear energy is not considered an alternative energy source because it produces radioactive waste that is highly toxic and must be stored.
In all cases, however, the term is used to refer to forms of energy that will come to replace fossil fuels and coal as the predominant form of energy production in the coming decades.
Types of Alternative Energy:
Strictly speaking, there are many types of alternative energy. Once again, definitions become a bit of a sticking point, and the term has been used in the past to refer to any method that was considered non-mainstream at the time. But applying the term broadly to mean alternatives to coal and fossil fuels, it can include any or all of the following:
Hydroelectricity: This refers to energy generated by hydroelectric dams, where falling water (i.e. rivers or canals) are channeled through an apparatus to spin turbines and generate electricity.
A nuclear power plant, releasing hot steam as a byproduct of its slow fission process. Credit: Wikipedia Commons/Emmelie Callewaert
Nuclear Power: Energy that is produced through slow-fission reactions. Rods of uranium or other radioactive elements heat water to generate steam, which in turn spins turbines to generate electricity.
Solar Power: Energy harnessed directly from the Sun, where photovoltaic cells (usually composed of silicon substrate, and arranged in large arrays) convert the Sun’s rays directly into electrical energy. In some cases, the heat produced by sunshine is harnessed to produce electricity as well, which is known as solar-thermal power.
Wind Power: Energy generated by air flow, where large wind-turbines are spun by wind to generate electricity.
Geothermal Power: Energy generated by heat and steam produced by geological activity in the Earth’s crust. In most cases, this consists of pipes being placed in the ground above geologically active zones to channel steam through turbines, thus generating electricity.
Tidal Power: Energy generated by tidal harnesses located around shorelines. Here, the daily changes in tides causes water to flow back and forth through turbines, generating electricity that is then transferred to power stations along the shore.
Biomass: This refers to fuels that are derived from plants and biological sources – i.e. ethanol, glucose, algae, fungi, bacteria – that could replace gasoline as a fuel source.
Hydrogen: Energy derived from processes involving hydrogen gas. This can include catalytic converters, where water molecules are broken apart and reunited by electrolysis; hydrogen fuel cells, where the gas is used to power internal combustion engines or heated and used to spin turbines; or nuclear fusion, where atoms of hydrogen fuse under controlled conditions to release incredible amounts of energy.
The Mega Ampere Spherical Tokamak (MAST) reactor at the Culham Centre for Fusion Energy (UK). Credit: CCFE
Alternative and Renewable Energy:
In many cases, alternative sources of energy are also renewable. However, the terms are not entirely interchangeable, owing to the fact that many forms of alternative energy rely on a finite resource. For instance, nuclear power relies on uranium or other heavy elements that must be mined.
Meanwhile, wind, solar, tidal, geothermal and hydroelectric power all rely on sources that are entirely renewable. The Sun’s rays are the most abundant energy source of all and, while limited by weather and diurnal patters, are perennial – and therefore inexhaustible from an industry standpoint. Wind is also a constant, thanks to the Earth’s rotation and pressure changes in our atmosphere.
Development:
Currently, alternative energy is still very much in its infancy. However, this picture is rapidly changing, owing to a combination of political pressure, worldwide ecological disasters (drought, famine, flooding, storm activity), and improvements in renewable energy technology.
For instance, as of 2015, the world’s energy needs were still predominantly provided for by sources like coal (41.3%) and natural gas (21.7%). Hydroelectric and nuclear power constituted 16.3% and 10.6%, respectively, while “renewables” (i.e. solar, wind, biomass etc.) made up just 5.7%.
In Denmark, wind power accounts for 28% of electrical production and is cheaper than coal power. Credit: denmark.dk
This represented a significant change from 2013, when the global consumption of oil, coal and natural gas was 31.1%, 28.9%, and 21.4%, respectively. Nuclear and hydroelectric power made up 4.8% and 2.45, while renewable sources made up just 1.2%.
In addition, there has been an increase in the number of international agreements regarding the curbing of fossil fuel use and the development of alternative energy sources. These include the Renewable Energy Directive signed by the European Union in 2009, which established goals for renewable energy usage for all member states for the year of 2020.
Basically, the agreement stated that the EU fulfill at least 20% of its total energy needs with renewables by 2020, and that at least 10% of their transport fuels come from renewable sources by 2020. In November of 2016, the European Commission revised these targets, establishing that a minimum of 27% of the EUs energy needs come from renewables by 2030.
In 2015, the United Nations Framework Convention on Climate Change (UNFCCC) met in Paris to come up with a framework for greenhouse gas mitigation and the financing of alternative energy that would go into effect by 2020. This led to The Paris Agreement, which was adopted on December 12th, 2015 and opened for signatures on April 22nd (Earth Day), 2016, at the UN Headquarters in New York.
The Krafla a geothermal power station located i0n Iceland. Credit: Wikipedia Commons/Ásgeir Eggertsson
Several countries and states have also been noted fore their leadership in the field of alternative energy development. For instance, in Denmark, wind power provides up to 140% of the country’s demand for electricity, with the surplus being provided to neighboring countries like Germany and Sweden.
Iceland, thanks to its location in the North Atlantic and its active volcanoes, achieved 100% reliance on renewable energy by 2012 through a combination of hydroelectricity and geothermal power. In 2016, Germany’s policy of phasing out reliance on oil and nuclear power resulted in the country reaching a milestone on May 15th, 2016 – where nearly 100% of its demand for electricity came from renewable sources.
The state of California has also made impressive strides in terms of its reliance on renewable energy in recent years. In 2009, 11.6 percent of all electricity in the state came from renewable resources such as wind, solar, geothermal, biomass and small hydroelectric facilities. Thanks to multiple programs that encourage switching to renewable energy sources, this reliance increased to 25% by 2015.
Based on the current rates of adoption, the long-term prospects for alternative energy are extremely positive. According to a 2014 report by the International Energy Agency (IEA), photovoltaic solar power and solar thermal power will account for 27% of global demand by 2050 – making it the single largest source of energy. Similarly, a 2013 report on wind power indicated that by 2050, wind could account for up to 18% of global demand.
The IEA’s World Energy Outlook 2016 also claims that by 2040, natural gas, wind and solar will eclipse coal and oil as the predominant sources of energy. And some even go as far to say that – thanks to developments in solar, wind, and fusion power technology – fossil fuels will become obsolete by 2050.
As with all things, the adoption of alternative energy has been gradual. But thank to the growing problem of Climate Change and rising demand for electricity worldwide, the rate at which clean and alternative methods are being adopted has become exponential in recent years. Sometime during this century, humanity may reach the point of becoming carbon neutral, and not a moment too soon!
Earth, seen from space, above the Pacific Ocean. Credit: NASA
Since the election of Donald Trump, NASA has had its share of concerns about the future. Given the President-elect’s position and past statements on climate science, there has been speculation that his presidency will curtail funding to some of their research efforts, particularly those that are maintained by the Earth Science Directorate.
Things took another turn on Monday (Dec. 5th) as Trump met with former Vice President and environmental activist Al Gore to discuss his administration’s policy. This meeting was the latest in a series of gestures that suggest that the President-elect might be softening his stances on the environment. However, there is little reason to suspect that this meeting could mean any changes in policy.
The meeting was apparently arranged by the President-elect’s daughter, Ivanka Trump, to coincide with the former VP’s attendance of a conference in New York on Monday. Said conference was the 24 hour live broadcast titled “24 Hours of Reality”, an event being put on by the Climate Reality Project – a non-profit organization founded by Gore to educate the public on climate change and policy.
Much of NASA’s research into Climate Change takes place through the Earth Sciences Directorate. Credit: NASA
The meeting lasted 90 minutes, after which Gore spoke to reporters about the discussion he and the President-elect had. As he was quoted as saying by The Washington Post:
“I had a lengthy and very productive session with the president-elect. It was a sincere search for areas of common ground. I had a meeting beforehand with Ivanka Trump. The bulk of the time was with the president-elect, Donald Trump. I found it an extremely interesting conversation, and to be continued, and I’m just going to leave it at that.”
While this meeting has led to speculation that Trump’s administration might be softening its stance on environmental issues, many are unconvinced. Based on past statements – which include how Climate Change is a “hoax invented by the Chinese” – to his more recent picks for his cabinet, there are those who continue to express concern for the future of NASA programs that are centered on Earth sciences and the environment.
For instance, after weeks of remaining mute on the subject of NASA’s future, the Trump campaign announced that it had appointed Bob Walker – a former Pennsylvania Congressman and the chair of the House Science Committee from 1995 to 1997. A fierce conservative, Walker was recently quoted as saying that NASA should cease its climate research and focus solely on space exploration.
Artist’s impression of the carbon dioxide that will be present in Earth’s atmosphere if half of global-warming emissions are not absorbed. Credit: NASA/JPL/GSFC
“My guess is that it would be difficult to stop all ongoing Nasa programs but future programs should definitely be placed with other agencies,” he said in an interview with the Guardian in late November. “I believe that climate research is necessary but it has been heavily politicized, which has undermined a lot of the work that researchers have been doing. Mr Trump’s decisions will be based upon solid science, not politicized science.”
From statements such as these, plus things said during the campaign that emphasized NASA’s important role in space exploration, the general consensus has been that a Trump administration will likely slash funding to NASA’s Earth Science Directorate while leaving long-term exploration programs unaffected. According to David Titley, who recently wrote an op-ed piece for The Conversation, this would be a terrible mistake.
As he noted in his piece, NASA’s Earth science and Earth observation efforts are vital, and the shared missions they have with organizations like the NOAA have numerous benefits. As he explained:
“There’s a reason why space is called ‘the ultimate high ground’ and our country spends billions of dollars each year on space-based assets to support our national intelligence community. In addition to national security, NASA missions contribute vital information to many other users, including emergency managers and the Federal Emergency Management Agency (FEMA), farmers, fishermen and the aviation industry.”
An artist’s conception of an asteroid passing near the Earth. NASA is getting better at spotting them and giving us advance warning of their approach. Image credit: ESA.
In the past, NASA’s Earth Science Directorate has contributed vital information on how rising temperatures could affect water tables and farmlands (such as the ongoing drought in California), and how changes in oceanic systems would affect fisheries. On top of that, FEMA has been working with NASA in recent years in order to develop a disaster-readiness program to address the fallout from a possible asteroid impact.
This has included three tabletop exercises where the two agencies worked through asteroid impact scenarios and simulated how information would be exchanged between NASA scientists an FEMA emergency managers. As Melissa Weihenstroer – a Presidential Management Fellow in FEMA’s Office of External Affairs and who works with NASA’s Planetary Defense Coordination Office – recently wrote about this inter-agency cooperation:
“Since FEMA doesn’t have direct experience with asteroids or their impacts, we’ve turned to some people who do: our partners at the National Aeronautics and Space Administration (NASA). While FEMA will be the agency in charge of the U.S. government efforts in preparing for and responding to any anticipated asteroid-related event here on Earth, NASA is responsible for finding, tracking, and characterizing potentially hazardous asteroids and comets while they are still in space.
Whenever a transition occurs between one presidential administration and the next, there is always some level of concern about the impact it will have on federal organization. However, when an administration is unclear about its policies, and has made statements to the effect that federal agencies should cease conducting certain types of research, NASA can be forgiven for getting a little nervous.
In the coming years, it will be interesting to see how the budget environment changes for Earth science research. One can only hope that a Trump administration will not see fit to make sweeping cuts without first considering the potential consequences.
Given the fiscal policies of his party, and his own stances on Climate Change, there is concern about how a Trump administration will affect NASA. Credit: Wikipedia Commons/Gage Skidmore
With the 2016 election now finished and Donald Trump confirmed as the president-elect of the United States, there are naturally some concerns about what this could means for the future of NASA. Given the administration’s commitment to Earth science, and its plans for crewed missions to near-Earth Orbit and Mars, there is understandably some worry that the budget environment might be changing soon.
At this juncture, it is not quite clear how a Trump presidency will affect NASA’s mandate for space exploration and scientific research. But between statements made by the president-elect in the past, and his stances on issues like climate change, it seems clear that funding for certain types of research could be threatened. But there is also reason to believe that larger exploration programs might be unaffected.
Back in September, the Senate Committee on Commerce, Science, and Transportation passed the NASA Transition Authorization Act of 2016. This bill granted $19.5 billion in funding for NASA for fiscal year 2017, thus ensuring that NASA’s proposed activities would not be affected by the transition in power. Central to this bill was the continued funding of operations that NASA considered to be central to its “Journey to Mars“.
Looking forward, it is unclear how the new administration will affect NASA’s plans for space exploration. Credit: NASA/AESP
Beyond FY 2017, though, the picture is unclear. When it comes to things like NASA’s Earth Science program, the administration of a president that denies the existence of Climate Change is expected to mean budget cuts. For instance, back in May, Trump laid out his vision for an energy policy. Central to this was a focus on oil, natural gas and coal, the cancellation of the Paris Agreement, and the cessations of all payments to the UN Green Climate Fund.
This could signal a possible reverse of policies initiated by the Obama administration, which increased funding for Earth science research by about 50 percent. And as NASA indicated in a report issued on Nov. 2nd by the Office of the Inspect General – titled “NASA’s Earth Science Mission Portfolio” – this has resulted in some very favorable developments.
Foremost among these has been the increased in the number of products delivered to users by NASA, going from 8.14 million in 2000 to 1.42 billion in 2015. In other words, usage of NASA resources has increased by a factor of 175, and in the space of just 15 years (much of that in the last 8). Another major benefit has been the chance for collaboration and lucrative partnerships. From the report:
“Government agencies, scientists, private entities, and other stakeholders rely on NASA to process raw information received from Earth observation systems into useable data. Moreover, NASA’s Earth observation data is routinely used by government agencies, policy makers, and researchers to expand understanding of the Earth system and to enhance economic competitiveness, protect life and property, and develop policies to help protect the planet. Finally, NASA is working to address suggestions that it use commercially provided data to augment its Earth observation data. However, NASA must reconcile its policy that promotes open sharing of data at minimal cost to users with a commercial business model under which fees may create a barrier to use.”
Much of NASA’s research into Climate Change takes place through the Earth Science division of the Mission Directorate. Credit: NASA
Unfortunately, it has been this same increase in funding that prompted Congressional Republicans, in the name of fiscal responsibility, to demand changes and new standards. These sentiments were voiced back in March of 2015 during NASA’s budget request for 2016. As Senator Ted Cruz – currently one of the Trump campaign’s backers – said at the time:
“We’ve seen a disproportionate increase in the amount of federal funds going to the earth sciences program at the expense of funding for exploration and space operations, planetary sciences, heliophysics, and astrophysics, which I believe are all rooted in exploration and should be central to NASA’s core mission. We need to get back to the hard sciences, to manned space exploration, and to the innovation that has been integral to NASA.
While Trump himself has little to say about space during his long campaign, his team did manage to recruit Robert Walker – a former Republican congressman from Pennsylvania – this past October to draft a policy for them. In an op-ed to SpaceNews in late October, he echoed Cruz’s sentiments about cutting back on Earth sciences to focus on space exploration:
“NASA should be focused primarily on deep space activities rather than Earth-centric work that is better handled by other agencies. Human exploration of our entire solar system by the end of this century should be NASA’s focus and goal. Developing the technologies to meet that goal would severely challenge our present knowledge base, but that should be a reason for exploration and science.”
“It makes little sense for numerous launch vehicles to be developed at taxpayer cost, all with essentially the same technology and payload capacity. Coordinated policy would end such duplication of effort and quickly determine where there are private sector solutions that do not necessarily require government investment.“
NASA is developing the capabilities needed to send humans to an asteroid by 2025 and Mars in the 2030s. Credit: NASA/JPL
Next, there is the issue of NASA’s long-term goals, which (as noted) seem more secure for the time being. In May of 2016, Trump was issued the Aerospace America Questionnaire – a series of ten questions issued by NASA to determine the stances of the candidates on space exploration. On the subject of a crewed mission to Mars in the future, Trump’s campaign indicated that things would depend upon the state of the country’s economy:
“A lot of what my administration would recommend depends on our economic state. If we are growing with all of our people employed and our military readiness back to acceptable levels, then we can take a look at the timeline for sending more people into space.“
However, they also professed an admiration for NASA and a commitment to its overall goal:
“NASA has been one of the most important agencies in the United States government for most of my lifetime. It should remain so. NASA should focus on stretching the envelope of space exploration for we have so much to discover and to date we have only scratched the surface.”
From all of this, a general picture of what NASA’s budget environment will look like in the near future begins to emerge. In all likelihood, the Earth Science division (and other parts of NASA) are likely to find their budgets being scrutinized based on newly-developed criteria. Essentially, unless it benefits space exploration and research beyond Earth, it’s not likely to see continued funding.
NASA Administrator Charles Bolden. Credit: NASA
But regardless of the results of the election, it appears at this juncture that NASA is looking forward with cautious optimism. Addressing the future, NASA Administrator Charles Bolden issued an internal memo on Wednesday, Nov. 9th. Titled “Reaching for New Heights in 2017 and Beyond“, Bolden expressed positive thoughts about the transition of power and what it would mean:
“In times when there has been much news about all the things that divide our nation, there has been noticeable bipartisan support for this work, our work – support that not only reaches across the aisle, but across the public, private, academic and non-profit sectors.
“For this reason, I think we can all be confident that the new Trump Administration and future administrations after that will continue the visionary course on which President Barack Obama has set us, a course that all of you have made possible.”
For NASA’s sake, I hope Bolden’s words prove to be prophetic. For no matter who holds of the office of the President of the United States, the American people – and indeed, all the world’s people – depend upon the continued efforts of NASA. As the leader in space exploration, their presence is essential to humanity’s return to space!
Artist's impression of the surface of Venus. Credit: ESA/AOES
Continuing with our “Definitive Guide to Terraforming“, Universe Today is happy to present to our guide to terraforming Venus. It might be possible to do this someday, when our technology advances far enough. But the challenges are numerous and quite specific.
The planet Venus is often referred to as Earth’s “Sister Planet”, and rightly so. In addition to being almost the same size, Venus and Earth are similar in mass and have very similar compositions (both being terrestrial planets). As a neighboring planet to Earth, Venus also orbits the Sun within its “Goldilocks Zone” (aka. habitable zone). But of course, there are many key difference between the planets that make Venus uninhabitable.
For starters, it’s atmosphere over 90 times thicker than Earth’s, its average surface temperature is hot enough to melt lead, and the air is a toxic fume consisting of carbon dioxide and sulfuric acid. As such, if humans want to live there, some serious ecological engineering – aka. terraforming – is needed first. And given its similarities to Earth, many scientists think Venus would be a prime candidate for terraforming, even more so than Mars!
Over the past century, the concept of terraforming Venus has appeared multiple times, both in terms of science fiction and as the subject of scholarly study. Whereas treatments of the subject were largely fantastical in the early 20th century, a transition occurred with the beginning of the Space Age. As our knowledge of Venus improved, so too did the proposals for altering the landscape to be more suitable for human habitation.
Venus is also considered a prime candidate for terraforming. Credit: NASA/JPL/io9.com
Examples in Fiction:
Since the early 20th century, the idea of ecologically transforming Venus has been explored in fiction. The earliest known example is Olaf Stapleton’sLast And First Men(1930), two chapters of which are dedicated to describing how humanity’s descendants terraform Venus after Earth becomes uninhabitable; and in the process, commit genocide against the native aquatic life.
By the 1950s and 60s, owing to the beginning of the Space Age, terraforming began to appear in many works of science fiction. Poul Anderson also wrote extensively about terraforming in the 1950s. In his 1954 novel, The Big Rain, Venus is altered through planetary engineering techniques over a very long period of time. The book was so influential that the term term “Big Rain” has since come to be synonymous with the terraforming of Venus.
In 1991, author G. David Nordley suggested in his short story (“The Snows of Venus”) that Venus might be spun-up to a day-length of 30 Earth days by exporting its atmosphere of Venus via mass drivers. Author Kim Stanley Robinson became famous for his realistic depiction of terraforming in the Mars Trilogy – which included Red Mars, Green Mars and Blue Mars.
In 2012, he followed this series up with the release of 2312, a science fiction novel that dealt with the colonization of the entire Solar System – which includes Venus. The novel also explored the many ways in which Venus could be terraformed, ranging from global cooling to carbon sequestration, all of which were based on scholarly studies and proposals.
Artist’s conception of a terraformed Venus, showing a surface largely covered in oceans. Credit: Wikipedia Commons/Ittiz
Proposed Methods:
The first proposed method of terraforming Venus was made in 1961 by Carl Sagan. In a paper titled “The Planet Venus“, he argued for the use of genetically engineered bacteria to transform the carbon in the atmosphere into organic molecules. However, this was rendered impractical due to the subsequent discovery of sulfuric acid in Venus’ clouds and the effects of solar wind.
In his 1991 study “Terraforming Venus Quickly“, British scientist Paul Birch proposed bombarding Venus’ atmosphere with hydrogen. The resulting reaction would produce graphite and water, the latter of which would fall to the surface and cover roughly 80% of the surface in oceans. Given the amount of hydrogen needed, it would have to harvested directly from one of the gas giant’s or their moon’s ice.
The proposal would also require iron aerosol to be added to the atmosphere, which could be derived from a number of sources (i.e. the Moon, asteroids, Mercury). The remaining atmosphere, estimated to be around 3 bars (three times that of Earth), would mainly be composed of nitrogen, some of which will dissolve into the new oceans, reducing atmospheric pressure further.
Another idea is to bombard Venus with refined magnesium and calcium, which would sequester carbon in the form of calcium and magnesium carbonates. In their 1996 paper, “The stability of climate on Venus“, Mark Bullock and David H. Grinspoon of the University of Colorado at Boulder indicated that Venus’ own deposits of calcium and magnesium oxides could be used for this process. Through mining, these minerals could be exposed to the surface, thus acting as carbon sinks.
A mass of swirling gas and cloud at Venus’ south pole. Credit: ESA/VIRTIS/INAF-IASF/Obs. de Paris-LESIA/Univ. Oxford.
However, Bullock and Grinspoon also claim this would have a limited cooling effect – to about 400 K (126.85 °C; 260.33 °F) and would only reduce the atmospheric pressure to an estimated 43 bars. Hence, additional supplies of calcium and magnesium would be needed to achieve the 8×10²⁰ kg of calcium or 5×10²⁰ kg of magnesium required, which would most likely have to be mined from asteroids.
The concept of solar shades has also been explored, which would involve using either a series of small spacecraft or a single large lens to divert sunlight from a planet’s surface, thus reducing global temperatures. For Venus, which absorbs twice as much sunlight as Earth, solar radiation is believed to have played a major role in the runaway greenhouse effect that has made it what it is today.
Such a shade could be space-based, located in the Sun–Venus L1 Lagrangian point, where it would prevent some sunlight from reaching Venus. In addition, this shade would also serve to block the solar wind, thus reducing the amount of radiation Venus’ surface is exposed to (another key issue when it comes to habitability). This cooling would result in the liquefaction or freezing of atmospheric CO², which would then be depsotied on the surface as dry ice (which could be shipped off-world or sequestered underground).
Alternately, solar reflectors could be placed in the atmosphere or on the surface. This could consist of large reflective balloons, sheets of carbon nanotubes or graphene, or low-albedo material. The former possibility offers two advantages: for one, atmospheric reflectors could be built in-situ, using locally-sourced carbon. Second, Venus’ atmosphere is dense enough that such structures could easily float atop the clouds.
Artist’s concept of a Venus cloud city – part of NASA’s High Altitude Venus Operational Concept (HAVOC) plan. Credit: Advanced Concepts Lab/NASA Langley Research Center
NASA scientist Geoffrey A. Landis has also proposed that cities could be built above Venus’ clouds, which in turn could act as both a solar shield and as processing stations. These would provide initial living spaces for colonists, and would act as terraformers, gradually converting Venus’ atmosphere into something livable so the colonists could migrate to the surface.
Another suggestion has to do with Venus’ rotational speed. Venus rotates once every 243 days, which is by far the slowest rotation period of any of the major planets. As such, Venus’s experiences extremely long days and nights, which could prove difficult for most known Earth species of plants and animals to adapt to. The slow rotation also probably accounts for the lack of a significant magnetic field.
To address this, British Interplanetary Society member Paul Birch suggested creating a system of orbital solar mirrors near the L1 Lagrange point between Venus and the Sun. Combined with a soletta mirror in polar orbit, these would provide a 24-hour light cycle.
It has also been suggested that Venus’ rotational velocity could be spun-up by either striking the surface with impactors or conducting close fly-bys using bodies larger than 96.5 km (60 miles) in diameter. There is also the suggestion of using using mass drivers and dynamic compression members to generate the rotational force needed to speed Venus up to the point where it experienced a day-night cycle identical to Earth’s (see above).
Artist’s impression of Venus’ thick atmosphere, complete with lighting strikes and sulfuric acid rains. Credit: ESA
Then there’s the possibility of removing some of Venus’ atmosphere, which could accomplished in a number of ways. For starters, impactors directed at the surface would blow some of the atmosphere off into space. Other methods include space elevators and mass accelerators (ideally placed on balloons or platforms above the clouds), which could gradually scoop gas from the atmosphere and eject it into space.
Potential Benefits:
One of the main reasons for colonizing Venus, and altering its climate for human settlement, is the prospect of creating a “backup location” for humanity. And given the range of choices – Mars, the Moon, and the Outer Solar System – Venus has several things going for it the others do not. All of these highlight why Venus is known as Earth’s “Sister Planet”.
For starters, Venus is a terrestrial planet that is similar in size, mass and composition to Earth. This is why Venus has similar gravity to Earth, which is about of what we experience 90% (or 0.904 g, to be exact. As a result, humans living on Venus would be at a far lower risk of developing health problems associated with time spent in weightlessness and microgravity environments – such as osteoporosis and muscle degeneration.
Venus’s relative proximity to Earth would also make transportation and communications easier than with most other locations in the solar system. With current propulsion systems, launch windows to Venus occur every 584 days, compared to the 780 days for Mars. Flight time is also somewhat shorter since Venus is the closest planet to Earth. At it’s closest approach, it is 40 million km distant, compared to 55 million km for Mars.
On Feb. 5, 1974, NASA’s Mariner 10 mission took this first close-up photo of Venus during 1st gravity assist flyby. Credit: NASA
Another reason has to do with Venus’ runaway greenhouse effect, which is the reason for the planet’s extreme heat and atmospheric density. In testing out various ecological engineering techniques, our scientists would learn a great deal about their effectiveness. This information, in turn, will come in mighty handy in the ongoing fight against Climate Change here on Earth.
And in the coming decades, this fight is likely to become rather intense. As the NOAA reported in March of 2015, carbon dioxide levels in the atmosphere have now surpassed 400 ppm, a level not seen since the the Pliocene Era – when global temperatures and sea level were significantly higher. And as a series of scenarios computed by NASA show, this trend is likely to continue until 2100, with severe consequences.
In one scenario, carbon dioxide emissions will level off at about 550 ppm toward the end of the century, resulting in an average temperature increase of 2.5 °C (4.5 °F). In the second scenario, carbon dioxide emissions rise to about 800 ppm, resulting in an average increase of about 4.5 °C (8 °F). Whereas the increases predicted in the first scenario are sustainable, in the latter scenario, life will become untenable on many parts of the planet.
So in addition to creating a second home for humanity, terraforming Venus could also help to ensure that Earth remains a viable home for our species. And of course, the fact that Venus is a terrestrial planet means that it has abundant natural resources that could be harvested, helping humanity to achieve a “post-scarcity” economy.
Artist’s concept of the High Altitude Venus Operational Concept (HAVOC) mission approaching the planet. Credit: NASA Langley Research Center/YouTube.
Challenges:
Beyond the similarities Venus’ has with Earth (i.e. size, mass and composition), there are numerous differences that would make terraforming and colonizing it a major challenge. For one, reducing the heat and pressure of Venus’ atmosphere would require a tremendous amount of energy and resources. It would also require infrastructure that does not yet exist and would be very expensive to build.
For instance, it would require immense amounts of metal and advanced materials to build an orbital shade large enough to cool Venus’ atmosphere to the point that its greenhouse effect would be arrested. Such a structure, if positioned at L1, would also need to be four times the diameter of Venus itself. It would have to be assembled in space, which would require a massive fleet of robot assemblers.
In contrast, increasing the speed of Venus’s rotation would require tremendous energy, not to mention a significant number of impactors that would have to cone from the outer solar System – mainly from the Kuiper Belt. In all of these cases, a large fleet of spaceships would be needed to haul the necessary material, and they would need to be equipped with advanced drive systems that could make the trip in a reasonable amount of time.
Currently, no such drive systems exist, and conventional methods – ranging from ion engines to chemical propellants – are neither fast or economical enough. To illustrate, NASA’s New Horizons mission took more than 11 years to get make its historic rendezvous with Pluto in the Kuiper Belt, using conventional rockets and the gravity-assist method.
Artist’s impression of the surface of Venus. Credit: ESA/AOES
Meanwhile, the Dawn mission, which relied relied on ionic propulsion, took almost four years to reach Vesta in the Asteroid Belt. Neither method is practical for making repeated trips to the Kuiper Belt and hauling back icy comets and asteroids, and humanity has nowhere near the number of ships we would need to do this.
The same problem of resources holds true for the concept of placing solar reflectors above the clouds. The amount of material would have to be large and would have to remain in place long after the atmosphere had been modified, since Venus’s surface is currently completely enshrouded by clouds. Also, Venus already has highly reflective clouds, so any approach would have to significantly surpass its current albedo (0.65) to make a difference.
And when it comes to removing Venus’ atmosphere, things are equally challenging. In 1994, James B. Pollack and Carl Sagan conducted calculations that indicated that an impactor measuring 700 km in diameter striking Venus at high velocity would less than a thousandth of the total atmosphere. What’s more, there would be diminishing returns as the atmosphere’s density decreases, which means thousands of giant impactors would be needed.
In addition, most of the ejected atmosphere would go into solar orbit near Venus, and – without further intervention – could be captured by Venus’s gravitational field and become part of the atmosphere once again. Removing atmospheric gas using space elevators would be difficult because the planet’s geostationary orbit lies an impractical distance above the surface, where removing using mass accelerators would be time-consuming and very expensive.
Size comparison of Venus and Earth. Credit: NASA/JPL/Magellan
Conclusion:
In sum, the potential benefits of terraforming Venus are clear. Humanity would have a second home, we would be able to add its resources to our own, and we would learn valuable techniques that could help prevent cataclysmic change here on Earth. However, getting to the point where those benefits could be realized is the hard part.
Like most proposed terraforming ventures, many obstacles need to be addressed beforehand. Foremost among these are transportation and logistics, mobilizing a massive fleet of robot workers and hauling craft to harness the necessary resources. After that, a multi-generational commitment would need to be made, providing financial resources to see the job through to completion. Not an easy task under the most ideal of conditions.
Suffice it to say, this is something that humanity cannot do in the short-run. However, looking to the future, the idea of Venus becoming our “Sister Planet” in every way imaginable – with oceans, arable land, wildlife and cities – certainly seems like a beautiful and feasible goal. The only question is, how long will we have to wait?
And if you liked the video posted above, come check out our Patreon page and find out how you can get these videos early while helping us bring you more great content!
Depending on how clear the atmosphere is, the Moon's color can vary dramatically from one eclipse to another. The numbers, called the Danjon Scale, will help you estimate the color of Sunday night's eclipse. Credit: Bob King
There are many ways to enjoy tomorrow night’s total lunar eclipse. First and foremost is to sit back and take in the slow splendor of the Moon entering and exiting Earth’s colorful shadow. You can also make pictures, observe it in a telescope or participate in a fun science project by eyeballing the Moon’s brightness and color. French astronomer Andre Danjon came up with a five-point scale back in the 1920s to characterize the appearance of the Moon during totality. The Danjon Scale couldn’t be simpler with just five “L values” from 0 to 4:
L=0: Very dark eclipse. Moon almost invisible, especially at mid-totality.
L=1: Dark Eclipse, gray or brownish in coloration. Details distinguishable only with difficulty.
L=2: Deep red or rust-colored eclipse. Very dark central shadow, while outer edge of umbra is relatively bright.
L=3: Brick-red eclipse. Umbral shadow usually has a bright or yellow rim.
L=4: Very bright copper-red or orange eclipse. Umbral shadow has a bluish, very bright rim.
The Danjon Scale is used to estimate the color of the totally eclipsed moon. By making your own estimate, you can contribute to atmospheric and climate change science. Credit: Alexandre Amorim
The last few lunar eclipses have been bright with L values of 2 and 3. We won’t know how bright totality will be during the September 27-28 eclipse until we get there, but chances are it will be on the bright side. That’s where you come in. Brazilian amateur astronomers Alexandre Amorim and Helio Carvalho have worked together to create a downloadable Danjonmeterto make your own estimate. Just click the link with your cellphone or other device and it will instantly pop up on your screen.
On the night of the eclipse, hold the phone right up next to the moon during mid-eclipse and estimate its “L” value with your naked eye. Send that number and time of observation to Dr. Richard Keen at [email protected]. For the sake of consistency with Danjon estimates made before mobile phones took over the planet, also compare the moon’s color with the written descriptions above before sending your final estimate.
Graph showing the change in heating of the ground in fractions of degrees (vertical axis) as affected by volcanic eruptions and greenhouse warming since 1979. The blue shows volcanic cooling, the red shows greenhouse warming. Notice the rising trend in warming after 1996. Credit: Dr. Richard Keen
Keen, an emeritus professor at the University of Colorado-Boulder Department of Atmospheric and Oceanic Sciences, has long studied how volcanic eruptions affect both the color of the eclipsed moon and the rate of global warming. Every eclipse presents another opportunity to gauge the current state of the atmosphere and in particular the dustiness of the stratosphere, the layer of air immediately above the ground-hugging troposphere. Much of the sunlight bent into Earth’s shadow cone (umbra) gets filtered through the stratosphere.
Volcanoes like Mt. Pinatubo, which erupted in June 1991 in the Philippines, inject tremendous quantities of ash and sulfur compounds high into the atmosphere, where they can temporarily block sunlight and cause a global drop in temperature. Credit: USGS
Volcanoes pump sulfur compounds and ash high into the atmosphere and sully the otherwise clean stratosphere with volcanic aerosols. These absorb both light and solar energy, a major reason why eclipses occurring after a major volcanic eruption can be exceptionally dark with L values of “0” and “1”.
The moon was so dark during the December 1982 eclipse that Dr. Keen required a 3-minute-long exposure at ISO 160 to capture it. Credit: Richard Keen
One of the darkest in recent times occurred on December 30, 1982 after the spectacular spring eruption of Mexico’s El Chichon that hurled some 7 to 10 million tons of ash into the atmosphere. Sulfurous soot circulated the globe for weeks, absorbing sunlight and warming the stratosphere by 7°F (4°C).
Lithograph from the German astronomy magazine Sirius compares the dark, featureless lunar disk during the 1884 eclipse a year after the eruption of Krakatoa (left) with a bright eclipse four years later, after the volcanic aerosols had settled out of the stratosphere (right).
Meanwhile, less sunlight reaching the Earth’s surface caused the northern hemisphere to cool by 0.4-0.6°C. The moon grew so ashen-black during totality that if you didn’t know where to look, you’d miss it.
Two photos of Earth’s limb or horizon from orbit at sunset before and after the Mt. Pinatubo eruption. The top view shows a relatively clear atmosphere, taken August 30,1984. The bottom photo was taken August 8, 1991, less than two months after the eruption. Two dark layers of aerosols between 12 and 15 miles high make distinct boundaries in the atmosphere. Credit: NASA
Keen’s research focuses on how the clean, relatively dust-free stratosphere of recent years may be related to a rise in the rate of global warming compared to volcano-induced declines prior to 1996. Your simple observation will provide one more data point toward a better understanding of atmospheric processes and how they relate to climate change.
This map shows the Moon during mid-eclipse at 9:48 p.m. CDT. Selected stars are labeled with their magnitudes. Examine the Moon backwards through binoculars and find a star it most closely matches to determine its magnitude. If for instance, the Moon looks about halfway in brightness between Hamal and Deneb, then it’s magnitude 1.6. Click to enlarge. Source: Stellarium
If you’d like to do a little more science during the eclipse, Keen suggests examining the moon’s color just after the beginning and before the end of totality to determine an ‘L’ value for the outer umbra. You can also determine the moon’s overall brightness or magnitude at mid-eclipse by comparing it to stars of known magnitude. The best way to do that is to reduce the moon down to approximately star-size by looking at it through the wrong end of a pair of 7-10x binoculars and compare it to the unreduced naked eye stars. Use this link for details on how it’s done along with the map I’ve created that has key stars and their magnitudes.
The table below includes eclipse events for four different time zones with emphasis on mid-eclipse, the time to make your observation. Good luck on Sunday’s science project and thanks for your participation!
Secretary-General Addresses Lima Climate Action High-level Meeting.
Credit: UN Photo/Mark Garten
Earlier this month, delegates from the various states that make up the UN met in Lima, Peru, to agree on a framework for the Climate Change Conference that is scheduled to take place in Paris next year. For over two weeks, representatives debated and discussed the issue, which at times became hotly contested and divisive.
In the end, a compromise was reached between rich and developing nations, which found themselves on opposite sides for much of the proceedings.
And while few member states walked away feeling they had received all they wanted, many expressed that the meeting was an important step on the road to the 2015 Climate Change Conference. It is hoped that this conference will, after 20 years of negotiations, create the first binding and universal agreement on climate change.
The 2015 Paris Conference will be the 21st session of the Conference of the Parties who signed the 1992 United Nations Framework Convention on Climate Change (UNFCCC) and the 11th session of the Meeting of the Parties who drafted the 1997 Kyoto Protocol.
The objective of the conference is to achieve a legally binding and universal agreement on Climate Change specifically aimed at curbing greenhouse gas emissions to limit global temperature increases to an average of 2 degrees Celsius above pre-industrial levels.
This map represents global temperature anomalies averaged from 2008 through 2012. Credit: NASA Goddard Institute for Space Studies/NASA Goddard’s Scientific Visualization Studio.
This temperature increase is being driven by increased carbon emissions that have been building steadily since the late 18th century and rapidly in the 20th. According to NASA, CO² concentrations have not exceeded 300 ppm in the upper atmosphere for over 400,000 years, which accounts for the whole of human history.
However, in May of last year, the National Oceanic and Atmospheric Administration (NOAA) announced that these concentrations had reached 400 ppm, based on ongoing observations from the Mauna Loa Observatory in Hawaii.
Meanwhile, research conducted by the U.S. Global Change Research Program indicates that by the year 2100, carbon dioxide emissions could either level off at about 550 ppm or rise to as high as 800. This could mean the difference between a temperature increase of 2.5 °C, which is sustainable, and an increase of 4.5 °C (4.5 – 8 °F), which would make life untenable for many regions of the planet.
Hence the importance of reaching, for the first time in over 20 years of UN negotiations, a binding and universal agreement on the climate that will involve all the nations of the world. And with the conclusion of the Lima Conference, the delegates have what they believe will be a sufficient framework for achieving that next year.
While many environmental groups see the framework as an ineffectual compromise, it was hailed by members of the EU as a step towards the long-awaited global climate deal that began in 1992.
“The decisions adopted in Lima pave the way for the adoption of a universal and meaningful agreement in 2015,” said UN Secretary-General Ban Ki-moon in a statement issued at the conclusion of the two-week meeting. In addition, Peru’s environment minister – Manuel Pulgar-Vidal, who chaired the summit – was quoted by the BBC as saying: “As a text it’s not perfect, but it includes the positions of the parties.”
Al Gore and UNEP Executive Director Achim Steiner at the China Pavilion at the Lima Conference. Credit: UNEP
Amongst the criticisms leveled by environmental groups is the fact that many important decisions were postponed, and that the draft agreement contained watered-down language.
For instance, on national pledges, it says that countries “may” include quantifiable information showing how they intend to meet their emissions targets, rather than “shall”. By making this optional, environmentalists believe that signatories will be entering into an agreement that is not binding and therefore has no teeth.
However, on the plus side, the agreement kept the 194 members together and on track for next year. Concerns over responsibilities between developed and developing nations were alleviated by changing the language in the agreement, stating that countries have “common but differentiated responsibilities”.
Other meaningful agreements were reached as well, which included boosted commitments to a Green Climate Fund (GCF), financial aid for “vulnerable nations”, new targets to be set for carbon emission reductions, a new process of Multilateral Assessment to achieve new levels of transparency for carbon-cutting initiatives, and new calls to raise awareness by putting climate change into school curricula.
In addition, the Lima Conference also led to the creation of The 1 Gigaton Coalition, a UN-coordinated group dedicated to promoting renewable energy. As stated by the UNEP, this group was created “to boost efforts to save billions of dollars and billions of tonnes of CO² emissions each year by measuring and reporting reductions of greenhouse gas emissions resulting from projects and programs that promote renewable energy and energy efficiency in developing countries.”
A massive, over 7-metre-high balloon, representing one tonne of carbon dioxide (CO2). Credit: UN Photo/Mark Garten
Coordinated by the United Nations Environment Programme (UNEP) with the support of the Government of Norway, they will be responsible for measuring CO² reductions through the application of renewable energy projects. The coalition was formed in light of the fact that while many nations have such initiatives in place, they are not measuring or reporting the drop in greenhouse gases that result.
They believe that, if accurately measured, these drops in emissions would equal 1 Gigaton by the year 2020. This would not only be beneficial to the environment, but would result in a reduced financial burden for governments all across the world.
As UNEP Executive Director Achim Steiner stated in a press release: “Our global economy could be $18 trillion better off by 2035 if we adopted energy efficiency as a first choice, while various estimates put the potential from energy efficient improvements anywhere between 2.5 and 6.8 gigatons of carbon per year by 2030.”
Ultimately, the 1 Gigaton Coalition hopes to provide the information that demonstrates unequivocally that energy efficiency and renewables are helping to close the gap between current emissions levels and what they will need to come down to if we hope to meet a temperature increase of just 2 °C. This, as already stated, could mean the difference between life and death for many people, and ultimately for the environment as a whole.
The location of UNFCCC talks are rotated by regions throughout United Nations countries. The 2015 conference will be held at Le Bourget from 30 November to 11 December 2015.
Venus really sucks. It’s as hot as an oven with a dense, poisonous atmosphere. But how did it get that way?
Venus sucks. Seriously, it’s the worst. The global temperature is as hot as an oven, the atmospheric pressure is 90 times Earth, and it rains sulfuric acid. Every part of the surface of Venus would kill you dead in moments.
Let’s push Venus into the Sun and be done with that terrible place. Its proximity is lowering our real estate values and who knows what sort of interstellar monstrosities are going to set up shop there, and be constantly knocking on our door to borrow the mower, or a cup or sugar, or sneak into our yard at night and eat all our dolphins.
You might argue that Venus is worth saving because it’s located within the Solar System’s habitable zone, that special place where water could exist in a liquid state on the surface. But we’re pretty sure it doesn’t have any liquid water. Venus may have been better in the past, clearly it started hanging out with wrong crowd, taking a bad turn down a dark road leading it to its current state of disrepair.
Could Venus have been better in the past? And how did it go so wrong? In many ways, Venus is a twin of the Earth. It’s almost the same size and mass as the Earth, and it’s made up of roughly the same elements. And if you stood on the surface of Venus, in the brief moments before you evacuated your bowels and died horribly, you’d notice the gravity feels pretty similar.
In the ancient past, the Sun was dimmer and cooler than it is now. Cool enough that Venus was much more similar to Earth with rivers, lakes and oceans. NASA’s Pioneer spacecraft probed beneath the planet’s thick clouds and revealed that there was once liquid water on the surface of Venus. And with liquid water, there could have been life on the surface and in those oceans.
Here’s where Venus went wrong. It’s about a third closer to the Sun than Earth, and gets roughly double the solar radiation. The Sun has been slowly heating up over the millions and billions of years. At some point, the planet reached a tipping point, where the water on the surface of Venus completely evaporated into the atmosphere.
False color radar topographical map of Venus provided by Magellan. Credit: Magellan Team/JPL/NASA
Water vapor is a powerful greenhouse gas, and this only increased the global temperature, creating a runaway greenhouse effect on Venus. The ultraviolet light from the Sun split apart the water vapor into oxygen and hydrogen. The hydrogen was light enough to escape the atmosphere of Venus into space, while the oxygen recombined with carbon to form the thick carbon dioxide atmosphere we see today. Without that hydrogen, Venus’ water is never coming back.
Are you worried about our changing climate doing that here? Don’t panic. The amount of carbon dioxide released into the atmosphere of Venus is incomprehensible. According to the IPCC, the folks studying global warming, human activities have no chance of unleashing runaway global warming. We’ll just have the regular old, really awful global warming. So, it’s okay to panic a bit, but do it in the productive way that results in your driving your car less.
The Sun is still slowly heating up. And in a billion years or so, temperatures here will get hot enough to boil the oceans away. And then, Earth and Venus will be twins again and then we can push them both into the Sun.
I know, I said the words “climate change”. Feel free to have an argument in the comments below, but play nice and bring science.

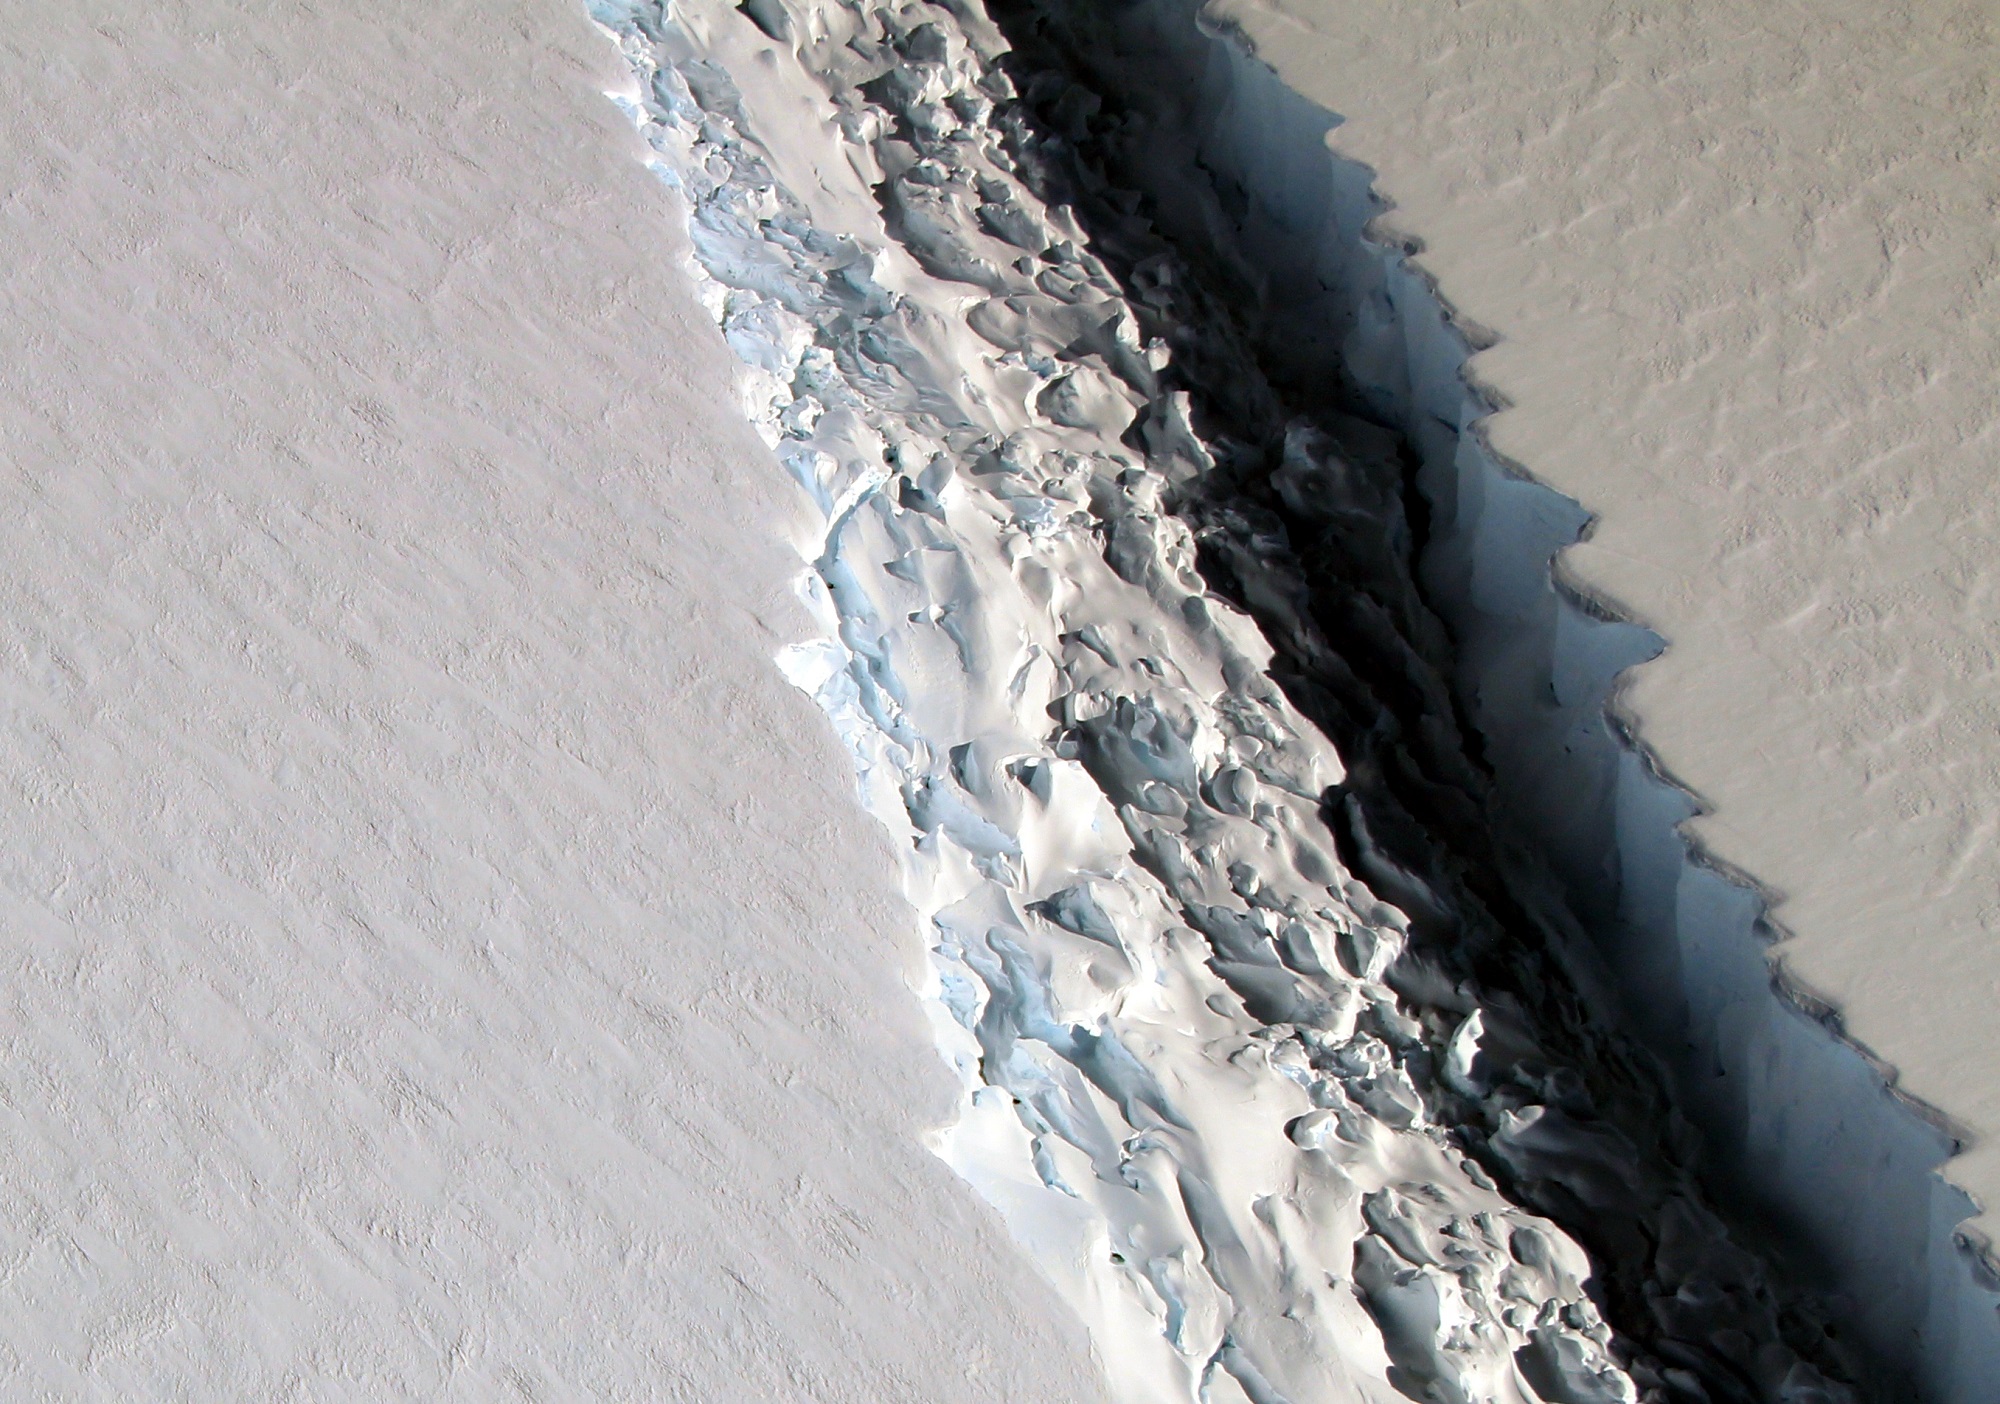
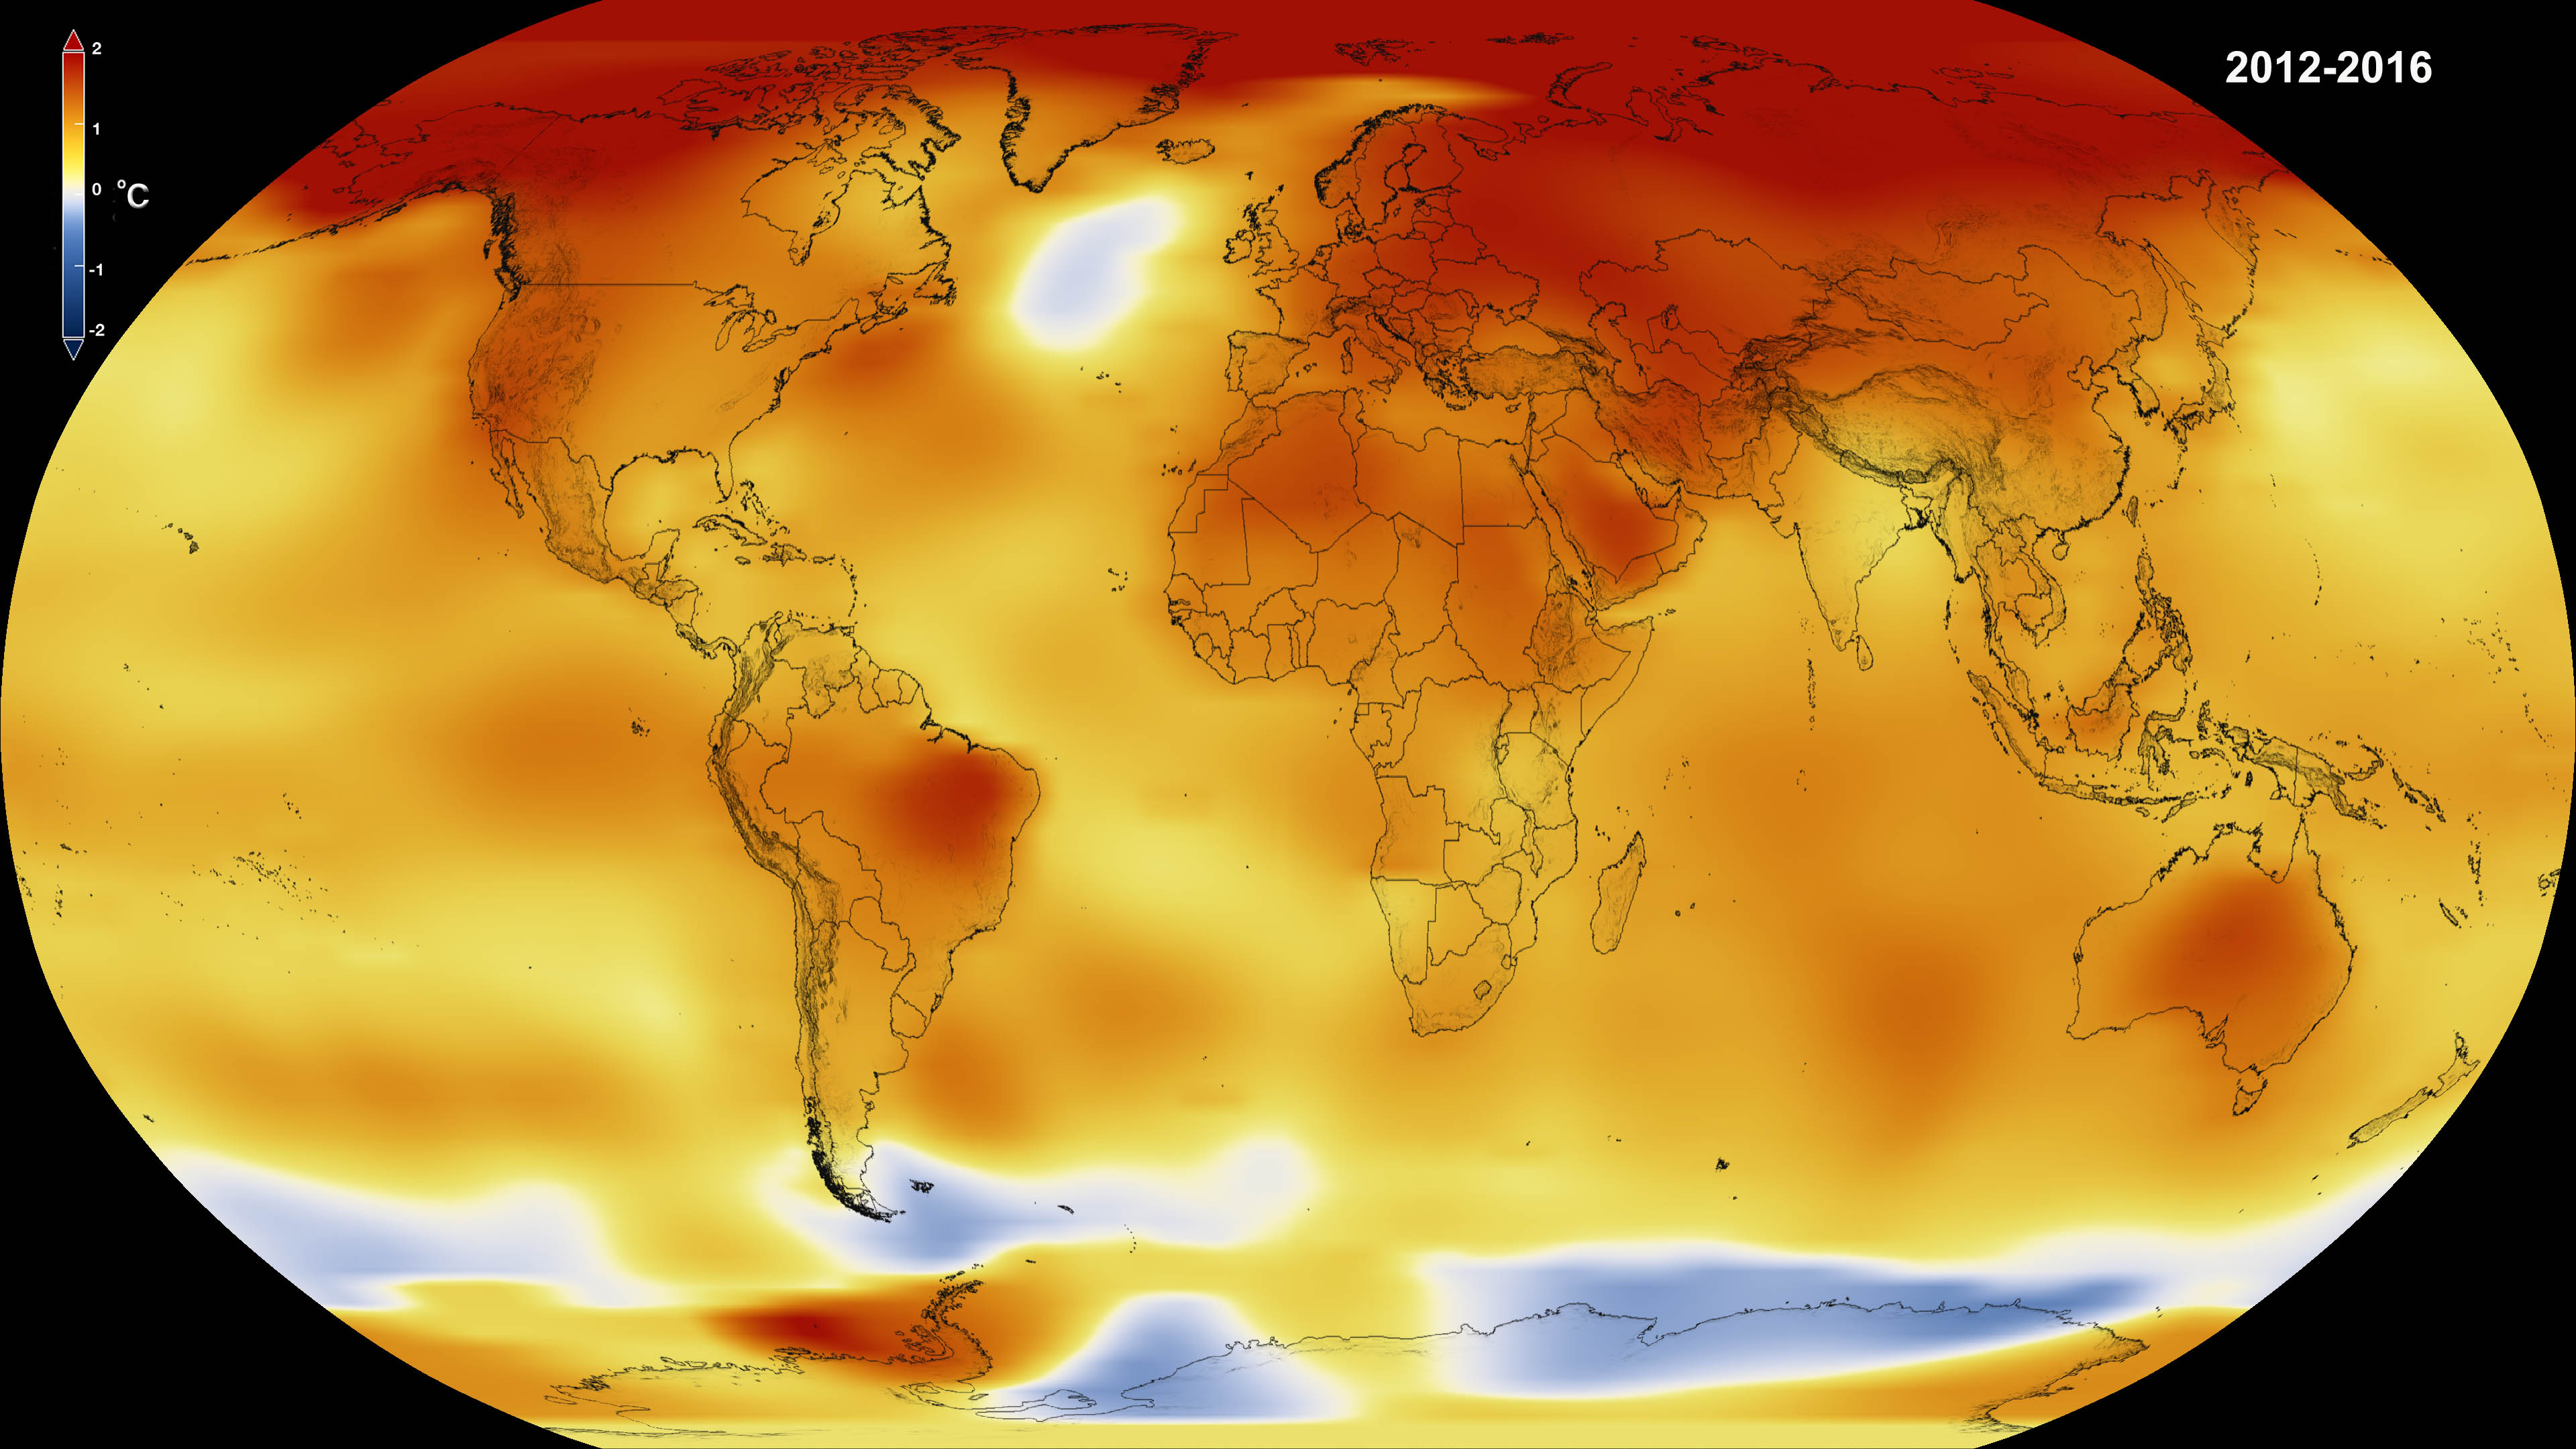


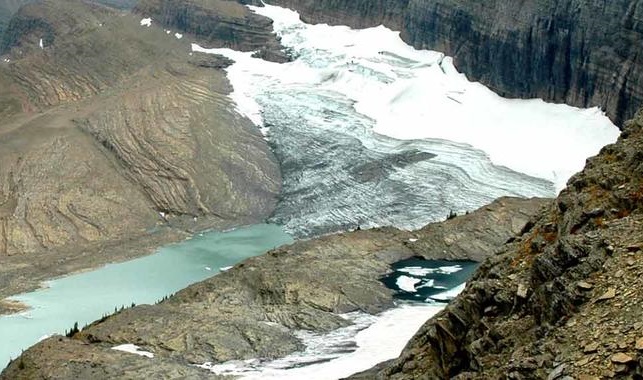
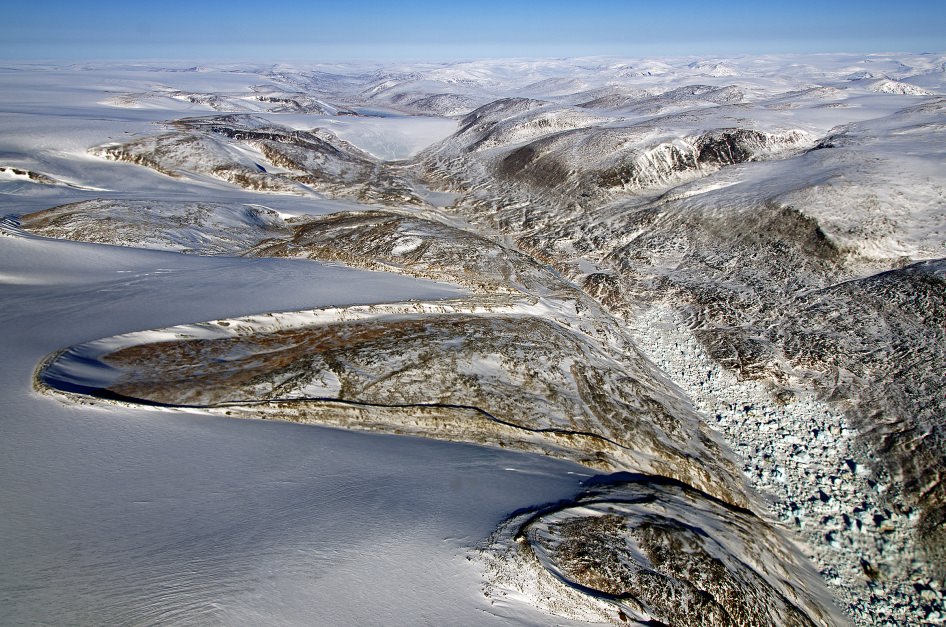


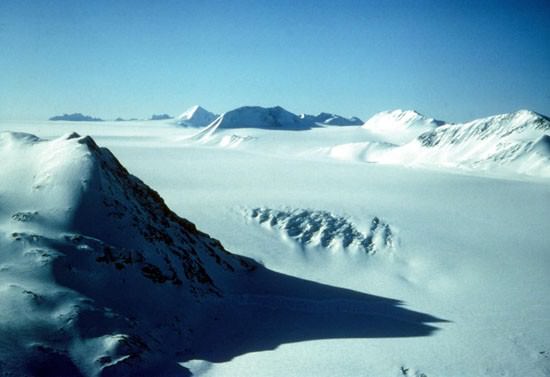
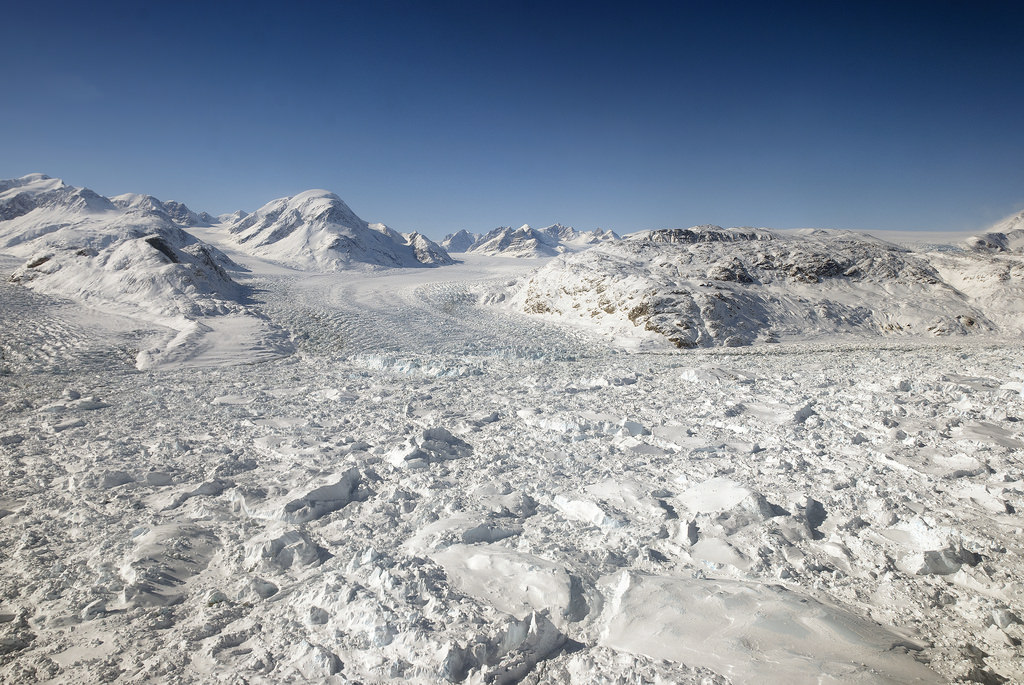
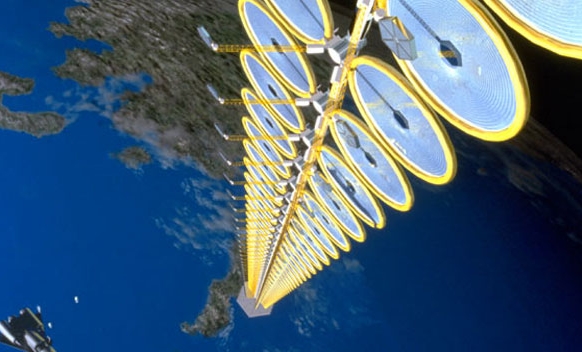
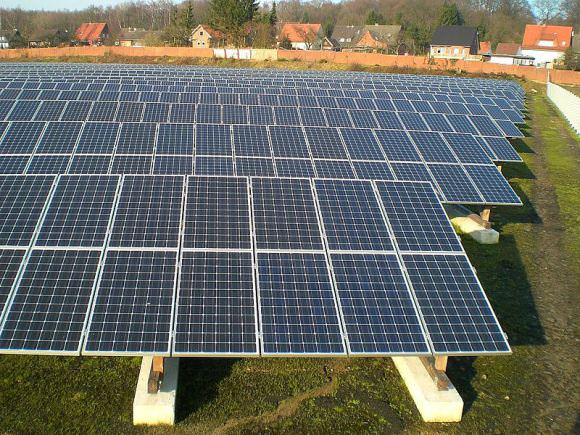

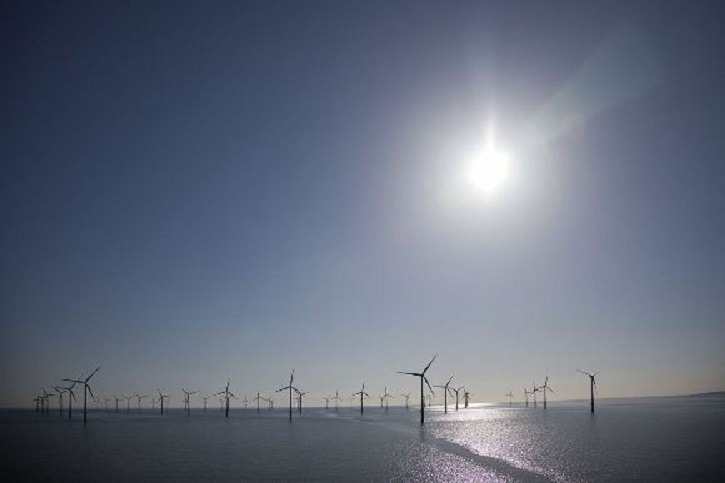
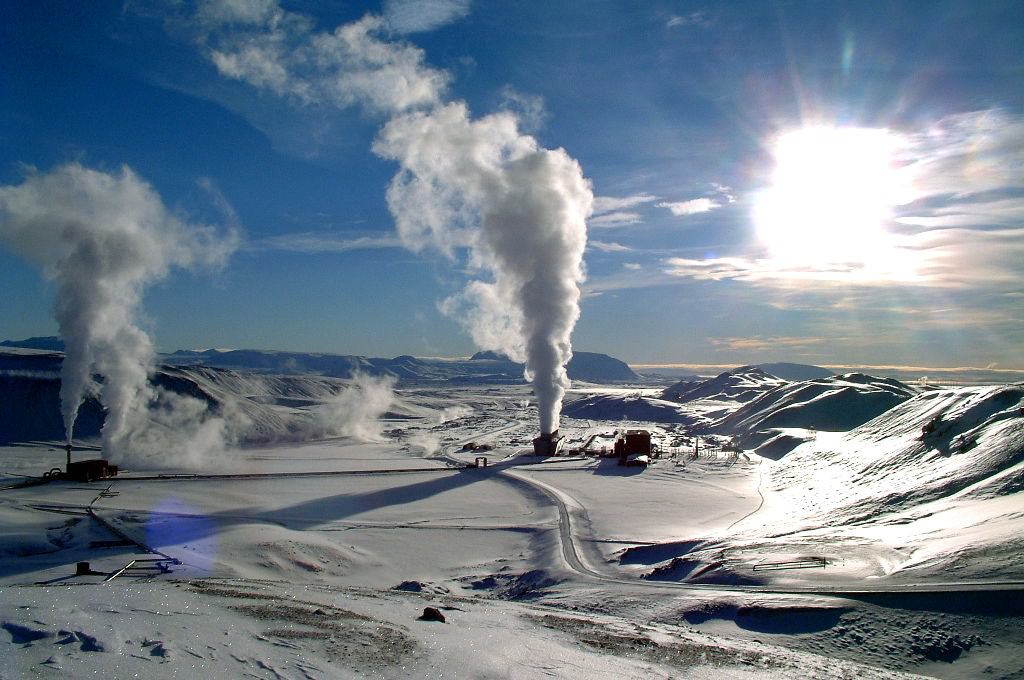
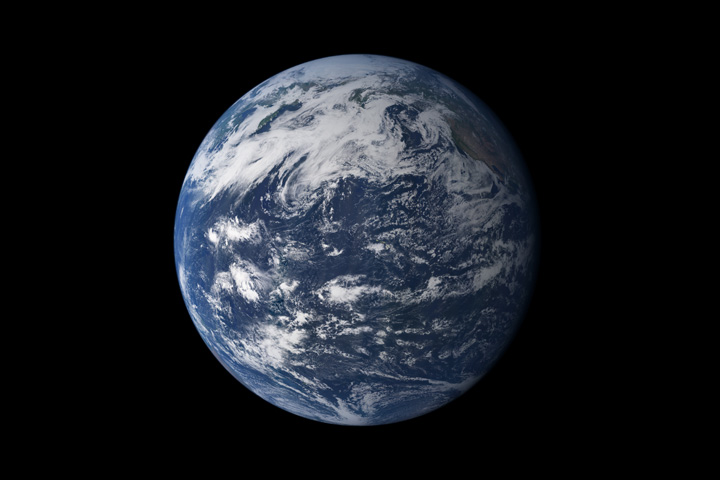
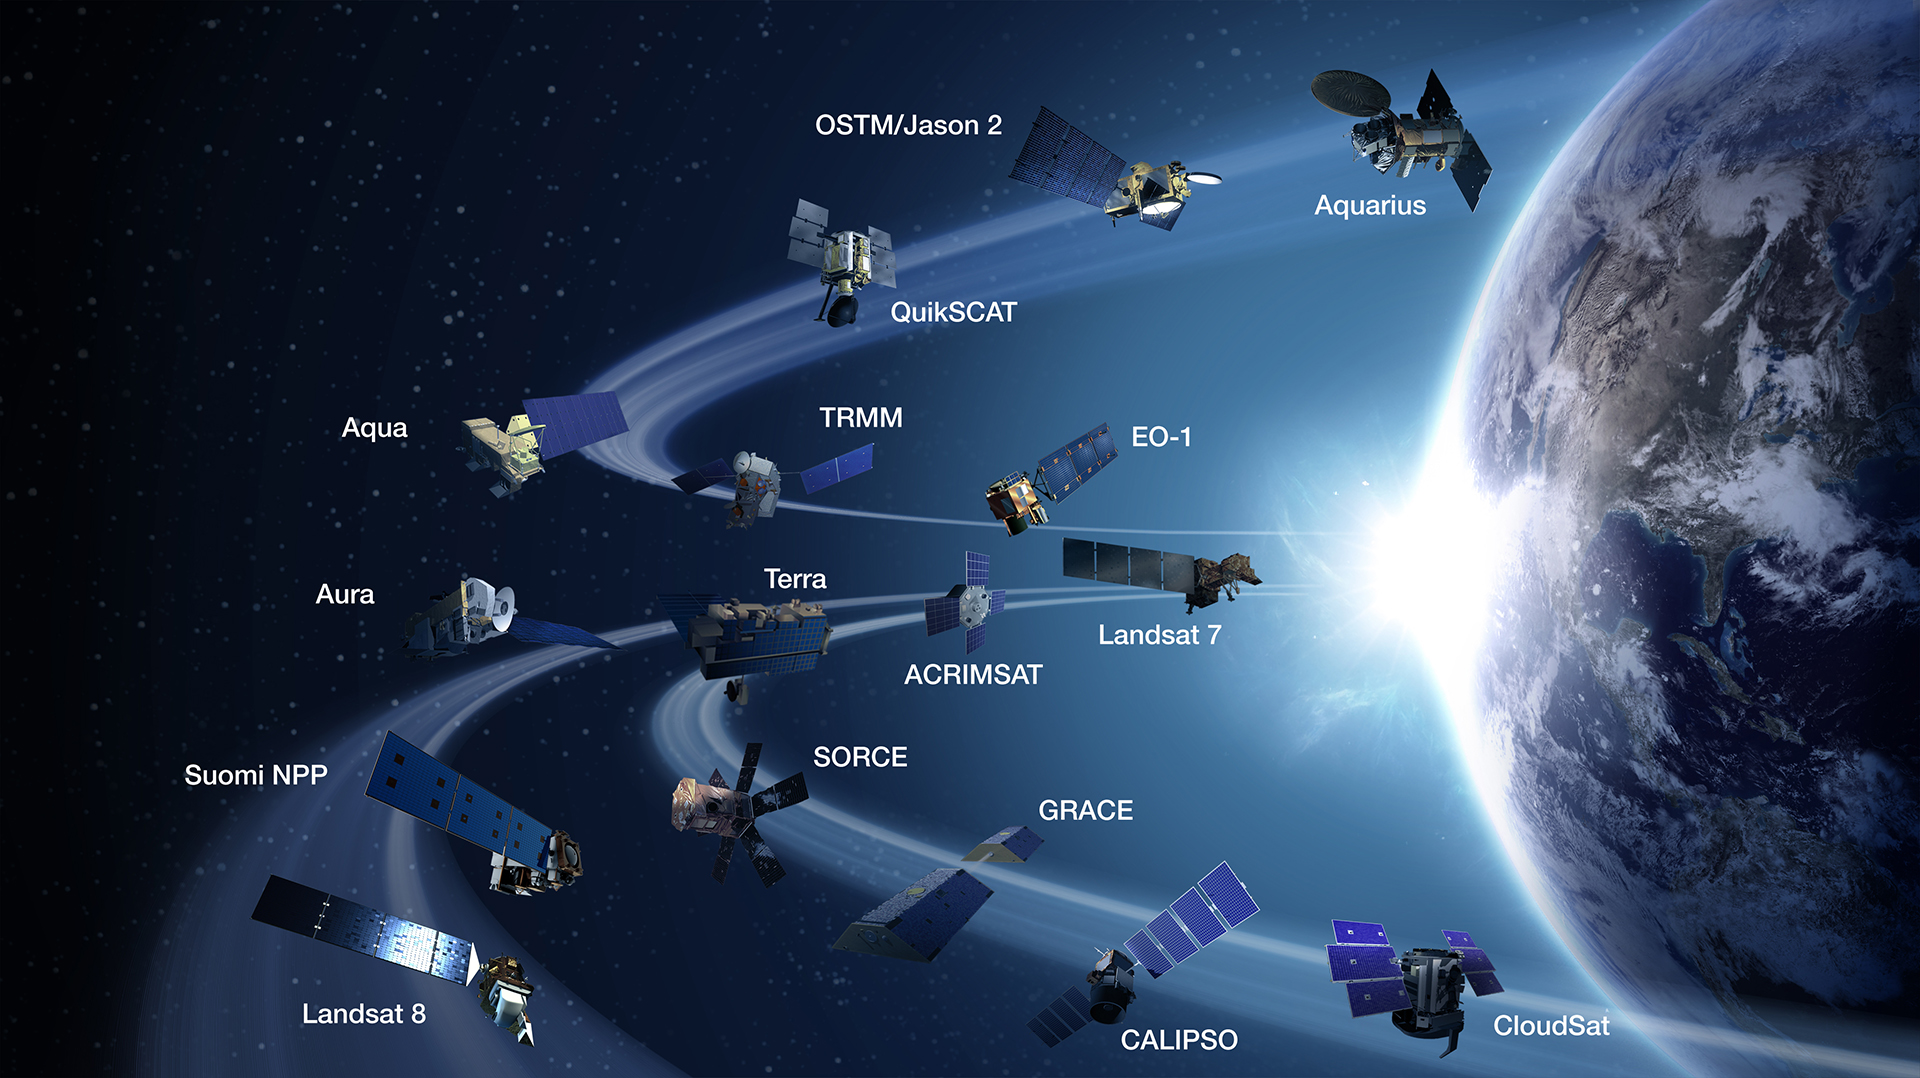
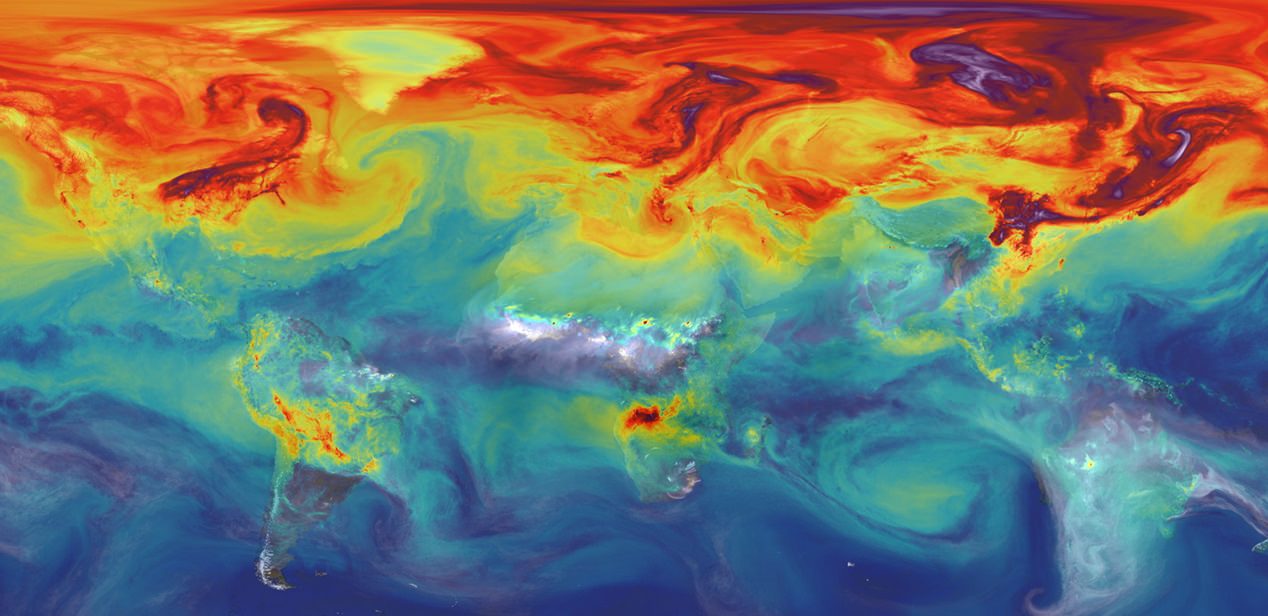
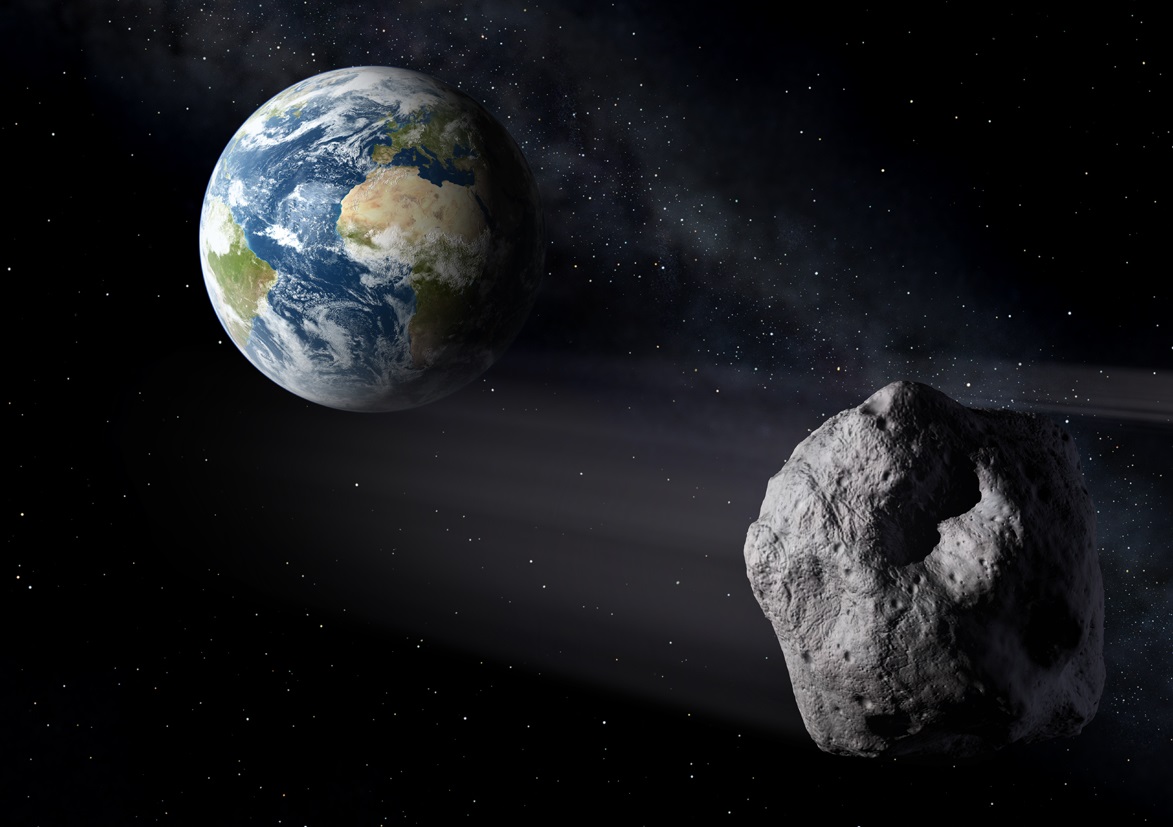

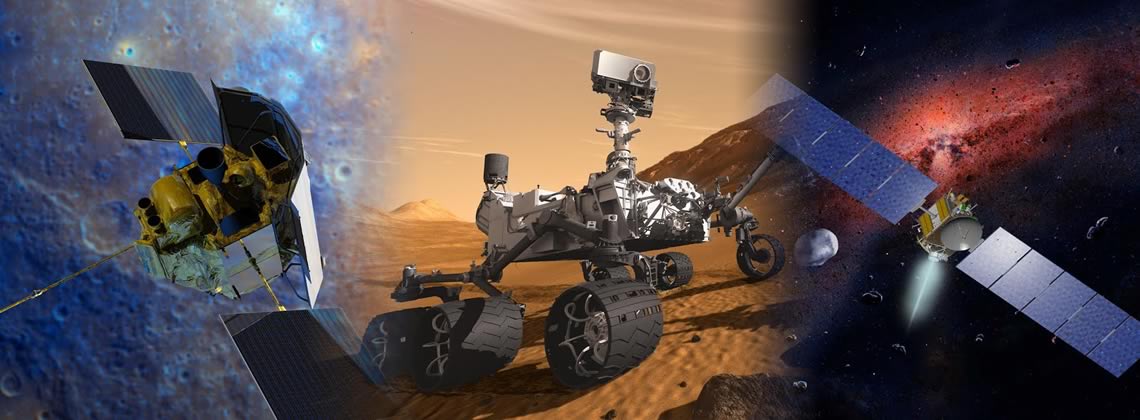

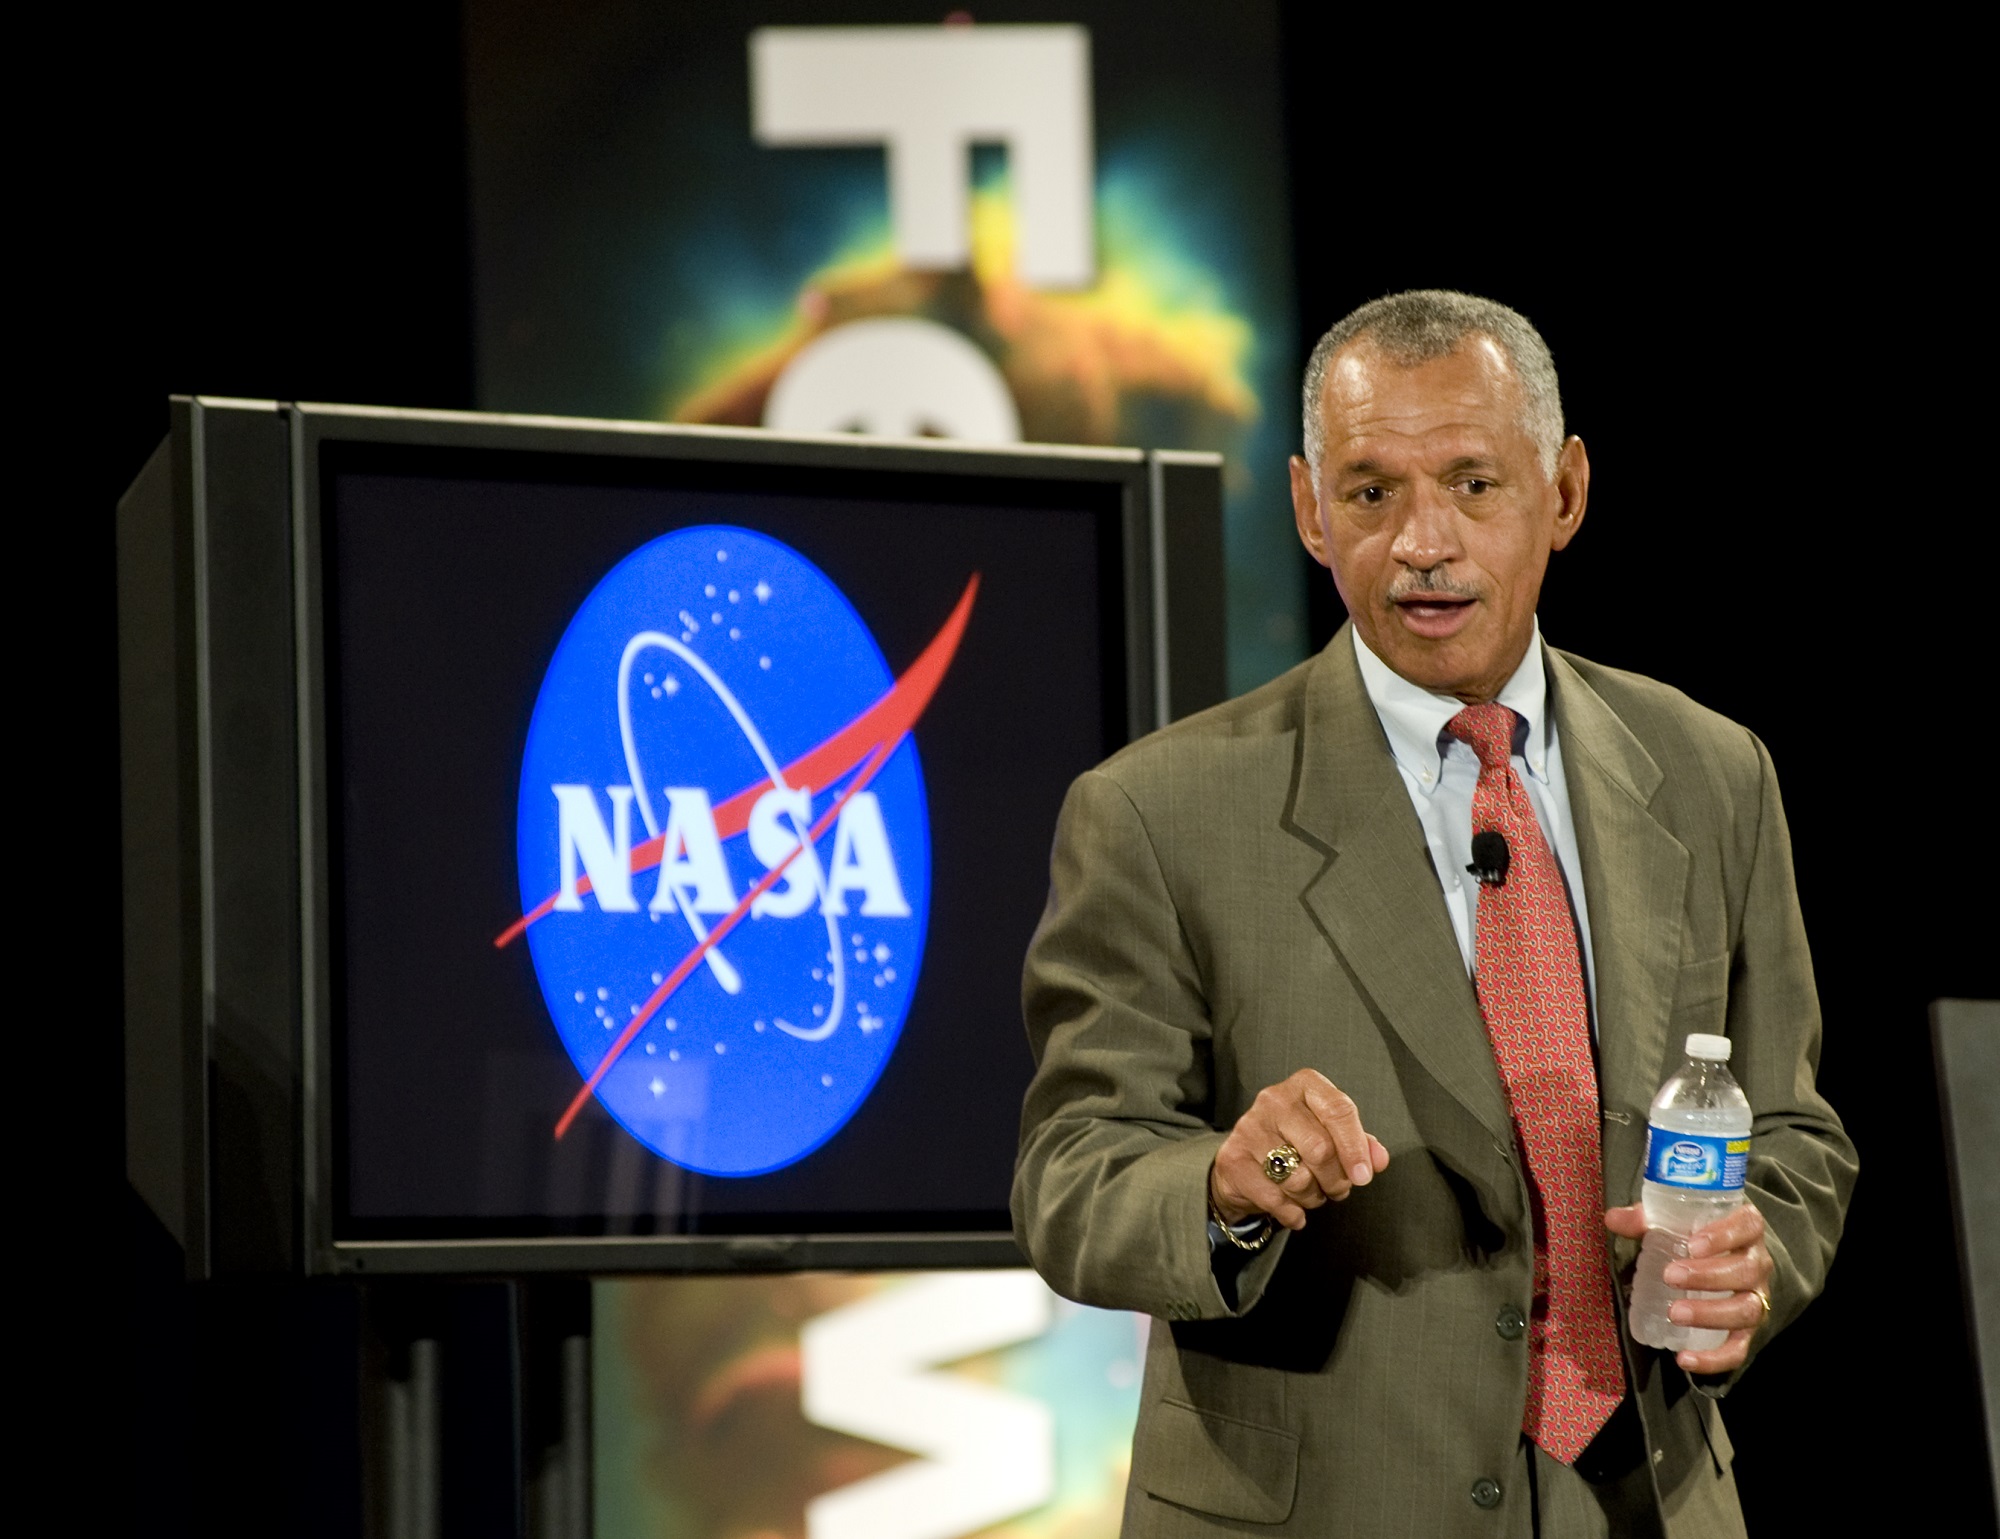

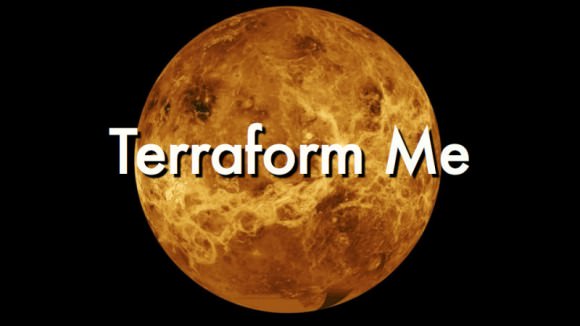

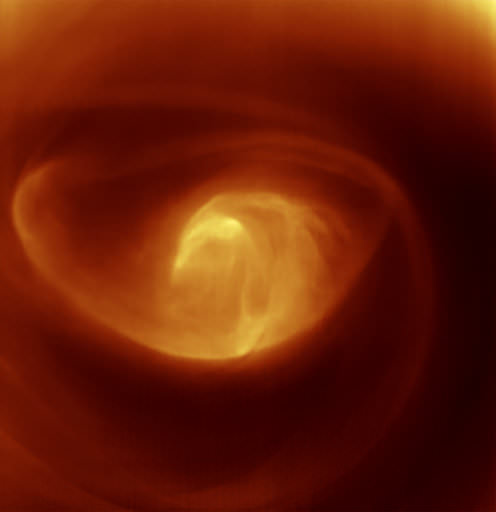
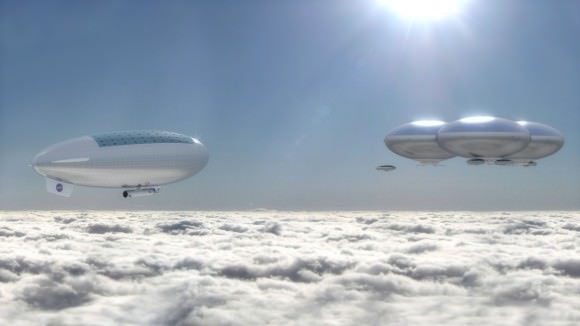

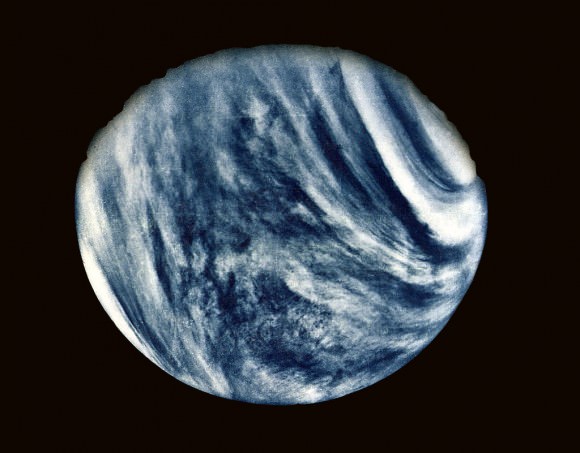
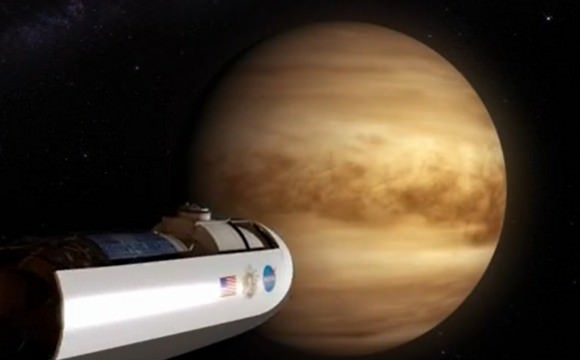
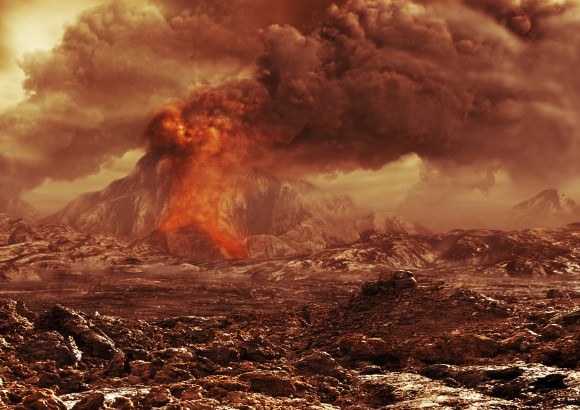
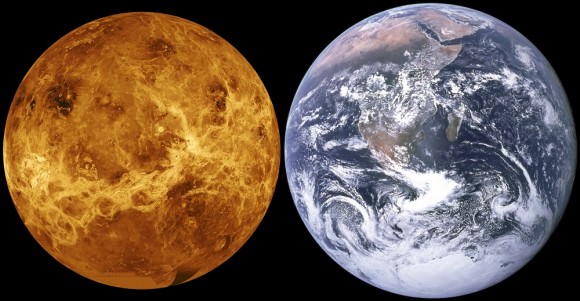
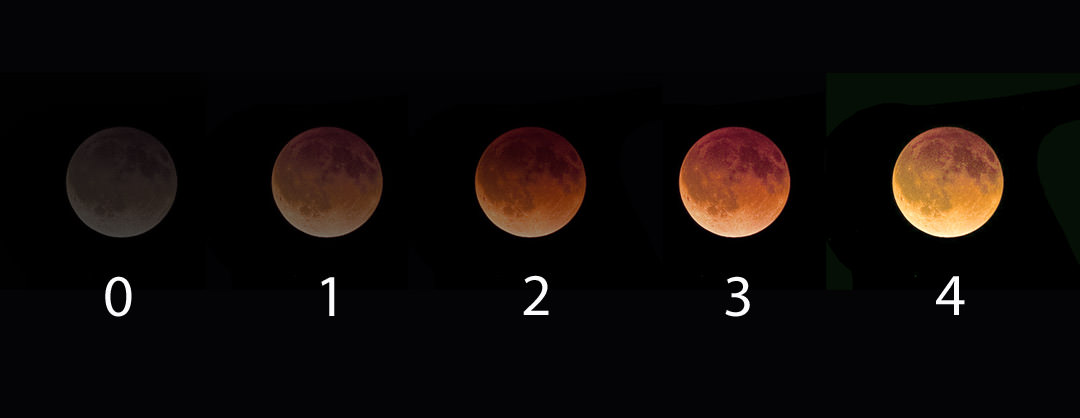
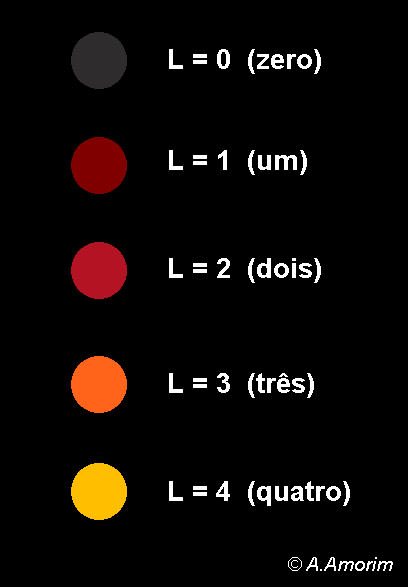
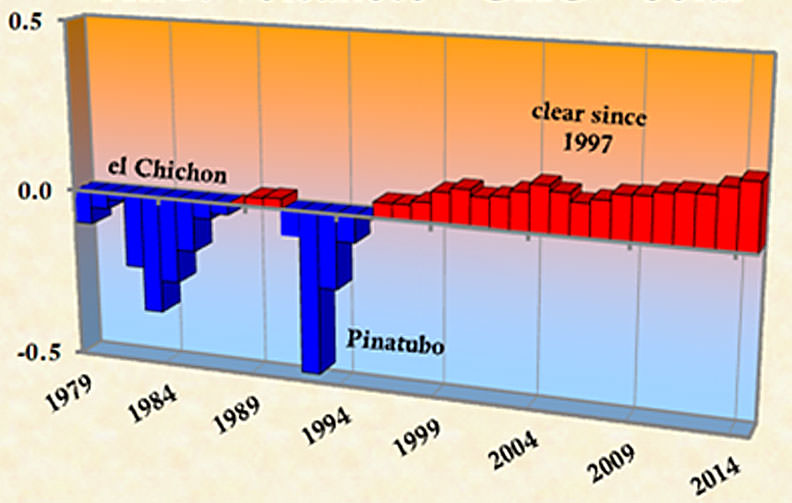

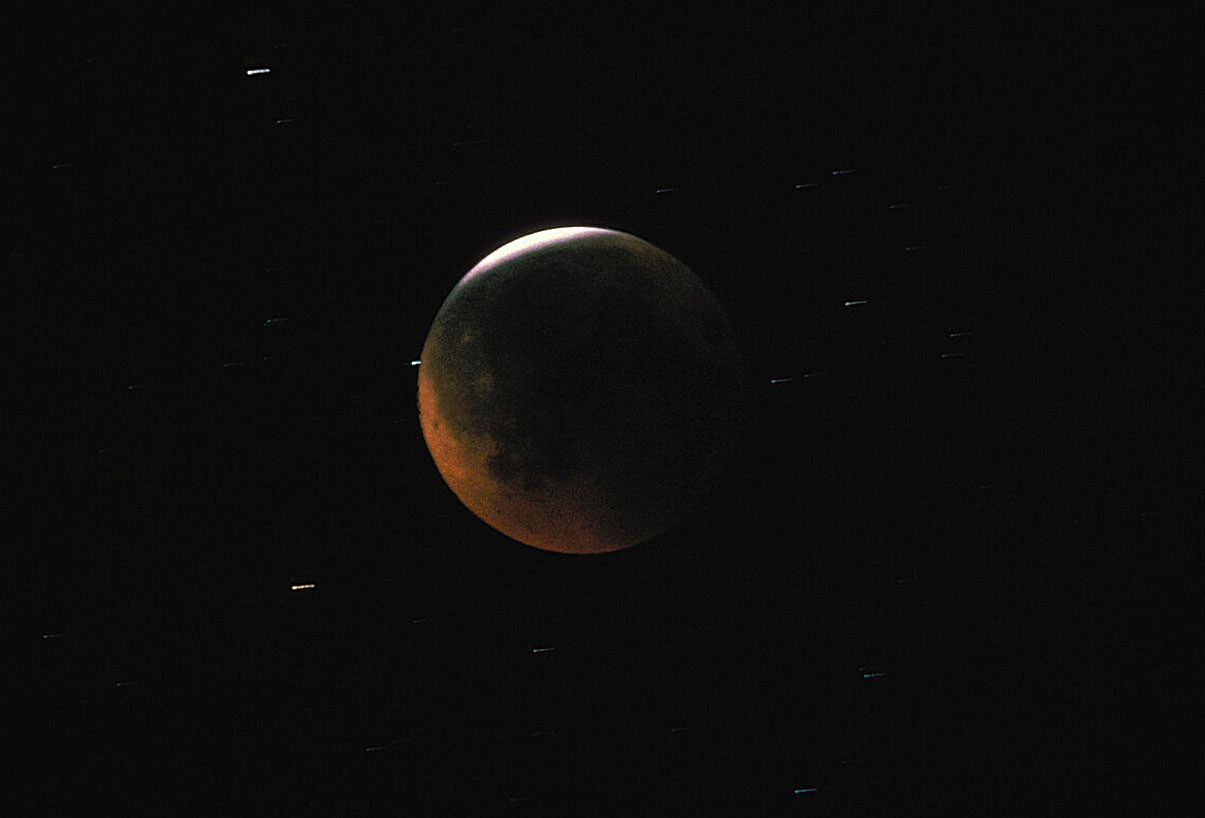

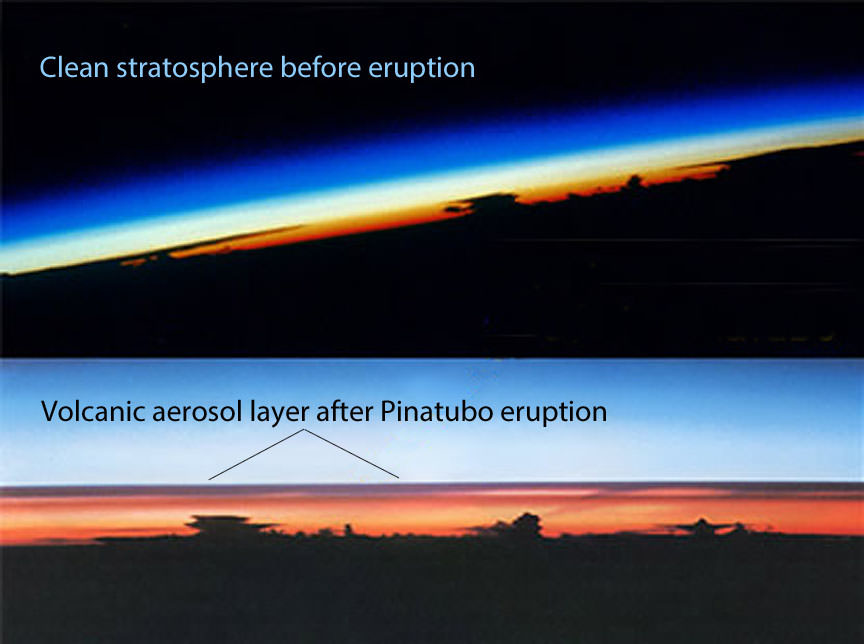
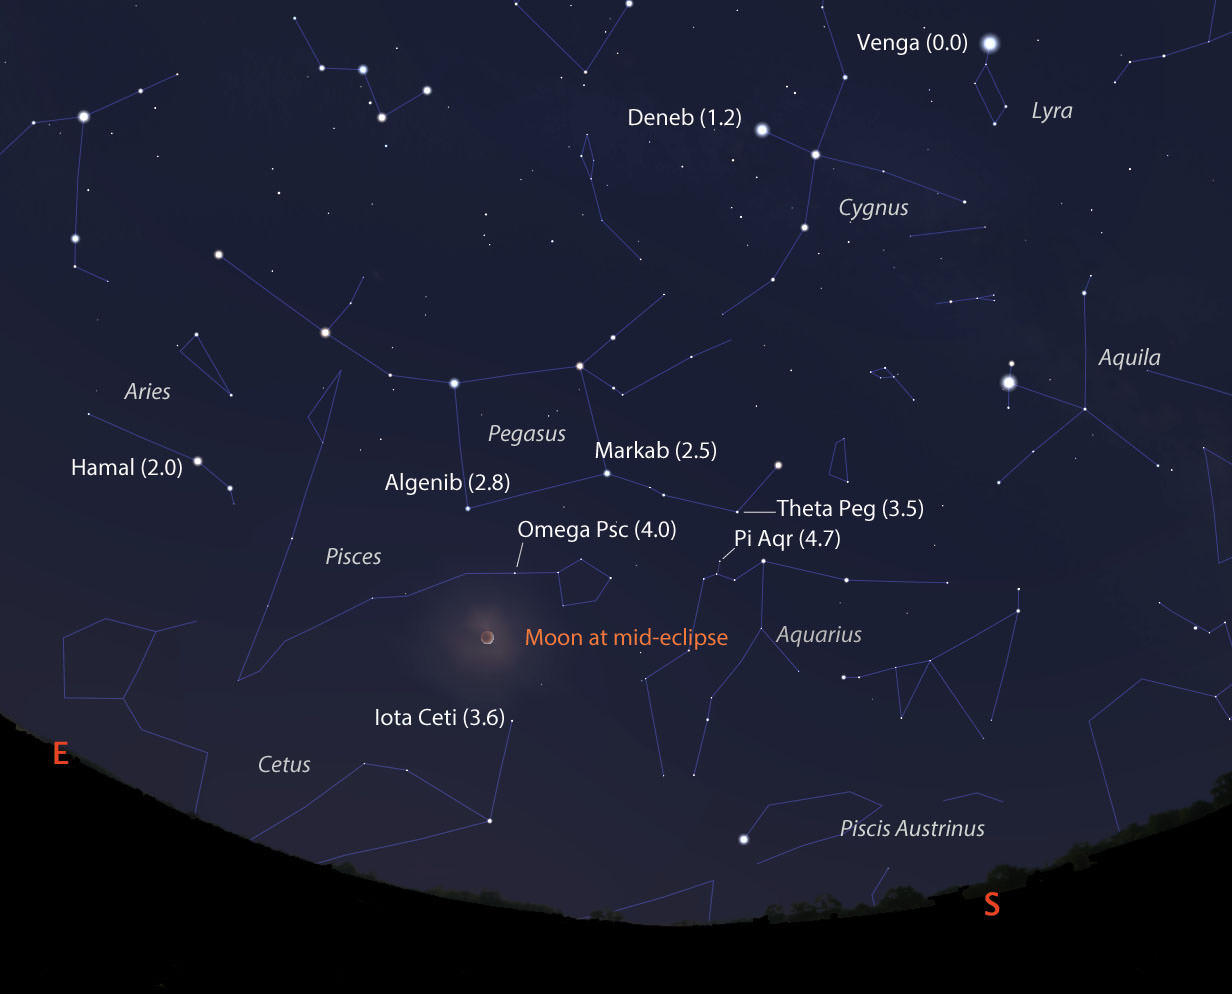
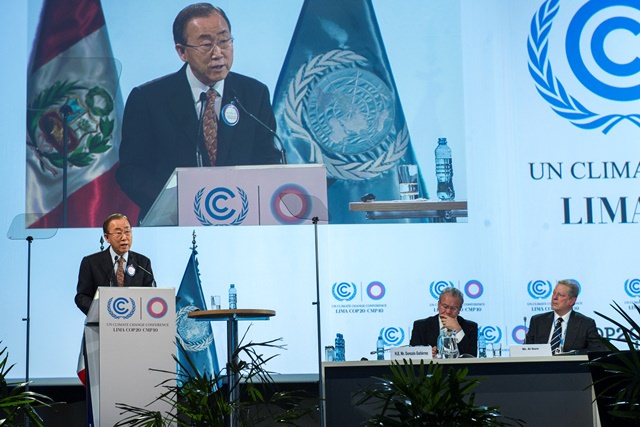

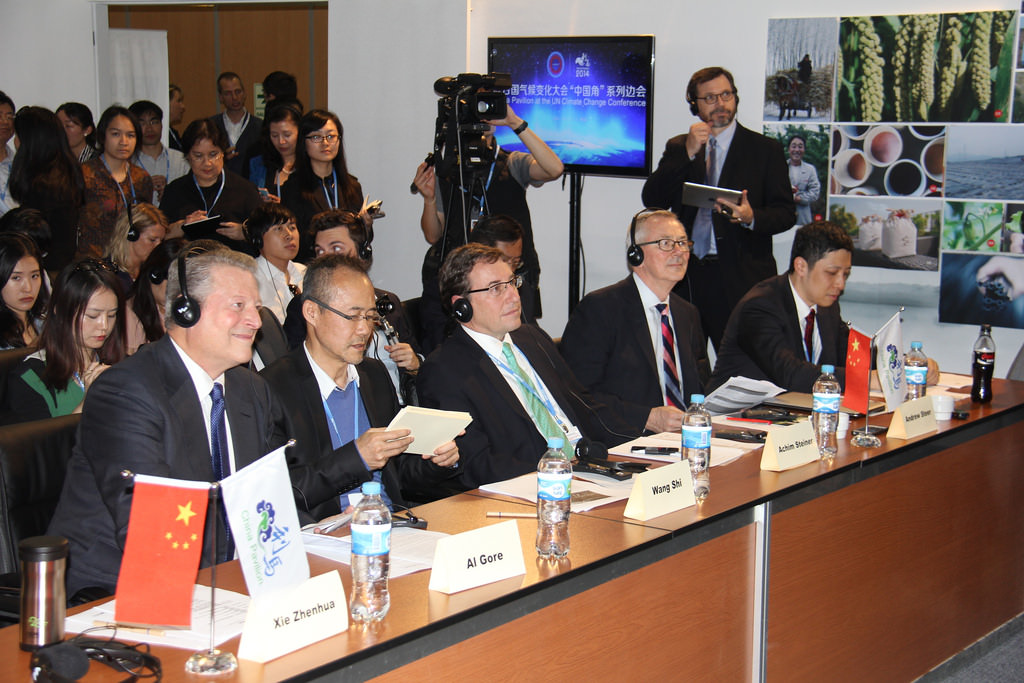
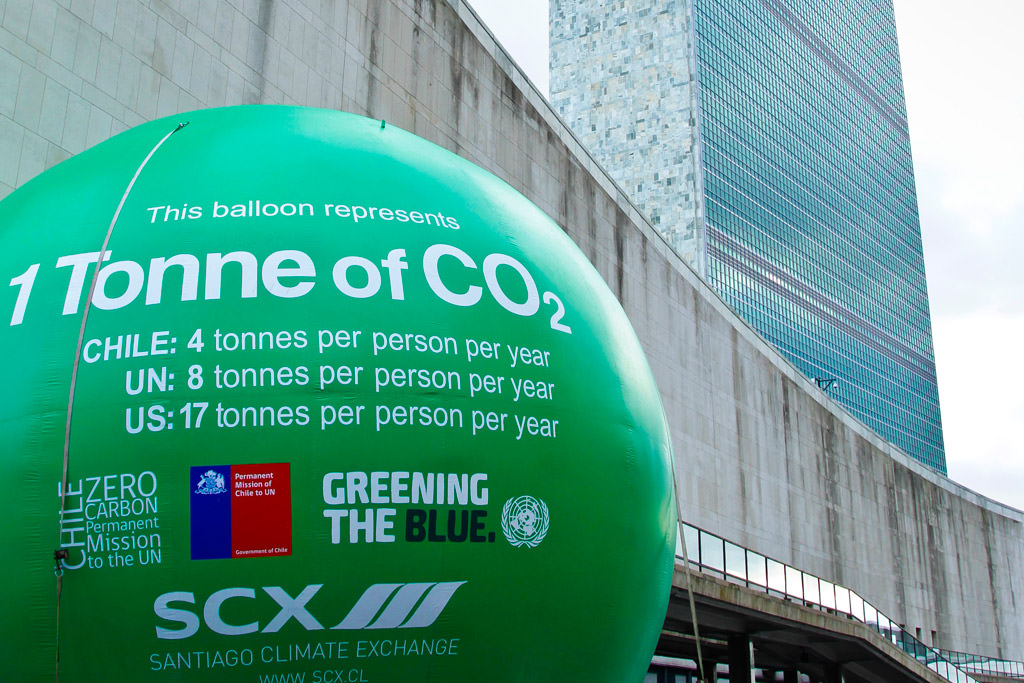
